How Similar Are Pennsylvania and Ohio?

At least politically.

According to this piece from FiveThirtyEight, maybe not as much as they used to be. From a data visualisation standpoint, what stuck out at me was this plot of correlations of how similar various states are. Basically, the closer to the number 1, the more similar, the closer to 0, the less.
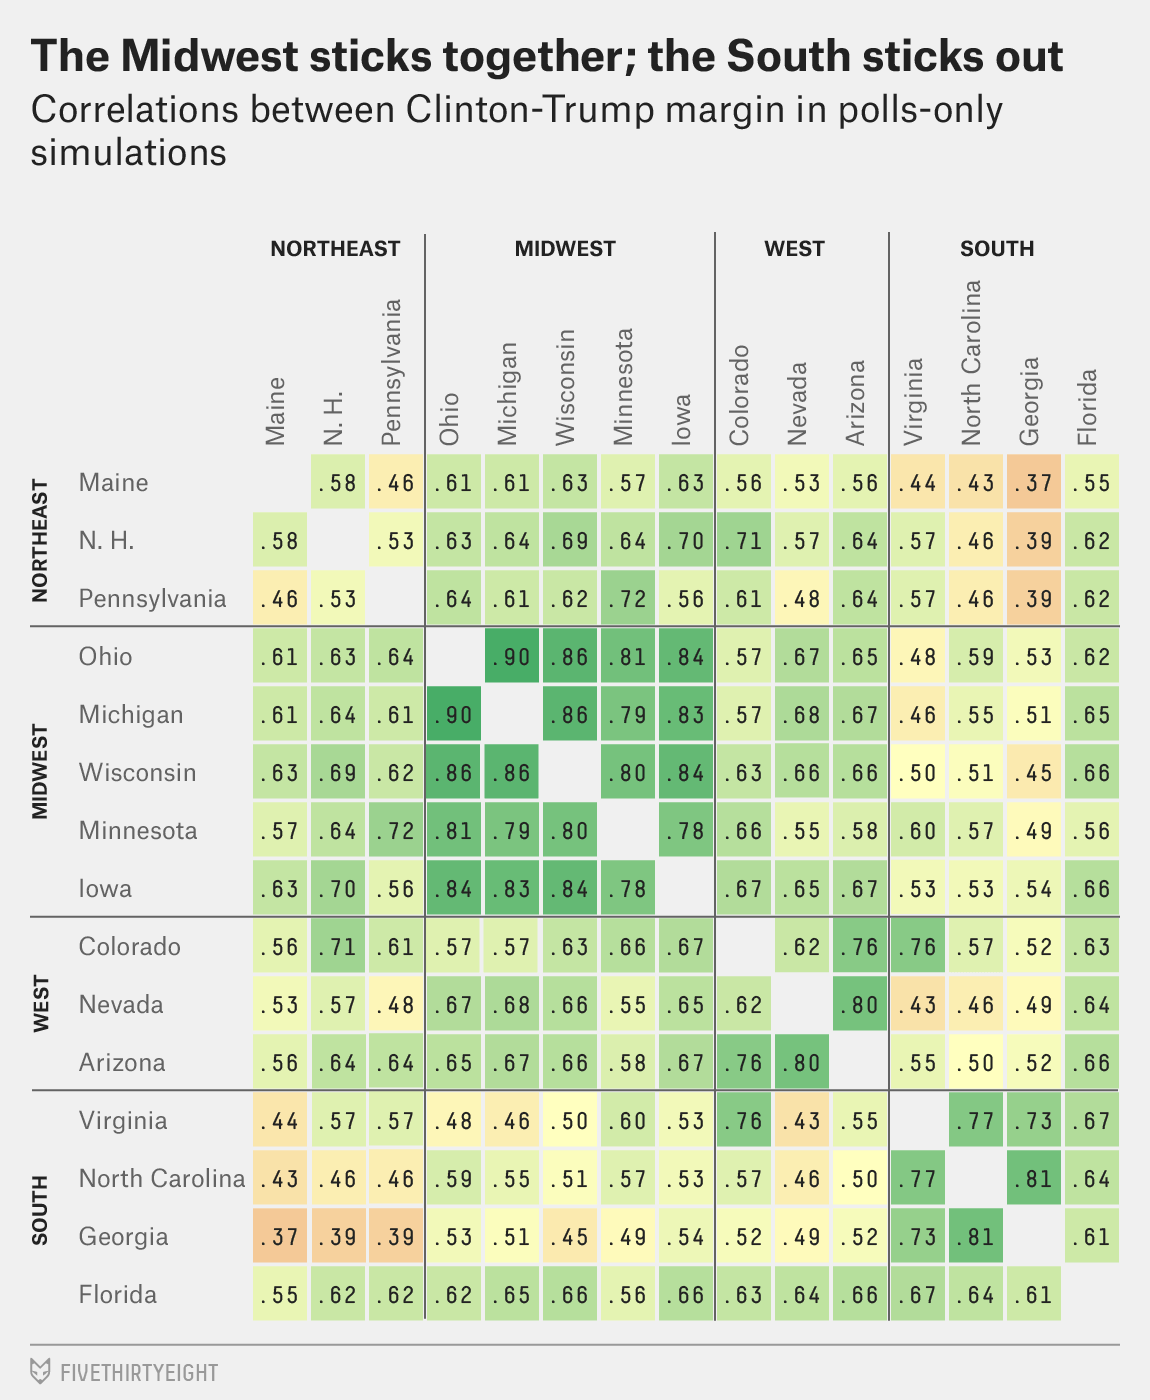
Turns out they're not so close
Turns out they’re not so close

I might question the value of placing the numbers within the squares—see what I did there?—because the colours could be used with a legend to indicate the range of similarity. But if this were an interactive piece, it certainly could be done to reveal the number on tap or mouseover.

Anyway, it was interesting to see that among swing states, Pennsylvania is least like Georgia but most like Minnesota. The former, certainly. The latter, who would have guessed, don’t ya know.

Credit for the piece goes to the FiveThirtyEight graphics department.

Religiousness

Today’s post is about religion. One of the two things you are never supposed to talk about in good company. And since the other is politics and since I cover that here frequently, let’s just go all in, shall we?

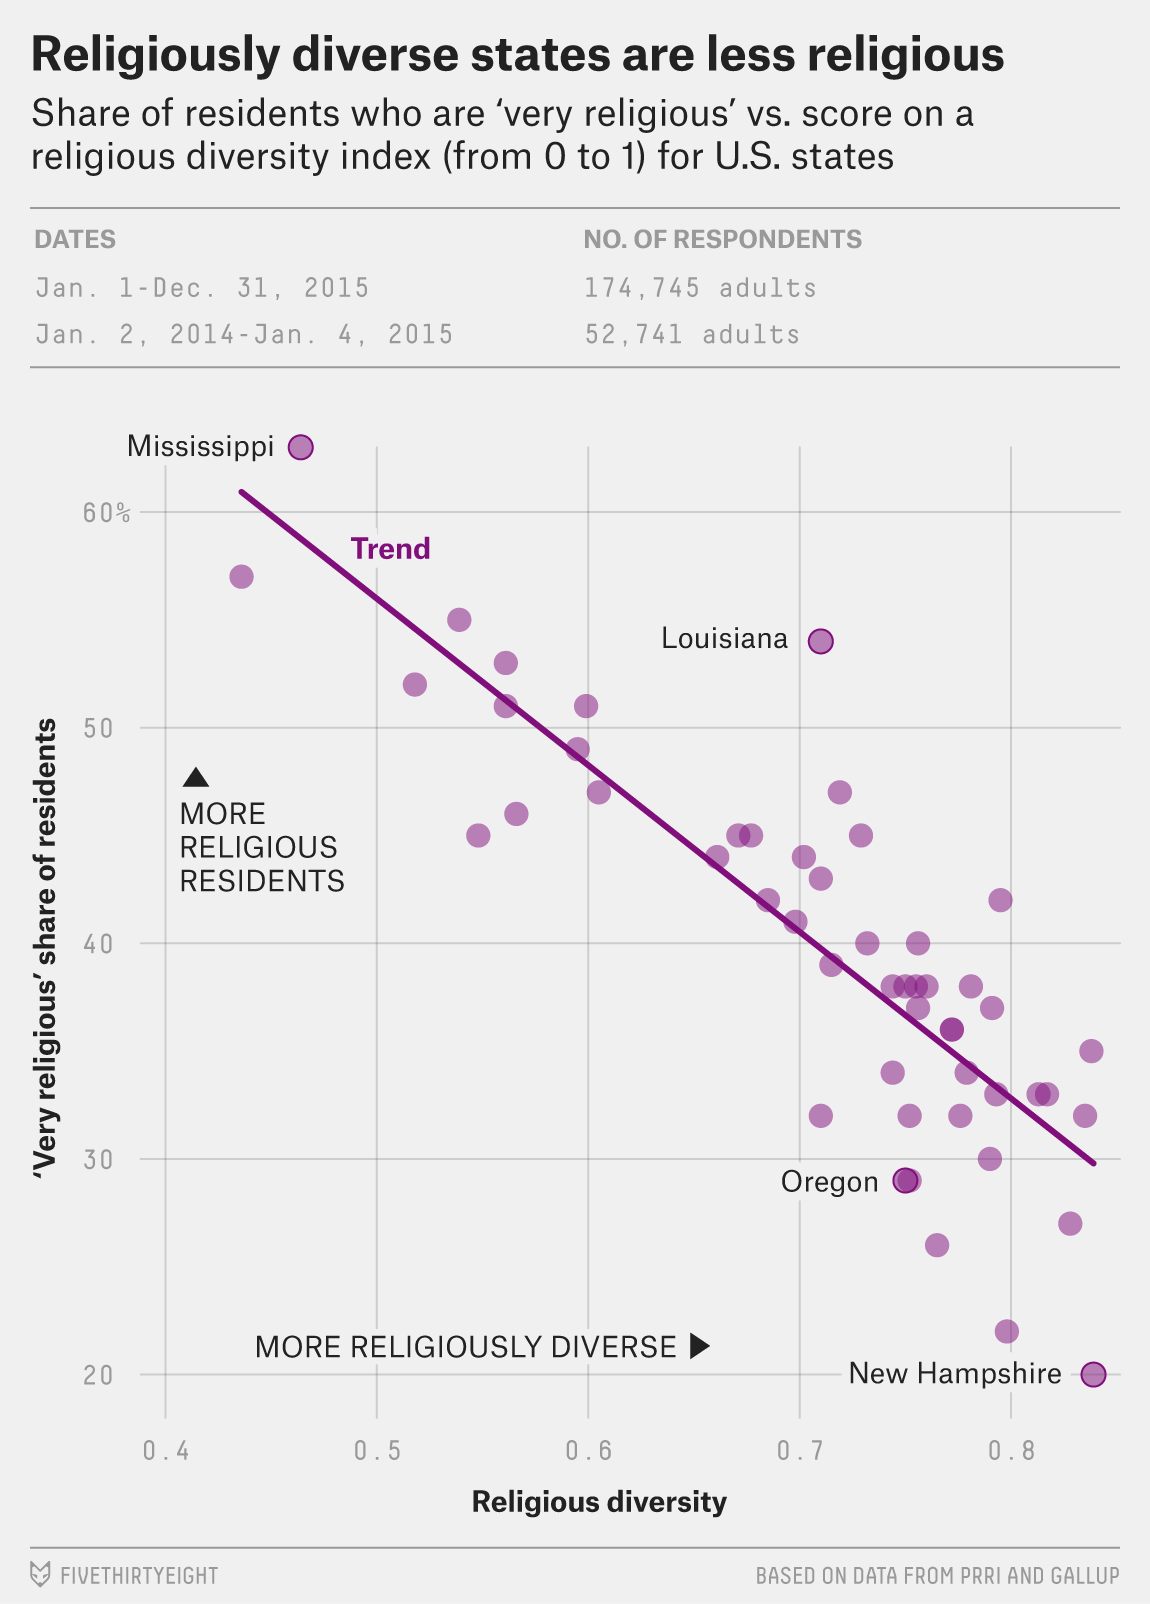
FiveThirtyEight has an interesting piece about religious diversity and a corresponding lack of religiousness. From a graphics standpoint, the central piece is this chart below.

Diversity and religiousness compared

What I would love, however, is for the plot to be interactive. It would be great to let people check out their own individual home states and see how they compare to the everyone else.

Credit for the piece goes to the FiveThirtyEight graphics department.
National Heights

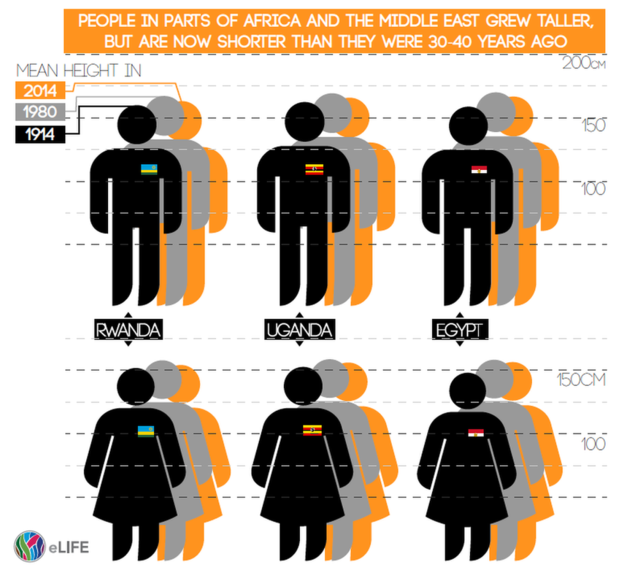
And by this title I am not referencing McKinleys, K2s, or Everests. No, the BBC published this piece on the changing average heights of citizens of various countries. This was the graphic they used from the report’s author.

National heights of people

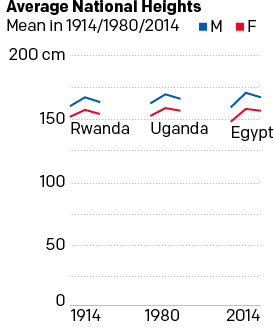
Personally speaking, I do not care for the graphic. It is unclear and puts undue emphasis on the 1914 figure by placing the illustration in the foreground as well as in the darkest colour. I took a thirty-minute stab at re-designing the graphic and have this to offer.

A comparison of the six heights

While I admit that it is far from the sexiest graphic, I think it does a better job of showing the growth than decline of national heights by each sex in each of these three select countries. Plus, we have the advantage of not needing to account for the flag emblems. Note how the black bars of Egypt disappear into the black illustration of the person.

Credit for the piece goes to the eLife graphics department.

Philadelphia’s Obesity Problem

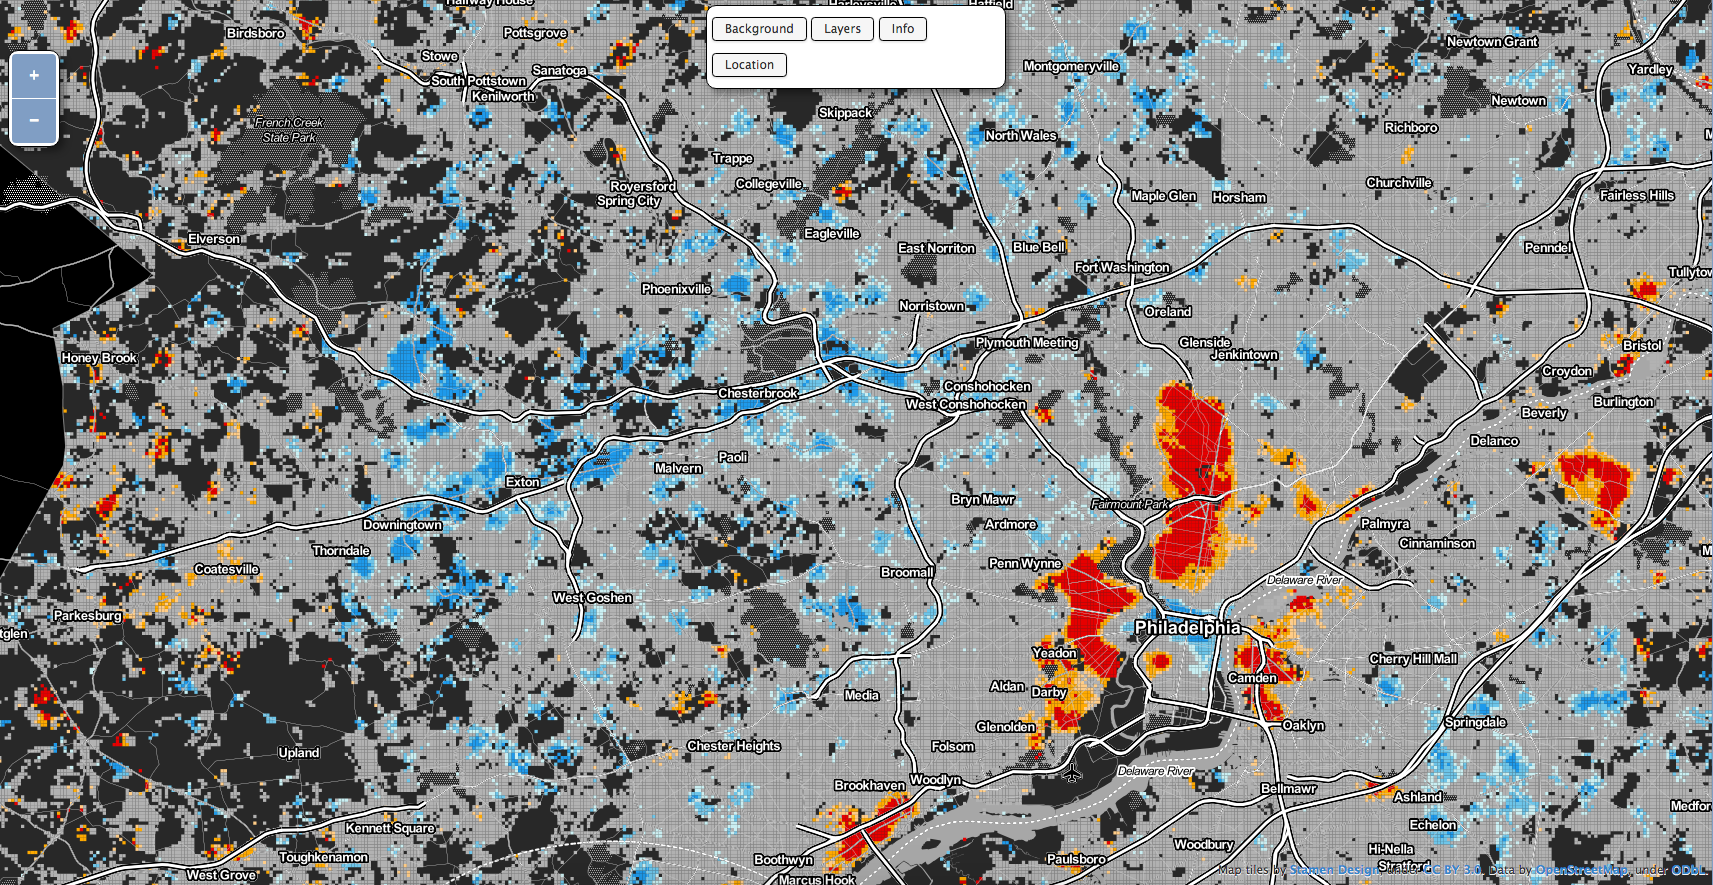
Last week Philadelphia became the first large US city to introduce a soda tax. (Berkeley introduced one a few years ago, but is 1/10 the size of Philly.) The Guardian has a really nice write-up on how the tax was sold not on health benefits, but of civic benefits to the education system. But the article made me wonder if somebody had published a map looking at obesity in Philadelphia. Turns out Philadelphia Magazine published an article with just such a map from another source, RTI International. (You can find the full interactive map here.)

The map has three views, one of which allows you to see areas of statistically significant clustering. North and West Philly had some bright red clusters, whereas the western suburbs, in particular along the Main Line have some very cold blues.

Philly and the Main Line


Credit for the piece goes to RTI International.

World Income

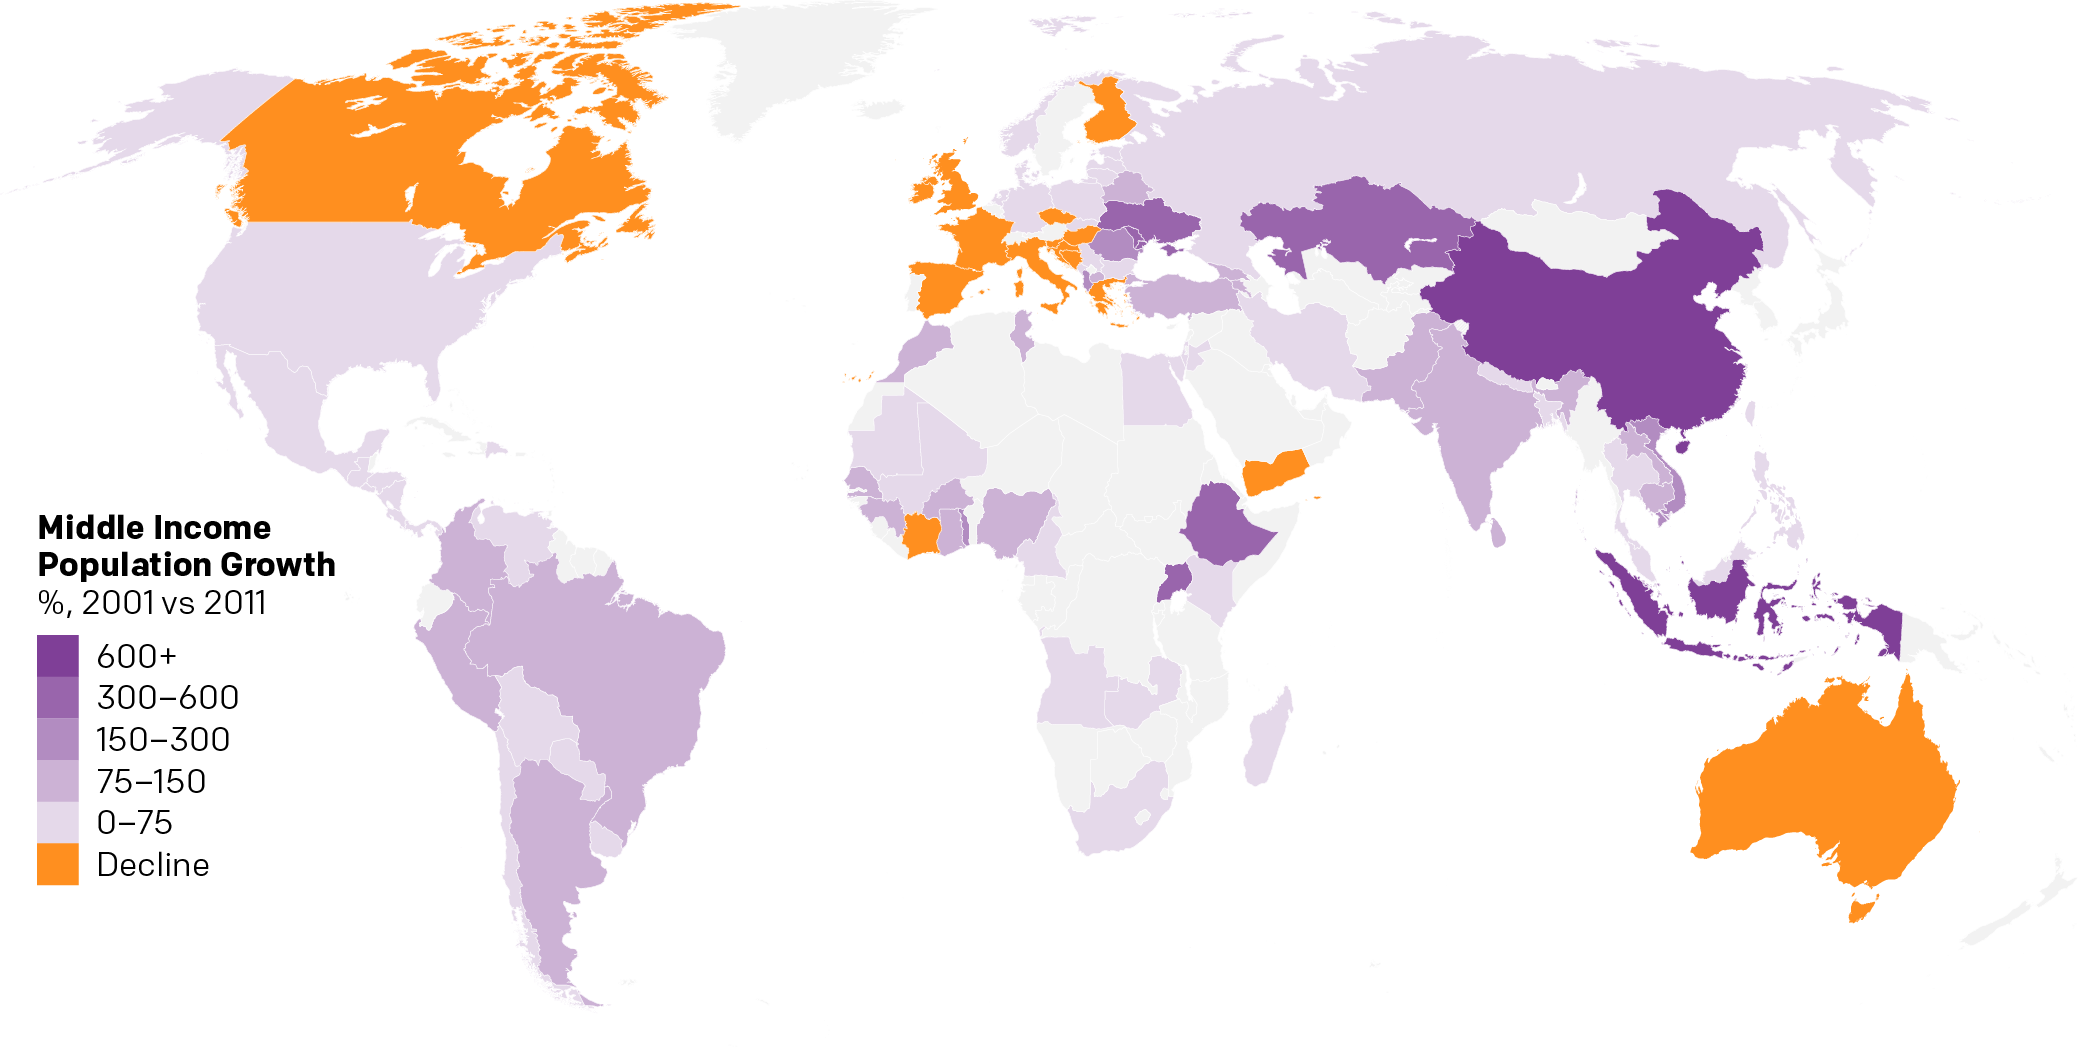
Over the weekend I found myself curious about the notion of a growing global middle class. So I dug up some data from the Pew Research Center and did some analysis. The linked piece here details that analysis.

The growth in middle income populations

I go into more detail than just a map. Hopefully you enjoy the piece and find the analysis informative if not useful.

Credit goes to myself on this one.

Where Is Pennsyltucky?

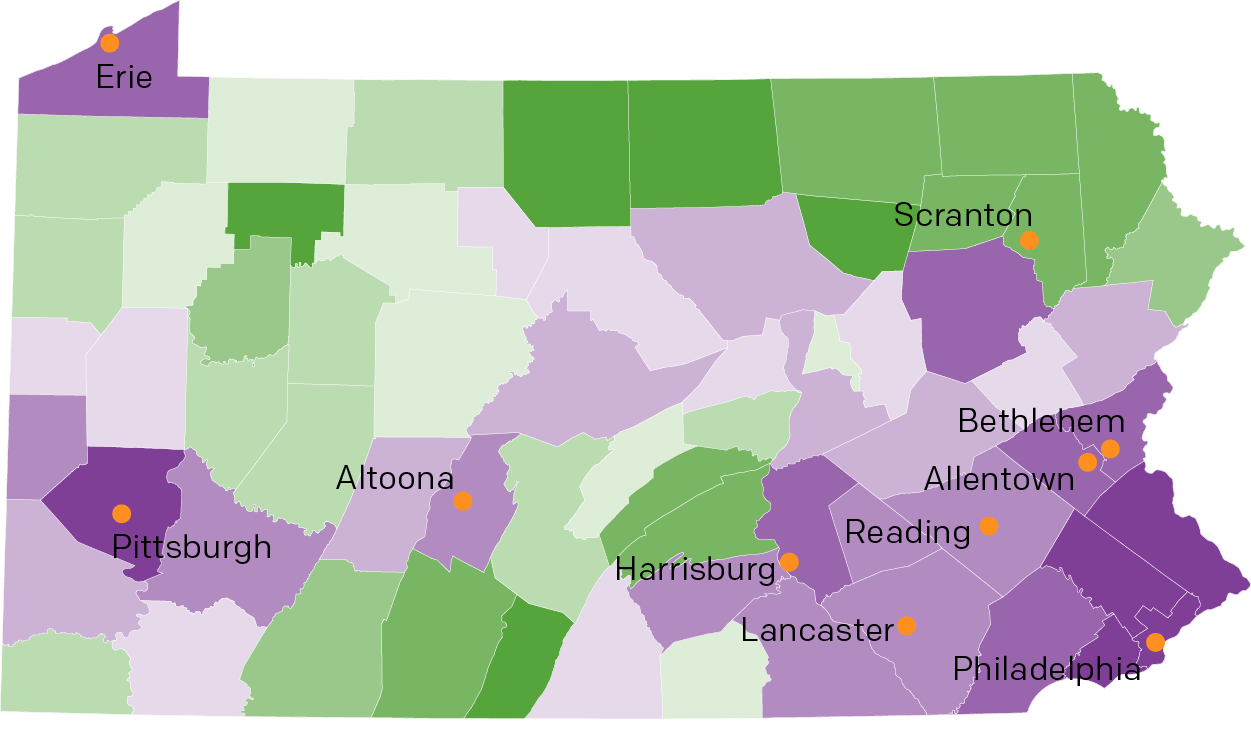
So last week I mentioned Pennsyltucky in my blog post about Pennsylvania’s forthcoming importance in the election. And then on Friday I shared a humourous illustrated map of Pennsylvania that led into an article on Pennsyltucky. But where exactly is it?

Luckily for you, I spent a good chunk of my weekend trying to find some data on Pennsylvania and taking a look at it. You can see and read the results over on a separate page of mine.

Where is Pennsyltucky?

Two Tales of One City

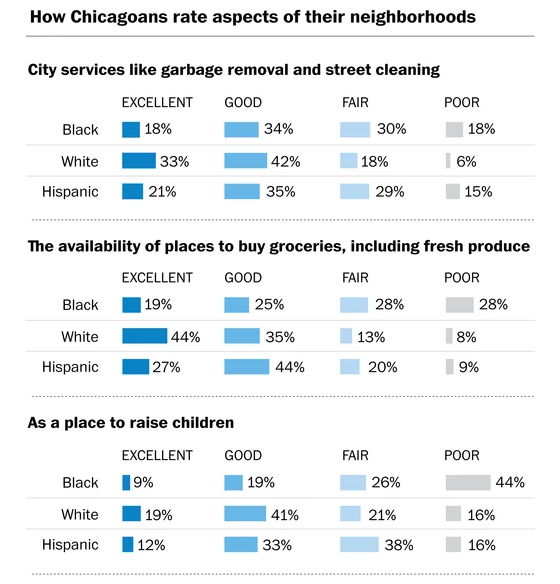
Dickens is not my favourite, but that felt an appropriate title for today’s piece from the Washington Post on Chicago residents’ opinions on, well, Chicago. Turns out there is a notable demographic split on how residents feel about various things in the city.

Some of the issues
Some of the issues

Credit for the piece goes to Emily Badger.

Where is Normal America?

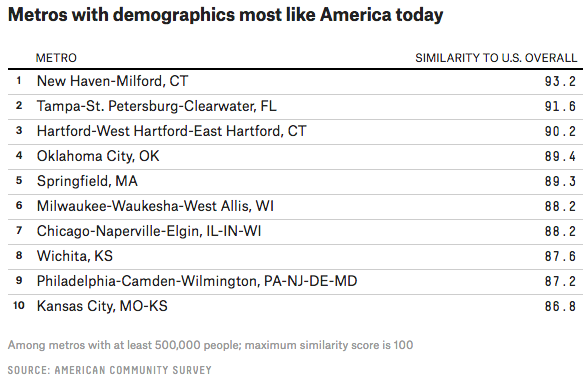
Not every graphic information graphic is a sexy chart or map. Sometimes tables communicate the story just as well. Maybe even better. Today’s post comes from FiveThirtyEight, which examined a claim about what places represent “Normal America”. Turns out that when one looks at the data, here age, race, ethnicity, and education, Normal America is found in the eastern half of the country. And it includes some big cities, notably both Philadelphia and Chicago. The whole article is worth a read, as it goes on exploring states representing Normal America and then places that represent 1950s America.

Where is Normal America?

So where is Normal America? New Haven, Connecticut.

Credit for the piece goes to Jed Kolko.

Mapping a New America

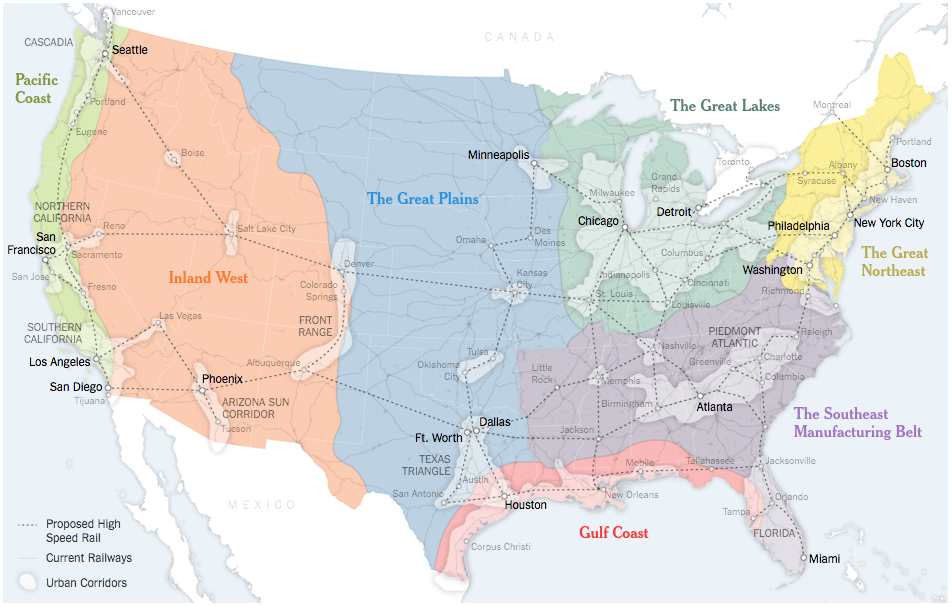
The United States of America consists of 50 states and hundreds of cities. In Sunday’s edition of the New York Times Parag Khanna argued for the switch of priority away from the state-level and to effectively the city-level. We have clusters of cities that dominate and drive the national economy.

The classic case-in-point is Bowash, the megapolis of interconnected cities from Boston to Washington, where there is a plan to extend Baltimore’s MARC public transit train to Wilmington, Delaware. If that were to happen, one could take public transit from the northern suburbs of New York City to Washington through Trenton, Philadelphia, Wilmington, and Baltimore. But today, those decisions must be taken as many as six different states. What if it were handled by a single, regional body?

The Great Northeast
The Great Northeast

The above map looks at what a New America could look like, as grouped into seven different regions and their urban clusters.

Credit for the piece goes to the New York Times graphics department.

The Middle Class is Getting Poorer

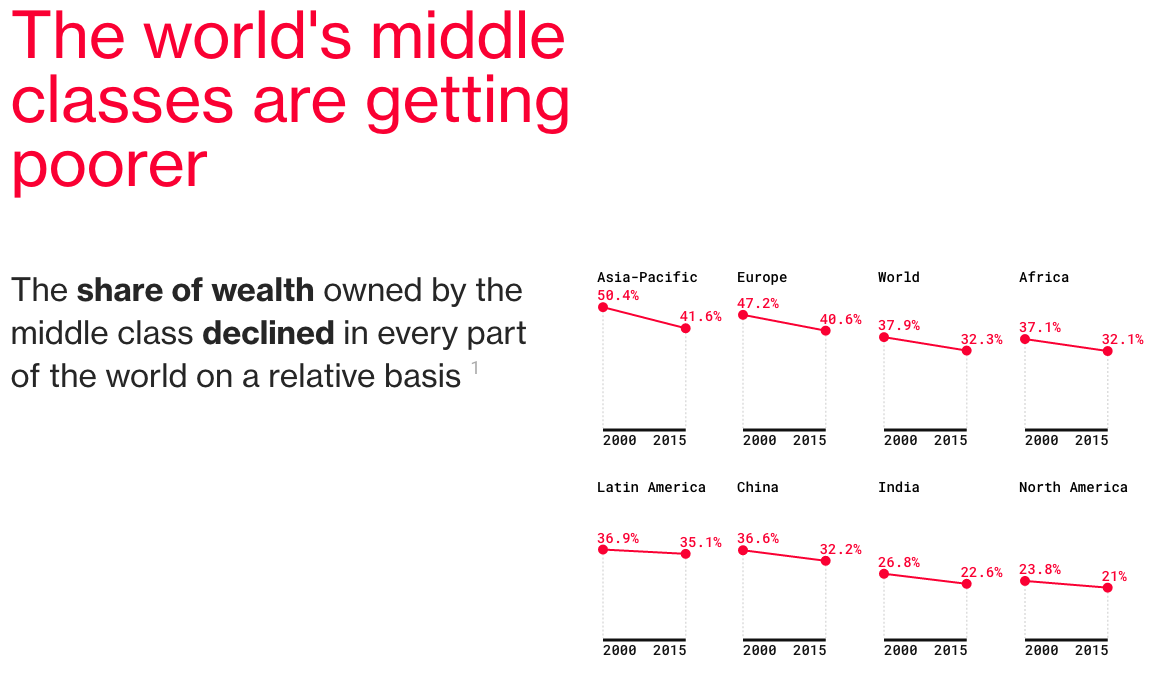
At least relatively speaking. Today’s post is a Bloomberg article comprised primarily of charts with pithy titles summarising the data story. If listicle is a word for articles consisting of the Top-10 things about [whatever], do we start embracing charticle as the word for chart-driven stories? Even if we do, we should take note that this piece was not the work of one person, but four.

The Middle Class' share of wealth
The Middle Class’ share of wealth

The story captures my attention to and dovetails nicely into yesterday’s piece about a possible electoral path for Donald Trump to take the White House later this autumn.

Bonus points for the responsive nature of the post.

Credit for the piece goes to Andre Tartar, Mira Rojanasakul, Jeremy Diamond, and John Fraher.