#MeToo After One Year

One year on and the #meToo movement continues to upend the political, economic, and cultural landscape of the United States. And a few days ago the New York Times published a piece on all the stories they have collected.

From a data visualisation standpoint, this is a fairly simple piece. It takes 201 men (and a few women) who allegedly committed crimes along with their photo (if available) and then shows who replaced them. The screenshot below is of the total number of faces—notably not all men have been replaced—and then divides those who replaced them by gender.
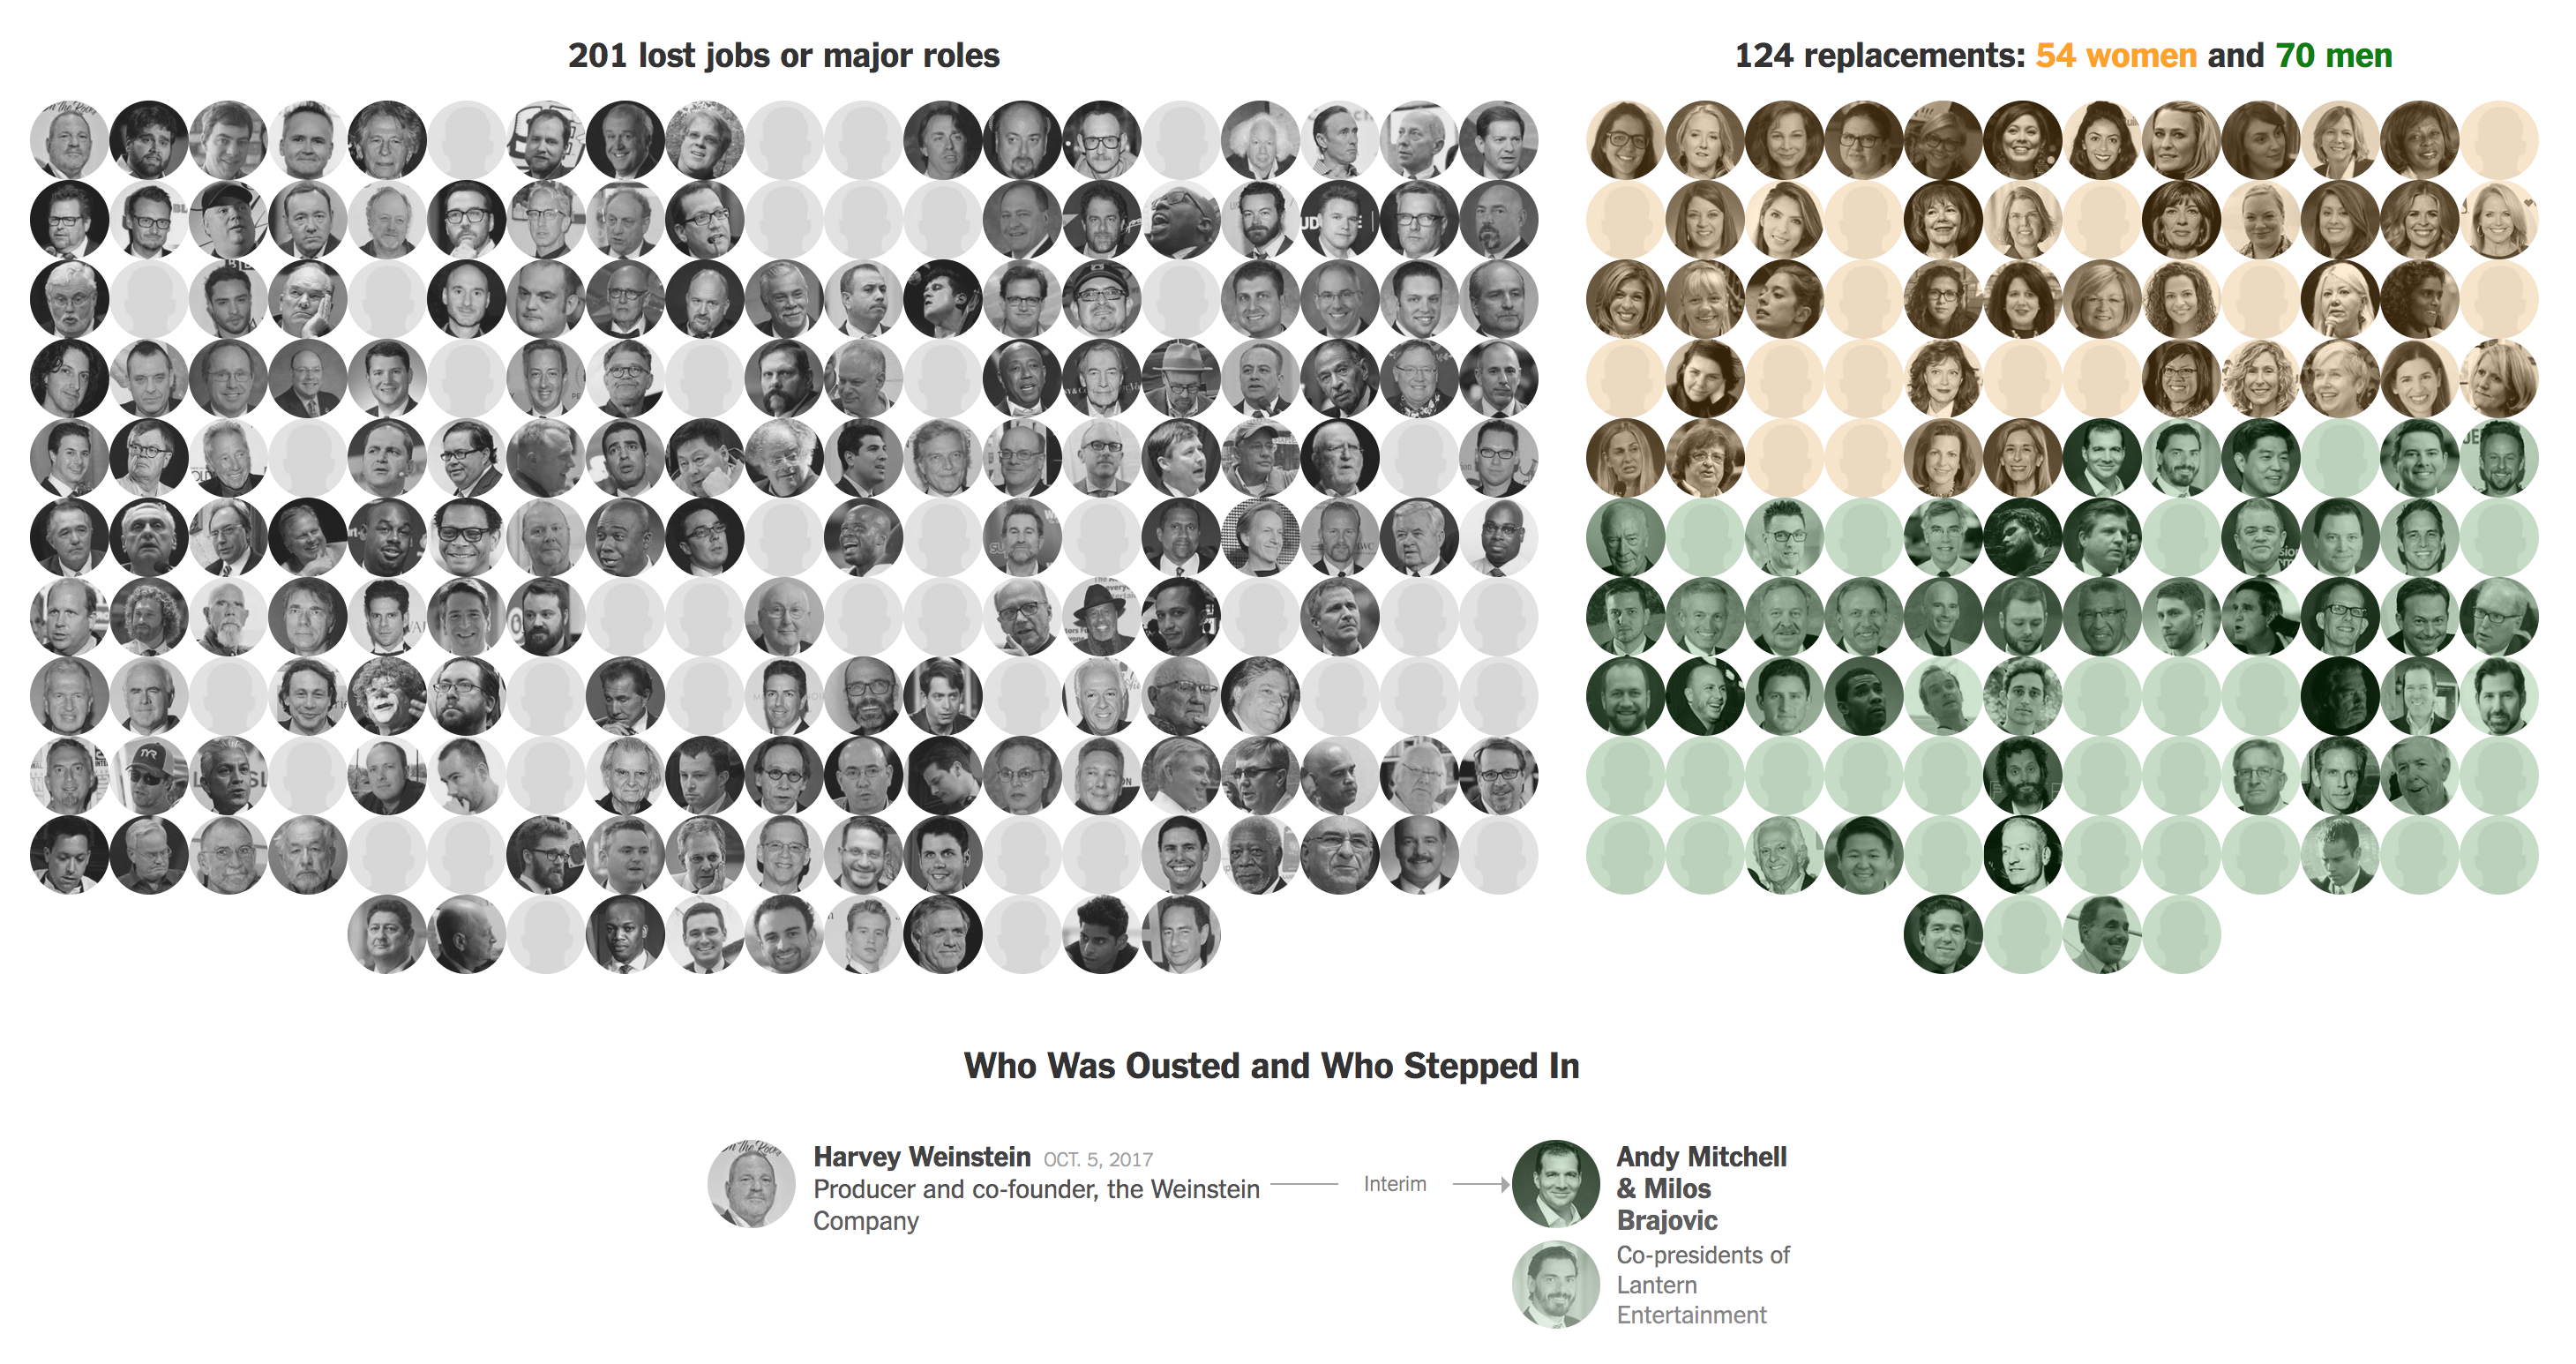
Naturally it starts with Weinstein at the top…

The bit at the bottom shows how the case studies work. A man is on the left and who replaced him is on the right, both in the interim and more permanently, if applicable. A brief text account of the story falls below the alleged offender. And with 200+ stories, you can scroll for days.

Credit for the piece goes to Audrey Carlsen, Maya Salam, Claire Cain Miller, Denise Lu, Ash Ngu, Jugal K. Patel, and Zach Wichter.

First Florence, Now Michael

You may recall a few weeks ago there was a hurricane named Florence that slammed into the Carolina before stalling and dumping voluminous amounts of rain that inundated inland communities in addition to the damage by the storm surge in the coastal communities. At the time I wrote about a New York Times piece that explored housing density in coastal areas, specifically around the Florence impact area.

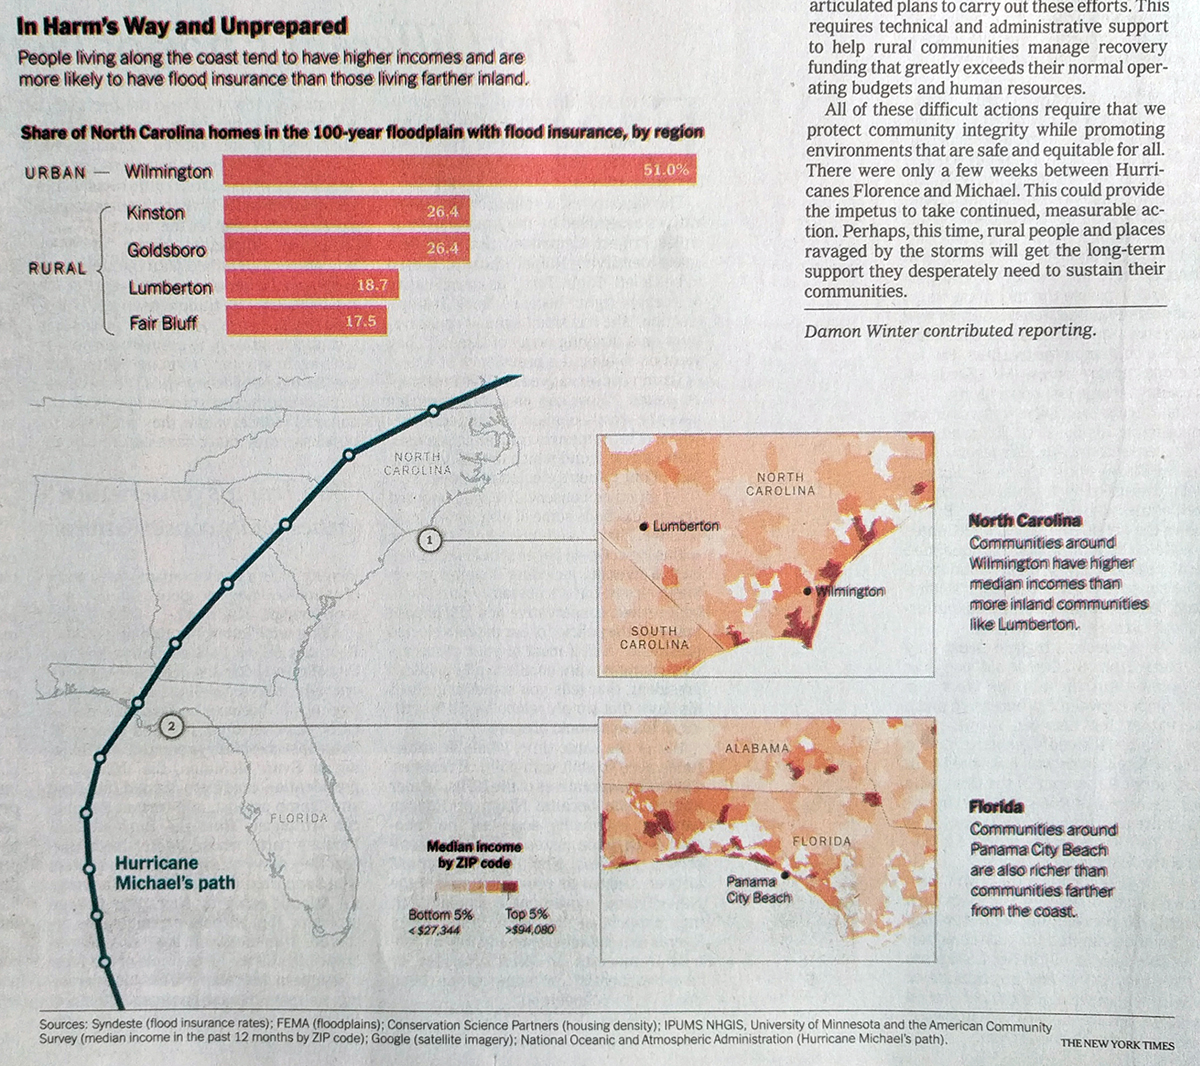
Well today the New York Times has a print graphic about something similar. It uses the same colours and styles, but swaps in a different data set and then uses a small multiple setup to include the Florida Panhandle. Of course the Florida Panhandle was just struck by Hurricane Michael, a Category 4 storm when it made landfall.

Of course that track for Michael also brought significant rainfall to the areas recovering from Florence for a double whammy

This one instead looks at median income per zip code to highlight the disparity between those living directly on the coast and those inland. In these two most recent landfall areas, the reader can clearly see that the zip codes along the coast have far greater incomes and, by proxy, wealth than those just a few zip codes further inland.

The problem is that rebuilding lives, communities, and infrastructure not only takes time, but also money. And with lower incomes, some of the hardest hit areas over the past several weeks could have a very difficult time recovering.

Regardless, the recoveries on the continental mainlands of the Carolinas and Florida will likely be far quicker and more comprehensive than they have been thus far for Puerto Rico.

The only downside with this graphic is the registration shift, which is why the graphic appears fuzzy as colours are ever so slightly offset whereas the single ink black text in the upper right looks clear and crisp.

Credit for the piece goes to the New York Times graphics department.

Our Lives Are a Mixed Bag

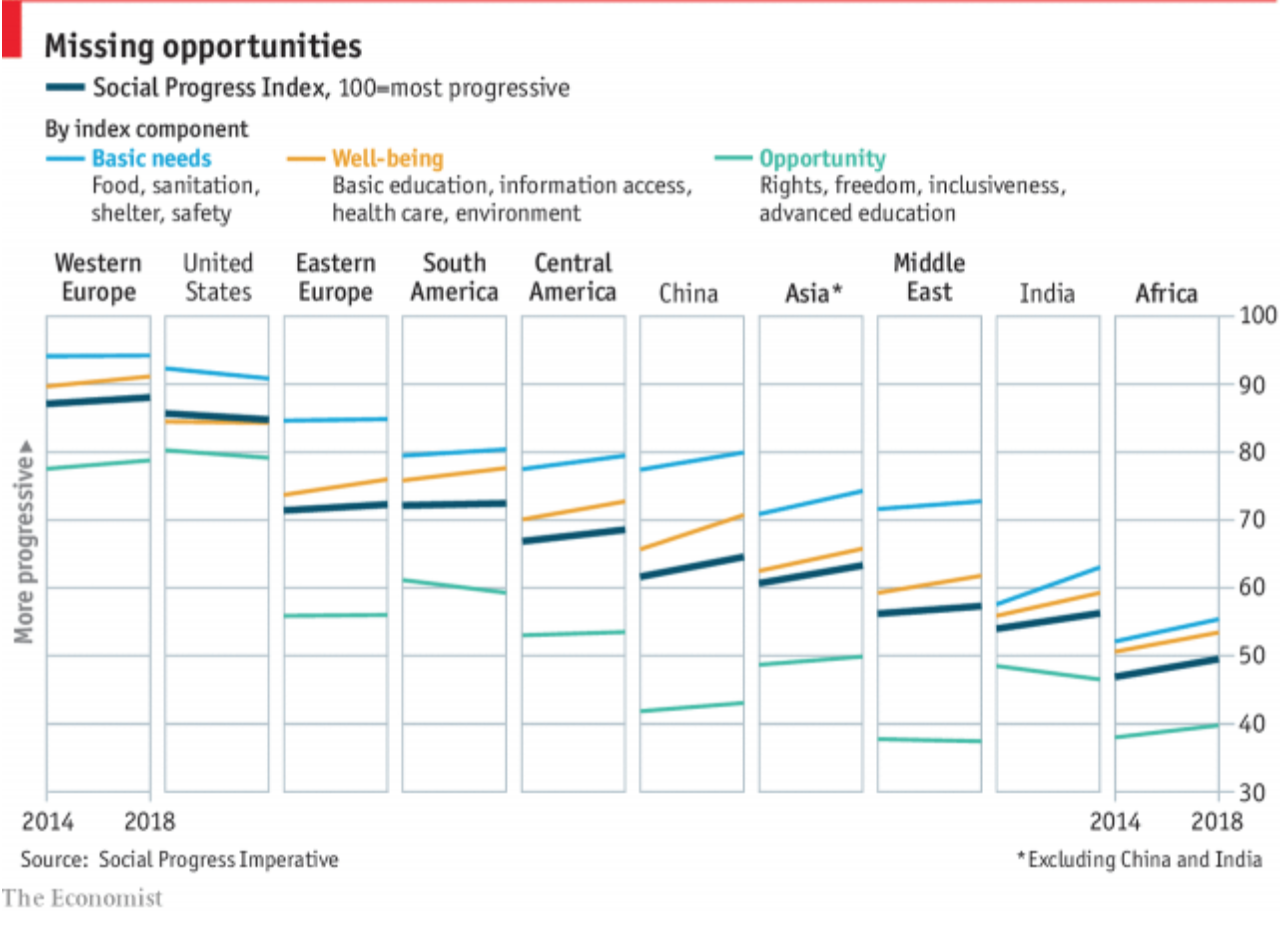
Last Thursday the Economist published an article looking at quality of life across the world. The data came from the Social Progress Imperative and examined quality of life, excluding economic performance. And as the article details, the results were mixed at best.

But, hey, the chart was really nice. We have a small multiple set looking at the overall index across all regions across the world and then the US, China, and India in particular.

Unfortunately the US is heading in the wrong direction…

I think this chart hits almost all the right notes. My only qualm would be the component indices being placed alongside the overall index. I wonder if breaking the whole thing out by component would work. As it is, it generally works well, I am just curious because there is the one issue of the United States where our well-being line falls beneath that of the overall index. But then again, the story is the overall index.

Credit for the piece goes to the Economist Data Team.

Europe’s Far-right Parties

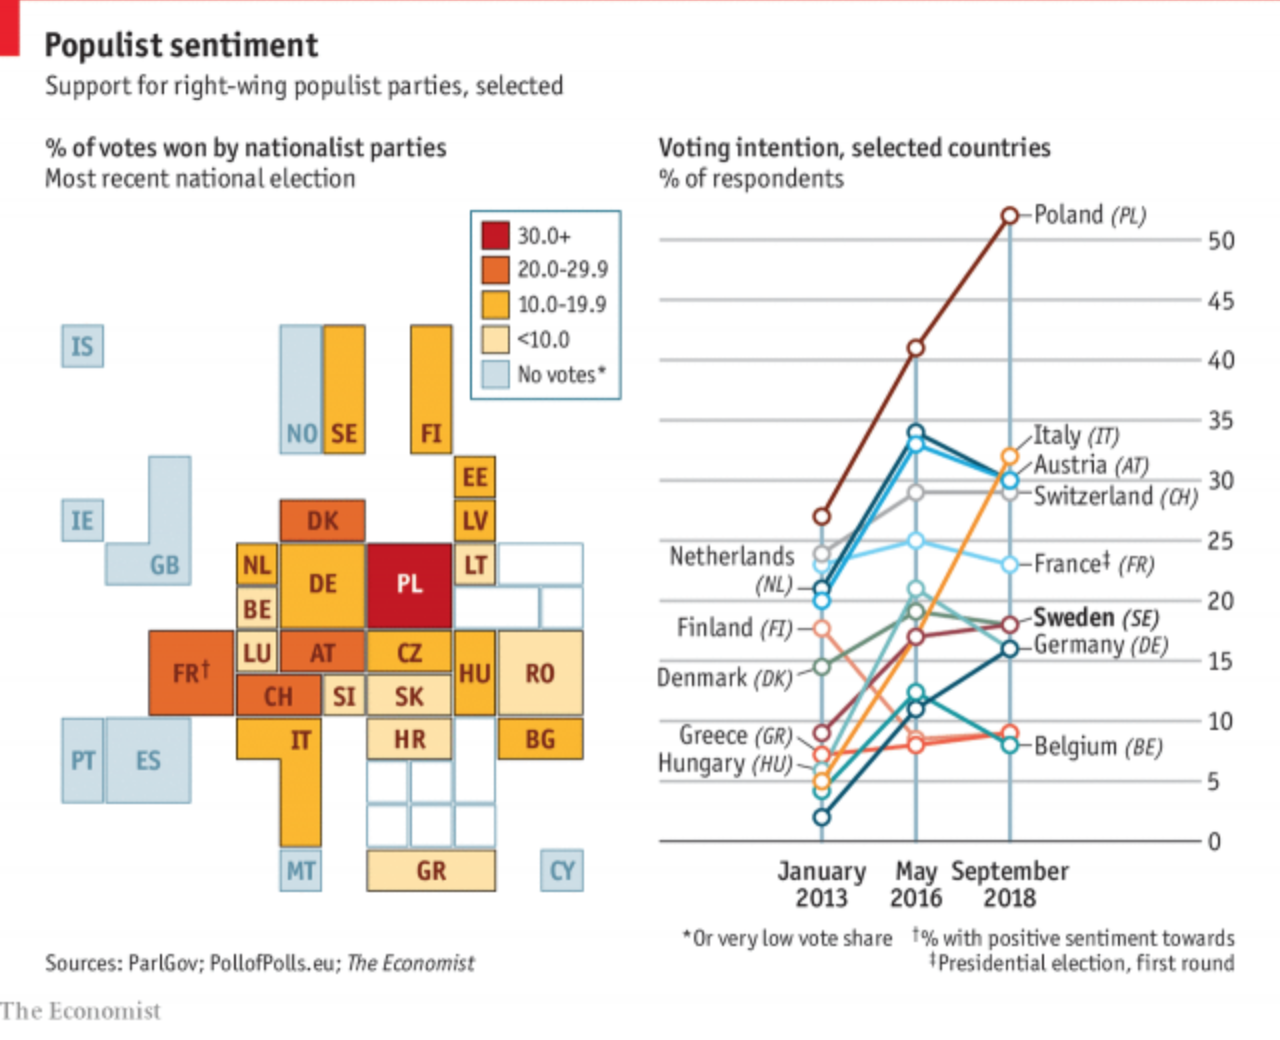
Yesterday we looked at the rise of the far-right in Sweden based on their electoral gains in this past weekend’s election. Today, the Economist has a piece detailing their strength throughout Europe and they claim that this type of nationalist party may have peaked.

The tile map, though

The graphic fascinates me because it appears to be a twist on the box or tile map, which is often used to eliminate or reduce the discrepancies in geographic size so that countries, states, or whatevers, can be examined more easily and more equitably.

I am guessing that the ultimate sizes, which appear to be one to four units, are determined by population size. The biggest hitters of Germany, the UK, France, and Spain are all four squares or boxes whereas the smaller states like Malta are just one. (But again, hey, we can all see Malta this time.)

I think this kind of abstraction will grow on me over time. It is a clever solution to the age-old problem of how do we show important data in both Germany and Malta on a map when Malta is so geographically small it probably renders as only a few pixels.

On the other hand, I am not loving the line chart to the right. I understand what it is doing and why. And even conceptually it works well to show the peaks of the parties. However, there are just a few too many lines and we get into the spaghettification of the chart. I might have labelled a far fewer number and let most sit at some neutral grey. Or, space permitting, a series of small multiples could have been used.

Credit for the piece goes to the Economist Data Team.

The Toll of the Trolls

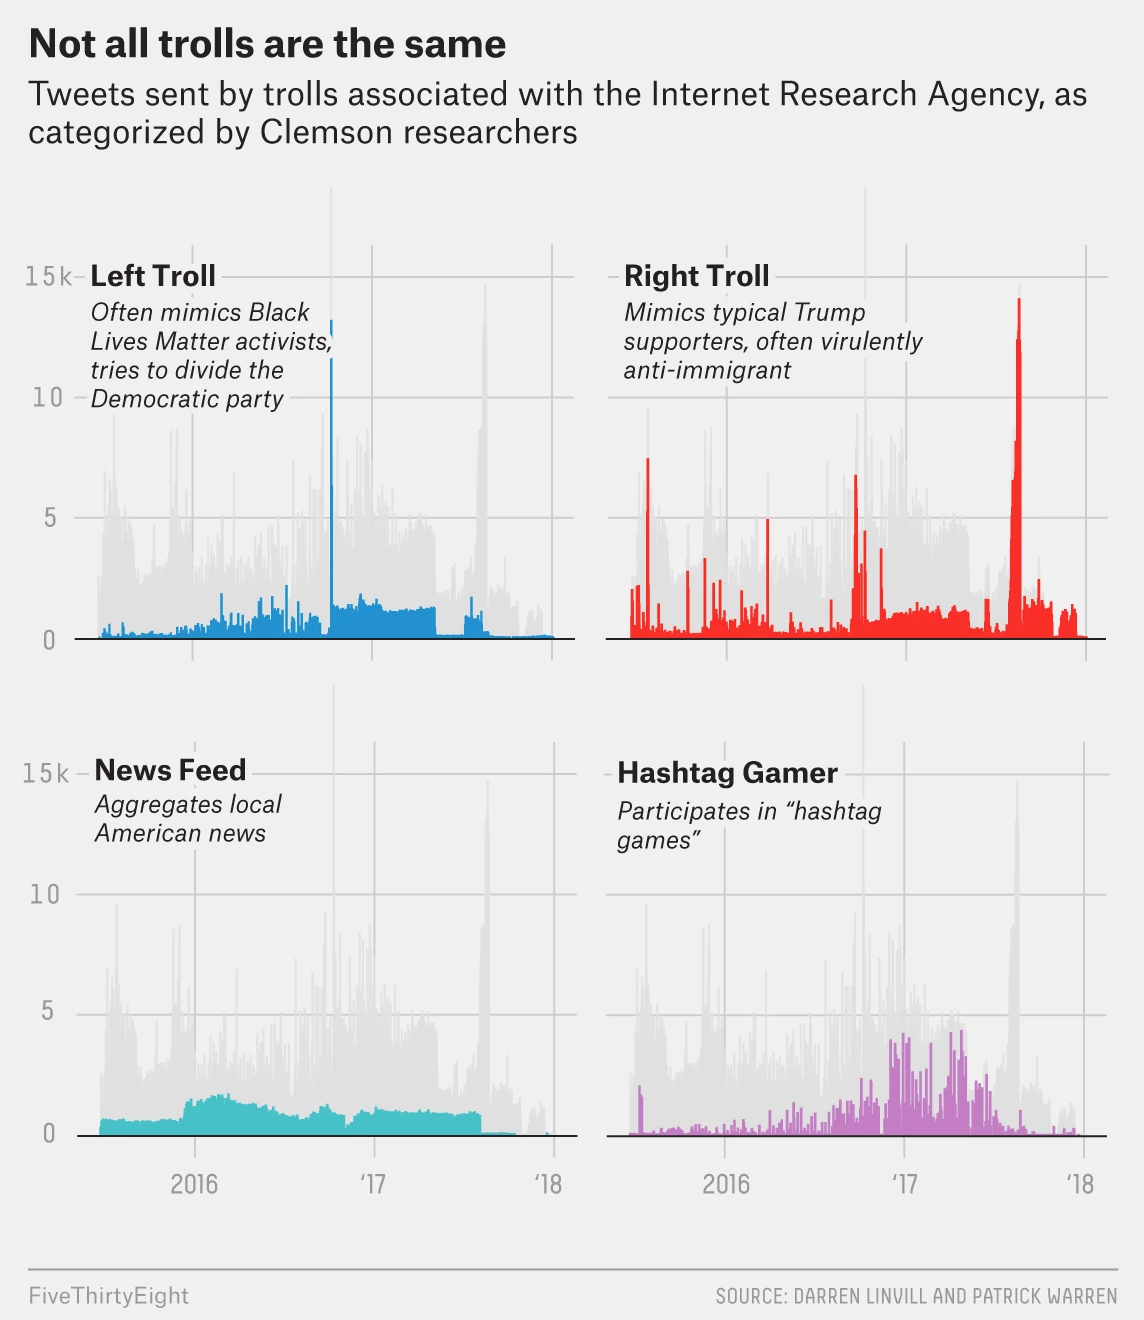
This is an older piece that I’ve been thinking of posting. It comes from FiveThirtyEight and explores some of the data about Russian trolling in the lead up to, and shortly after, the US presidential election in 2016.

They're all just ugly trolls. Nobody loves them.
They’re all just ugly trolls. Nobody loves them.

The graphic makes a really nice use of small multiples. The screenshot above focuses on four types of trolling and fits that into the greyed out larger narrative of the overall timeline. You can see that graphic elsewhere in the article in its total glory.

From a design standpoint this is just one of those solid pieces that does things really well. I might have swapped the axes lines for a dotted pattern instead of the solid grey, though I know that seems to be FiveThirtyEight’s house style. Here it conflicts with the grey timeline. But that is far from a dealbreaker here.

Credit for the piece goes to Oliver Roeder.

Ohio 12th Results

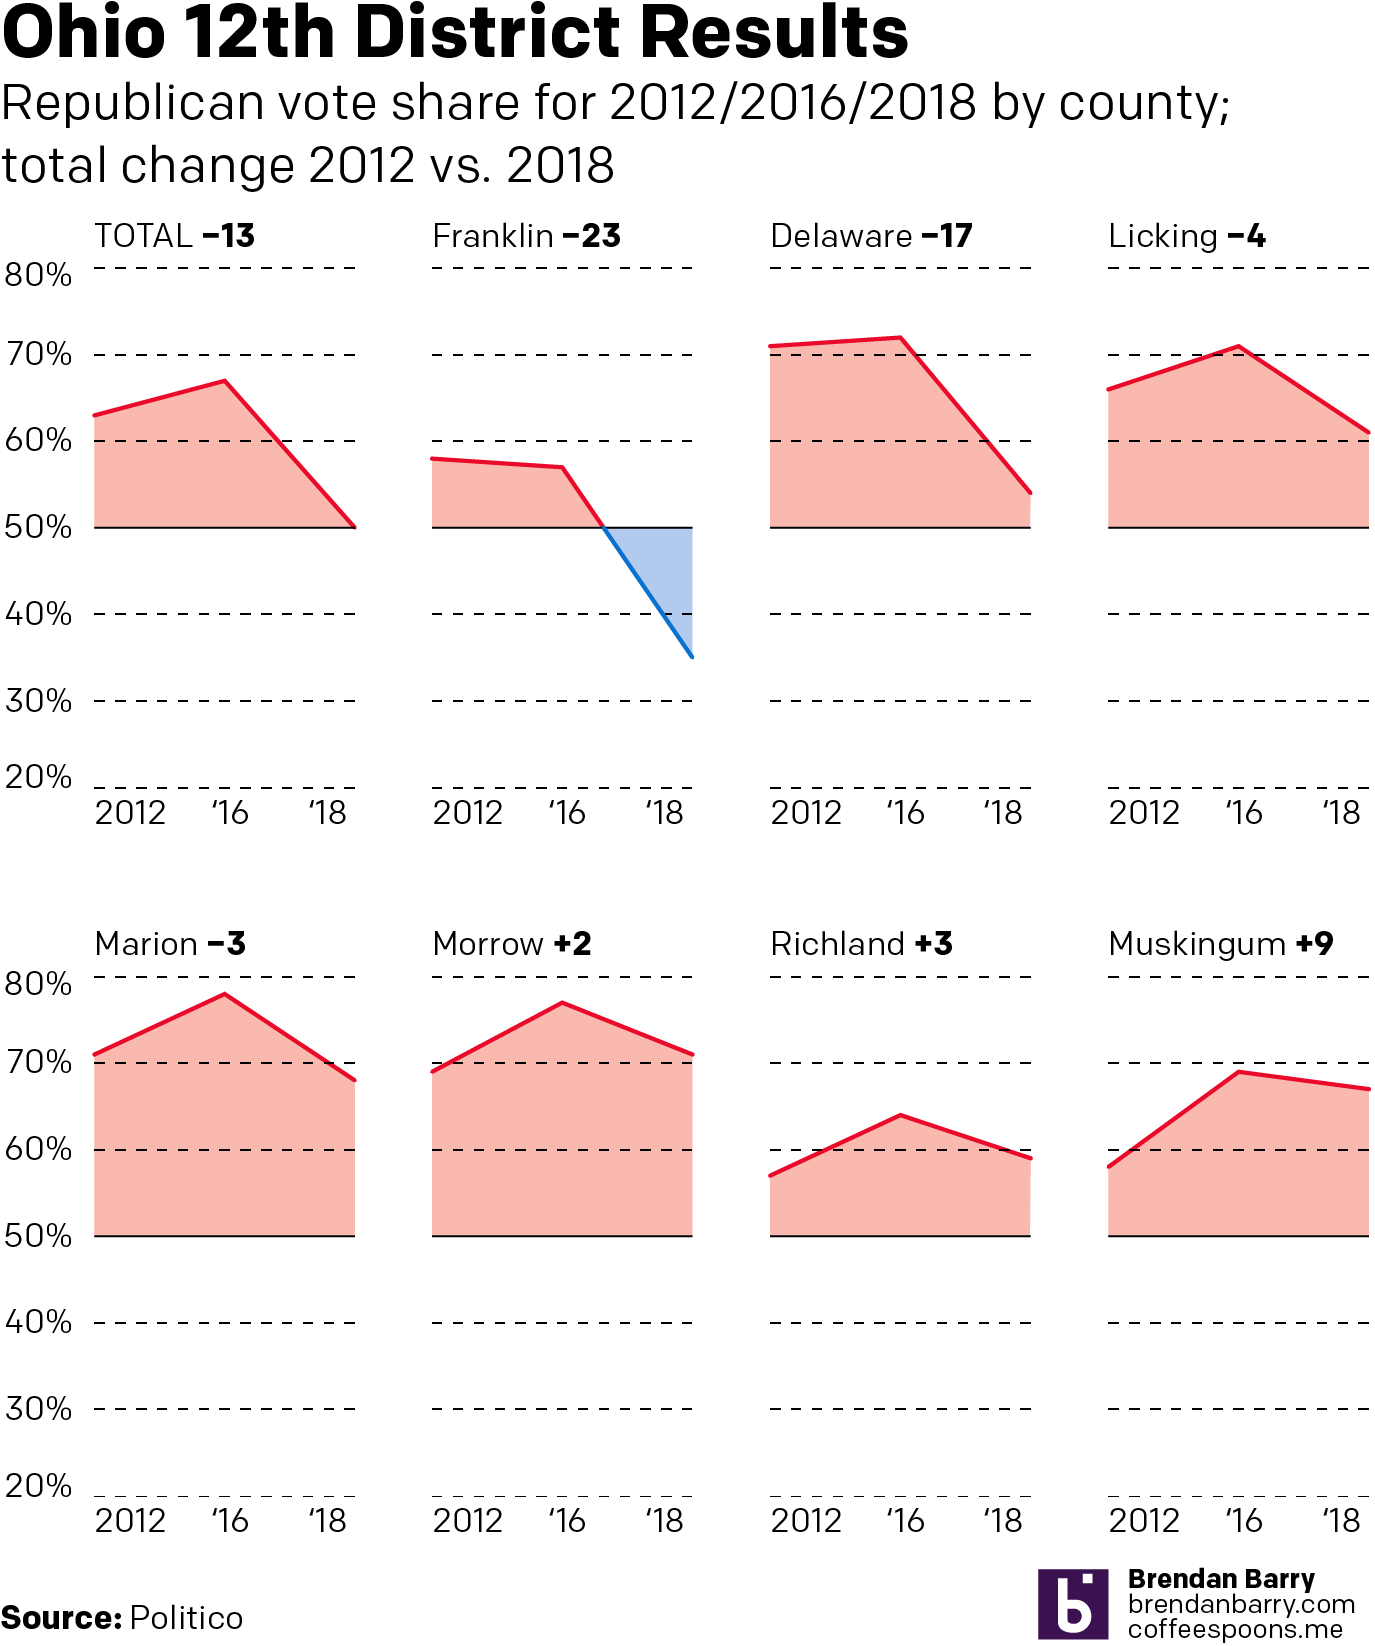
Last week parts of Ohio voted for a special election in the 12th Congressional District. Historically it has been a solidly Republican district by margins in the double digits. However, last week Republicans barely managed to hold the seat by, at the latest count I saw, less than one percentage point. Why? Well, it turns out that Republican support is bleeding away from one of the traditional strongholds: suburban counties.

I saw this data set late last week on Politico and I knew instinctively that it needed to be presented in another form than a table. Consequently I sketched out how it could work as small multiples of area charts to highlight just how Republican the district is. This is the digitisation of that take. Unfortunately my original sketch also featured a map of the district to show how this falls to the north and east of the city of Columbus. But I did not have time for that. Instead, I sketched up something else, but I need time to work on that. So for now, this concept will have to suffice.

That flip to the Democrats in Franklin County could be  a problem come November
That flip to the Democrats in Franklin County could be a problem come November

Credit for the piece is mine.

My New Toast

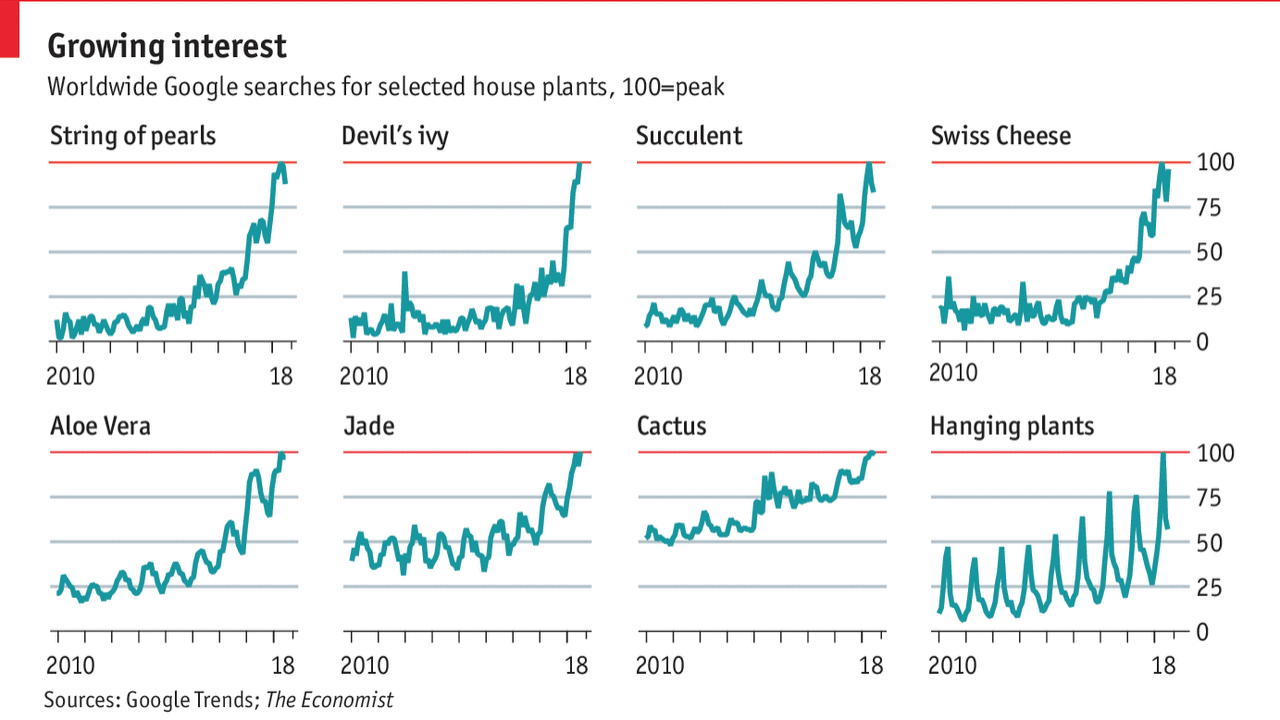
I am a millennial. That broadly means I am destroying and/or ruining everything. It also means I am obsessed with things like avocado toast. It also means I am not buying a house. Thankfully the Economist is on top of my next fad: indoor houseplants.

Plant things
Plant things

Your author will admit to having a few: a hanging plant, an Easter lily, an aloe plant and its children, and a dwarf conifer. Just don’t ask me how they’re doing. (Hint: not well.) Turns out I am not a plant person.

In terms of the graphic, though, what we have is a straight up set of small multiples of line charts. The seasonality mentioned in the article text appears quite clearly in a number of plants.

But is Swiss Cheese really a plant?

Credit for the piece goes to the Economist Data Team.

Fundraising for the Midterms

We are now less than 100 days away—95 to be exact—from the 2018 midterm elections here in the United States. As we get closer and closer we not only get more information from polls, but also campaign finance reports. Those can sometimes serve as a proxy for support as lots of grassroots support can dump lots of cash in a candidate’s war chest. Wheras a candidate who drums up little support might find him or herself with scant funds to fight the campaign.

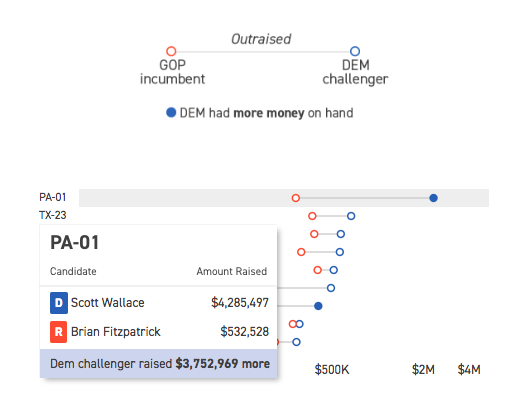
So what does that funding tell us right now? Well last week Politico posted an article looking at that data. They broke the dataset into chunks by the likelihood of the results. This screenshot is of Pennsylvania’s 1st Congressional District.

What's going on north of Philly
What’s going on north of Philly

Each district is represented by a dot plot, with the total money raised by each candidate plotted, the distance in grey being the amount by which the Democrat outraised the Republican.

This is a nice piece as the hover state provides a nice grey bar behind the district to focus the user’s attention. Then for the secondary level of information in terms of cash on hand for the Democrats, i.e. who has cash now, we get the dot filled in versus the open state for simply money raised. Then of course the hover state reveals the actual numbers for the two candidates along with the difference between the two.

The funny thing with this particular district, the Pennsylvania 1st, is that Wallace is not necessarily raising a lot of money. He is a self-funding millionaire. He also is not the most electable Democrat in a competitive seat. It will be fascinating to watch how this particular district performs over the next few months, but most importantly in November.

Credit for the piece goes to Sarah Frostenson.

Global Warming and Harder Living

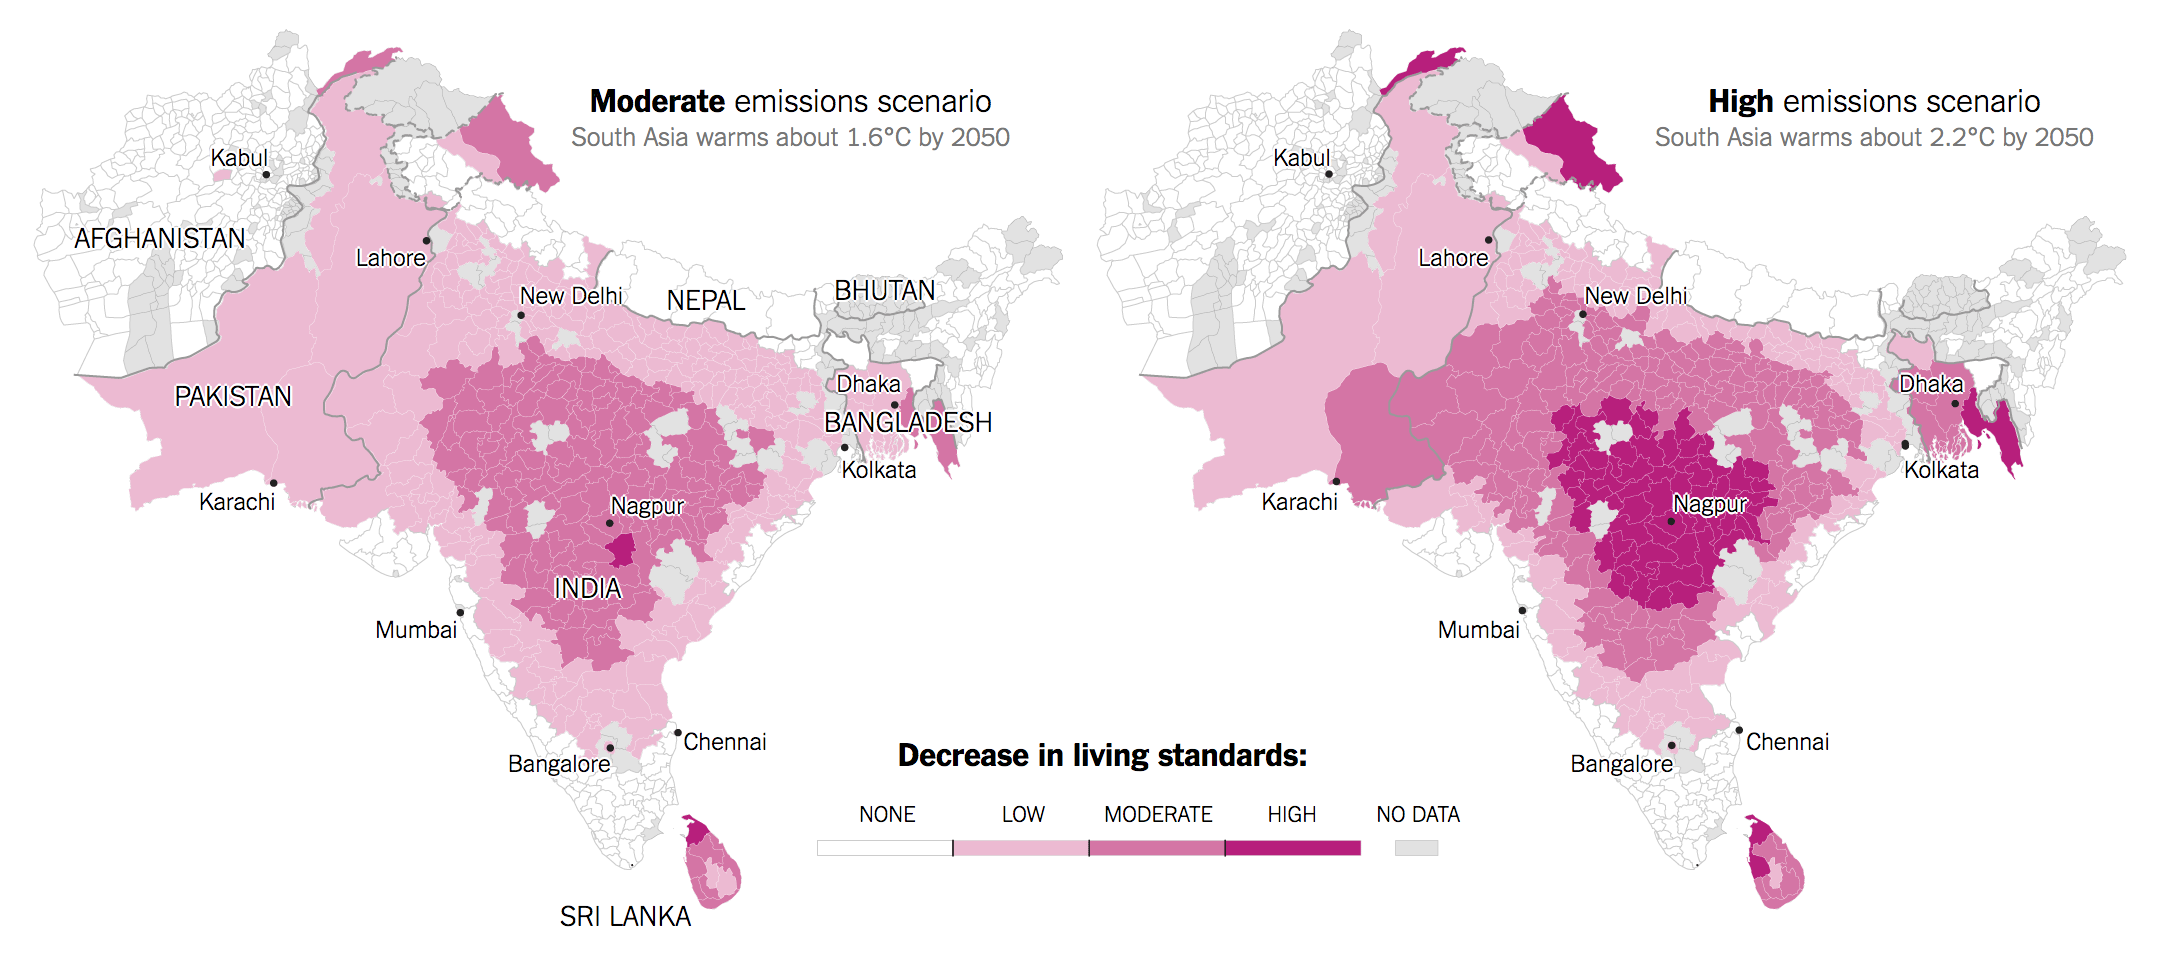
The weather in Philly the past week has been just gross. It reminds of Florida in that it has been hot, steamy, storms and downpours pop up out of nowhere then disappear, and just, generally, gross. I do not understand how people live in Florida year round. Anyway, that got me thinking about this piece from a month ago in the New York Times. It looked at the impact of climate change and living conditions in South Asia. Why is South Asia important? Well, it is home to nearly a billion people, a large number of whom are poor and demanding resources, and oh yeah, has a few countries that have fought several wars against each other and are armed with nuclear weapons. South Asia is important.

I ain't moving to Nagpur, India. That's for sure.
I ain’t moving to Nagpur, India. That’s for sure.

The map from the piece—it also features a nice set of small multiples of rising temperatures in six countries—shows starkly how moderate emissions and the high projection of emissions will impact the region. Spoiler: not well. It notes how cities like Karachi, for example, will be impacted as hotter temperatures mean lower labour productivity means worse public health means lower standard of living. And it doesn’t take a rocket scientist to see how things like demand for water in desert or arid areas could spark a conflict between Pakistan and India. Although, to be very clear, the article does not go there.

As to the design of the graphic, I wonder about the use of white for no impact and grey for no data. Should they have been reversed? As it is, the use of white for no impact makes the regions of impact, most notably central India, stand out all the more clearly. But it then also highlights the regions of no data.

Credit for the piece goes to Somini Sengupta and Nadja Popovich.

State Level Action on Gun Control

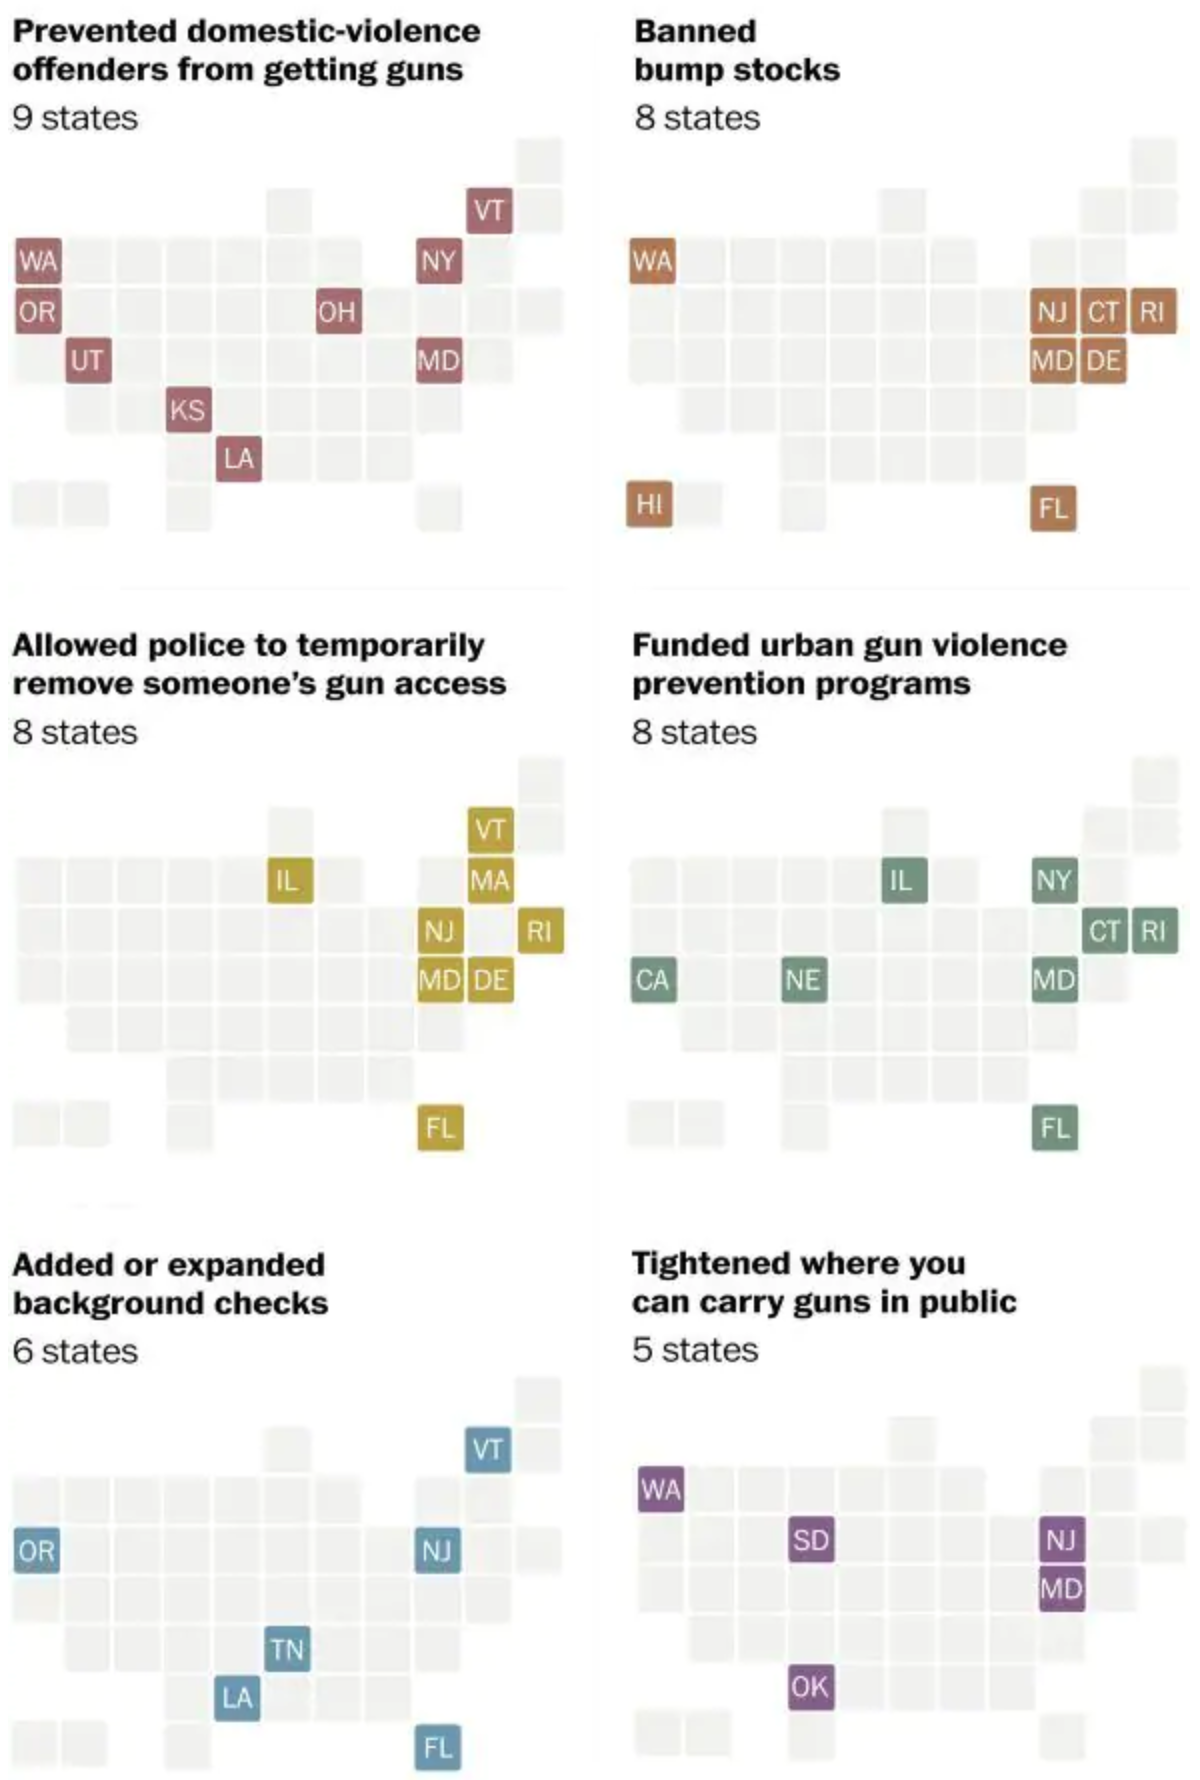
A few months ago I covered an editorial piece from the New York Times that looked at all the action, by which I mean inaction, the federal government had taken on gun violence in the wake of some horrific shootings. Well on Saturday the Washington Post published an article looking at how there has been action on the state level.

Where is Pennsylvania?

It used a series of small multiple maps of the United States with states represented as tiles or boxes. States are coloured by whether they took action in one of six different categories. It is a pretty simple and straightforward design that works well.

The only thing I am unsure about is whether the colours are necessary. A single colour could be used effectively given that each map has a clear title directly above it. Now, if the dataset were to be used in another chart or graphic alongside the maps where the types of action were combined, then colours could be justified. For example, if there was a way to see what actions a state had taken, i.e. pivot the data display, the different colours could show what from the set the state had done.

And in Pennsylvania’s case, sadly, that is nothing.

Credit for the piece goes to Amber Phillips.