Trump Conservatism

Another Tuesday, more primary and caucus victories for Donald Trump in his quest to become the Republican nominee. However one of the refrains you hear from the right is that he is not a true conservative. How true is that? Well the BBC put together an article comparing Trump to the other candidates and some previous Republican presidents on various issues like foreign policy.
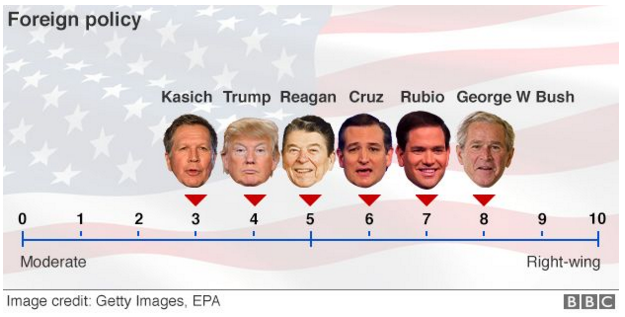
Republicans on foreign policy

Okay, so it sort of works with cutout photos of people pasted onto an American flag background. But I cannot quite take the piece seriously because of its amateurish design. Maybe the American flag makes sense as a background graphic? But the heads? Surely not.

So what happens if we take a more serious approach—though I admit originally the idea of a Trump candidacy seemed farcical—to this graphic? Well I took a quick stab this morning.
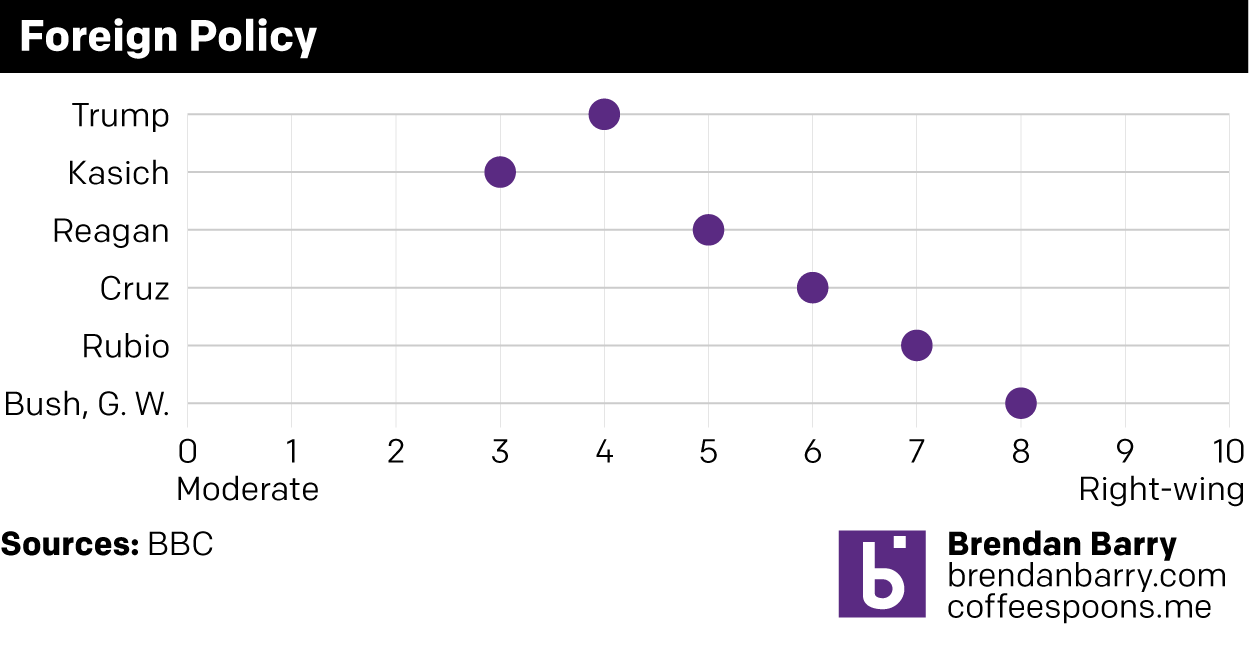
My take
My take

Credit for the original goes to the BBC graphics department.

Predicting the UK General Election Results

(To be fair, I forgot to schedule to publish this post before I left somehow.)

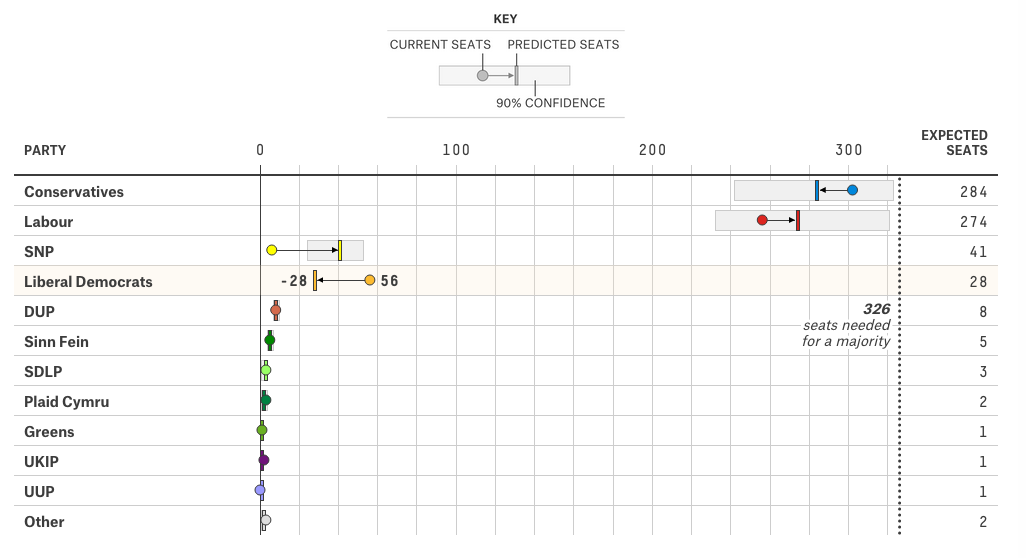
Your humble author is still on holiday. So, today, you can enjoy a nice interactive piece from FiveThirtyEight that predicts the results of the 7 May general election. Of particular interest, the box part of the plot that shows the 90% confidence range.

Dot plotting the results

The piece also has a choropleth map. My only feature request(s) would be to have a zoom feature for urban constituencies and/or to have a search field that allows the user to see the predicted results for a specific constituency.

Credit for the piece goes to Matthew Conlen and Ritchie King.

Boston’s Snowy 2015

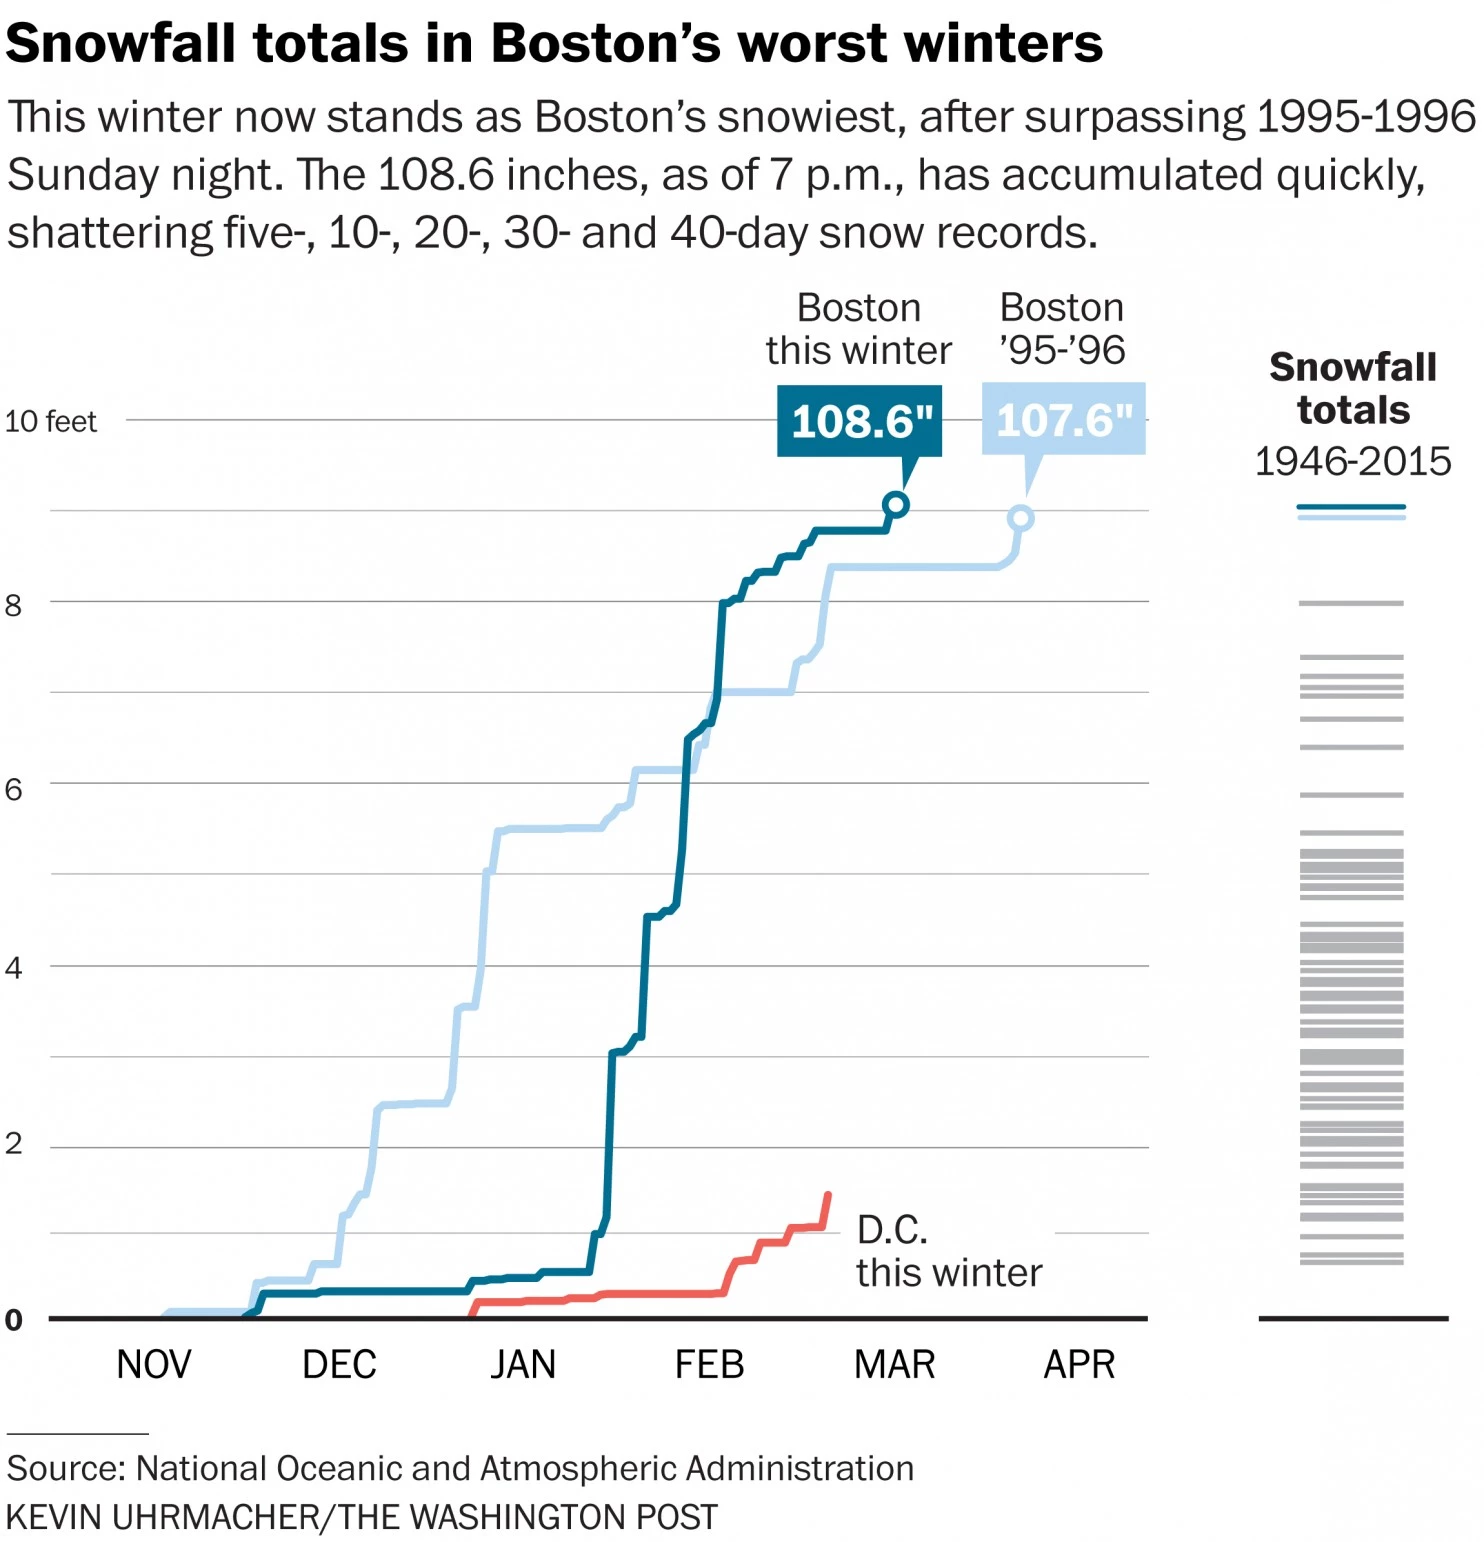
Boston has finally had it. And by it I mean the snowfall that broke the record. And by record I mean the record for the most snowfall in a year. Well, at least since they started recording it in 1872. The Washington Post has a nice chart placing the season not just in context, but also showing how quickly the snow fell. Most of the snow has fallen only from 25 January onward. And winter is not yet over.

DC is puny compared to  Boston

Credit for the piece goes to Kevin Uhrmacher.

American Football Videogames

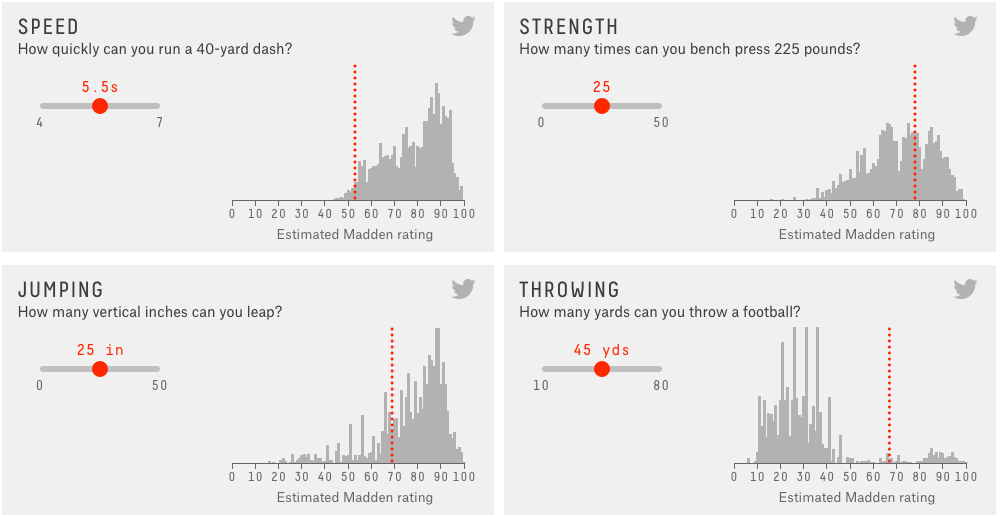
This week we have been looking at baseball (and Leonard Nimoy’s Star Trek). Today, we are going to turn to a sport I know nothing about: American football video games. Okay, so video games are not really a sport, but they are based on a sport. The reason I bring it up? FiveThirtyEIght has a really nice two-article story on how the Madden game franchise uses ratings to build characters for the game.

Rate yourself
Rate yourself

The above graphic is an interactive part of the story that lets you compare yourself to the real sports people, as estimated by the video game company. The second article in the story then builds upon that by using a reporter as a basis to test/understand the ratings.

And pay attention to the sidebar content. It’s actually worth heeding for once.

Credit for the piece goes to Reuben Fischer-Baum.

Baseball Is (Almost) Back

As the title says, baseball is almost back. Red Sox spring training games begin as the Red Sox take on Northeastern today. The off-season is perhaps the hardest part of the year for a fan, because unless you take super interest in trades, there is no baseball. But what about on Twitter? Well, today’s piece is an article from Fangraphs that looks at team-by-team off-season Twitter use.

Twitter engagement
Twitter engagement

Personally, I am not really a fan of the graphic. As a static image, it does not allow me to easily compare the different retweets or favourites. But, in the aggregate, you can see that the Seattle Mariners are perhaps the most active Twitter account.

Credit for the piece goes to Sean Dolinar.

Presidents Day Popularity Contests

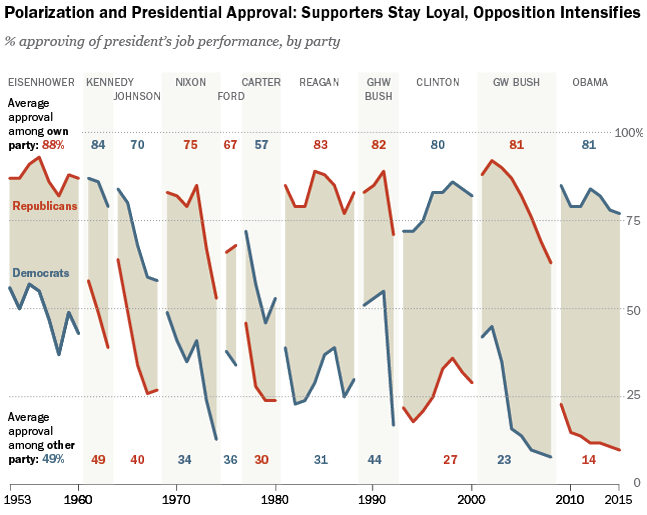
Yesterday was Presidents Day and I had the day off. So today’s post is a bit late, but it still works. Pew Research Centre pulled together data they had on presidential popularity from Eisenhower to Obama. The data point was job approval.

There has been a widening polarity gap

Credit for the piece goes to the graphics department of the Pew Research Centre.

Trains, Planes, and Automobiles: A Comparison (Kind of)

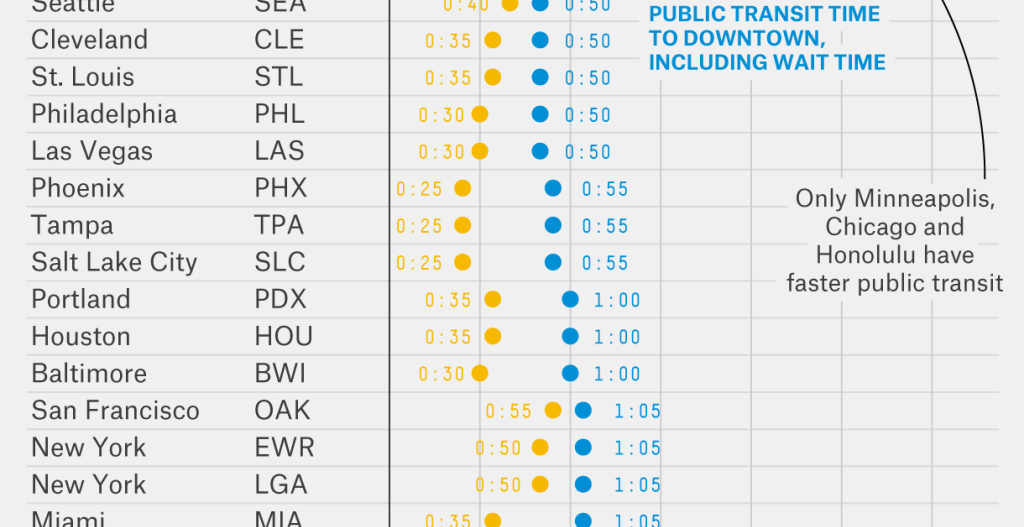
Travelling by plane can often be a hassle because getting from the airport to the destination is not always easy. Suffice it to say your humble author has—on a few occasions—been almost stranded at Philadelphia International because of no way to get where I was going. A lot of that comes down to poor public transit options. In my cases, it mostly stemmed from terrible weather delaying my flight until the wee hours of the morning after which train service stops.

Thankfully, Five Thirty Eight took a look at the public transit vs. car options for various cities/airports and seeing which option is faster. Ultimately Philly is awarded an honourable mention because the R1 (what some people now call the Airport Line) is convenient if your timing is right. Mine, obviously, has never been.

Travel times to downtowns

Credit for the piece goes to Allison McCann.

Board Games

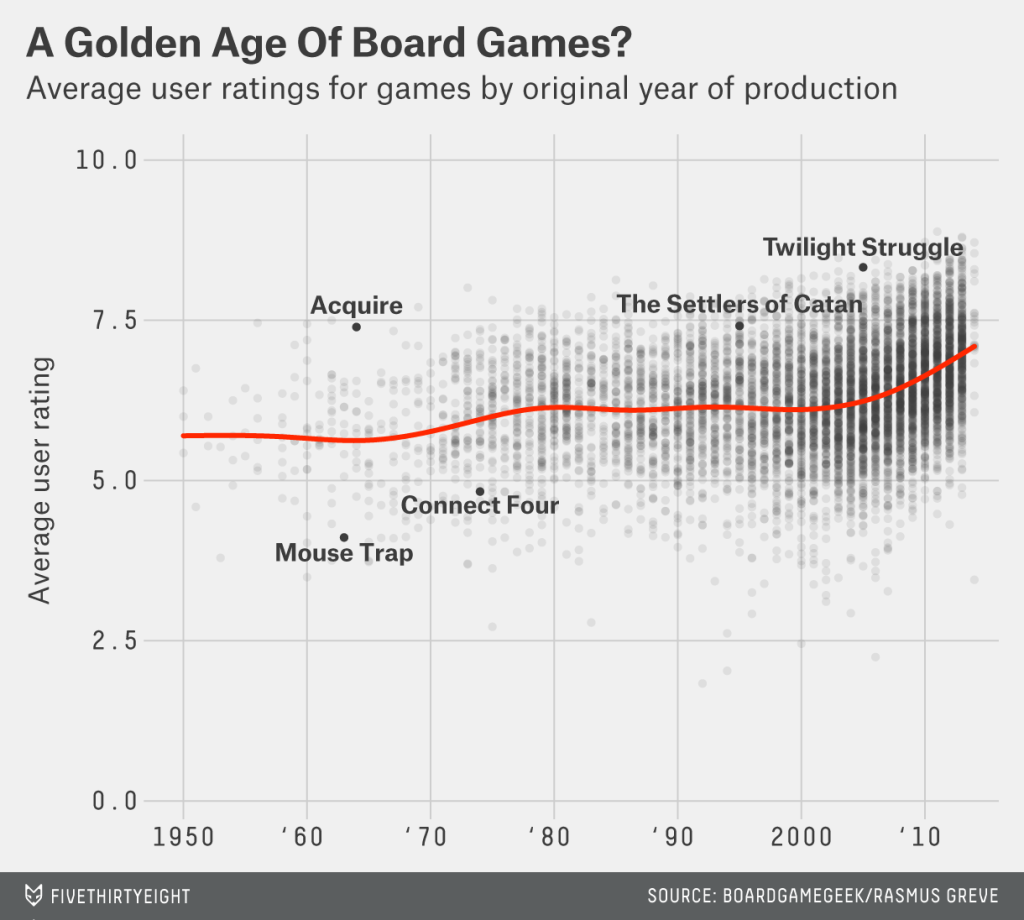
On New Year’s Eve, well technically in the wee hours of New Year’s Day, the group with which I was spending the holiday broke out Settlers of Catan. We played that game—and drank a few bottles of champagne—until 04.00. My experience of playing the game—not necessarily the part about being inebriated on New Year’s Eve—bears out the increasing popularity of board games. This article from FiveThirtyEight seeks to understand what makes particular board games popular. And, because I am mentioning it on this blog, it has a few charts worth noting.

Game ratings organised by year of introduction

Credit for the piece goes to Rasmus Greve.

The City Liveability Index

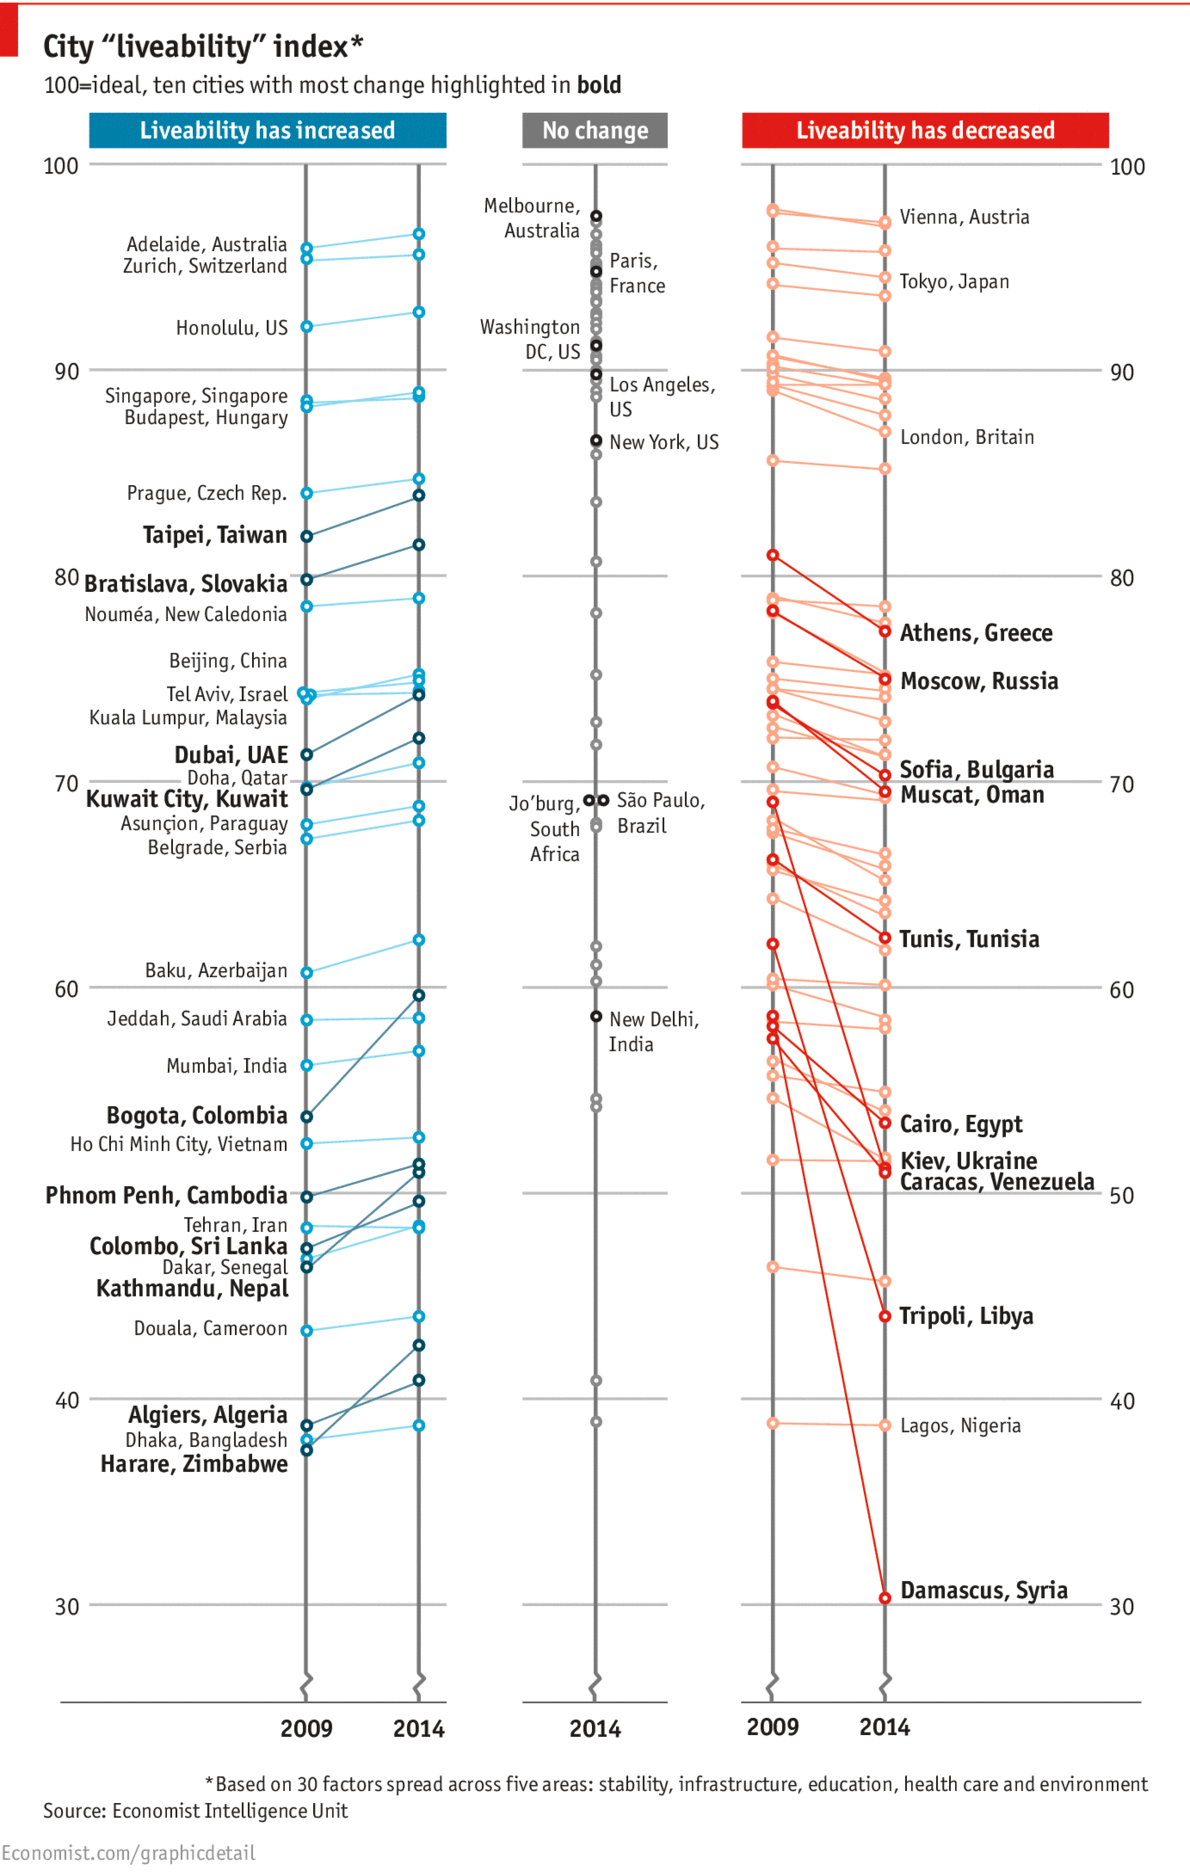
Several months ago the Economist looked at city liveability, which in their words looks at safety, healthcare, educational resources, infrastructure, and environment. And, well, it turns out that Canada, Australia, and New Zealand do really well. The only two cities not in those countries within the top-ten: Vienna, Austria (no. 2) and Helsinki, Finland (no. 8).

City liveability index

What I like about the dot plot is the separation of the data into three sections based on city movement. Those moving up on one line, those moving down on another, and then those with no change plotted in the centre. The cities with the most change in each of the movement sections are then called out in bold. Simple, but clear and effective.

Credit for the piece goes to G.S., K.N.C., and G.D.

Ebola

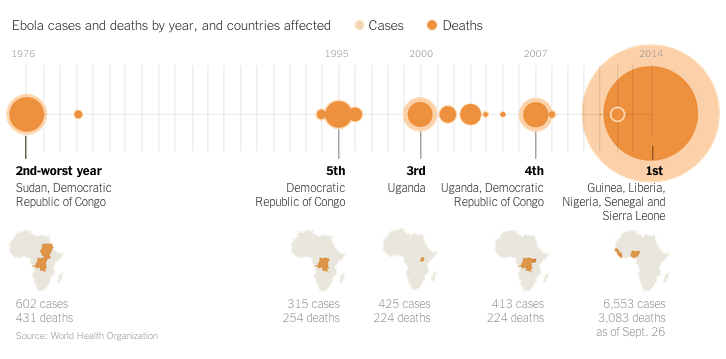
I really enjoy reading articles where graphics accompany the text and not just for the want of graphics. While the Ebola outbreak in West Africa is tragic, the data allows for some nice visualisation pieces. Additionally, one could say that the United States is victim to quite a bit of scaremongering as a result of a few isolated cases of Ebola in Dallas, Texas. Spoiler, an Ebola outbreak is not really a threat to the United States or Western Europe. Perhaps to relieve some of said scaremongering, the New York Times has a nice article titled Ebola Facts that outlines just that, the facts about Ebola. And guess what? The article is accompany by a number of useful inline graphics.

Ebola outbreaks
Ebola outbreaks

Credit for the piece goes to the New York Times’ graphics department.