Several months ago the Economist looked at city liveability, which in their words looks at safety, healthcare, educational resources, infrastructure, and environment. And, well, it turns out that Canada, Australia, and New Zealand do really well. The only two cities not in those countries within the top-ten: Vienna, Austria (no. 2) and Helsinki, Finland (no. 8).
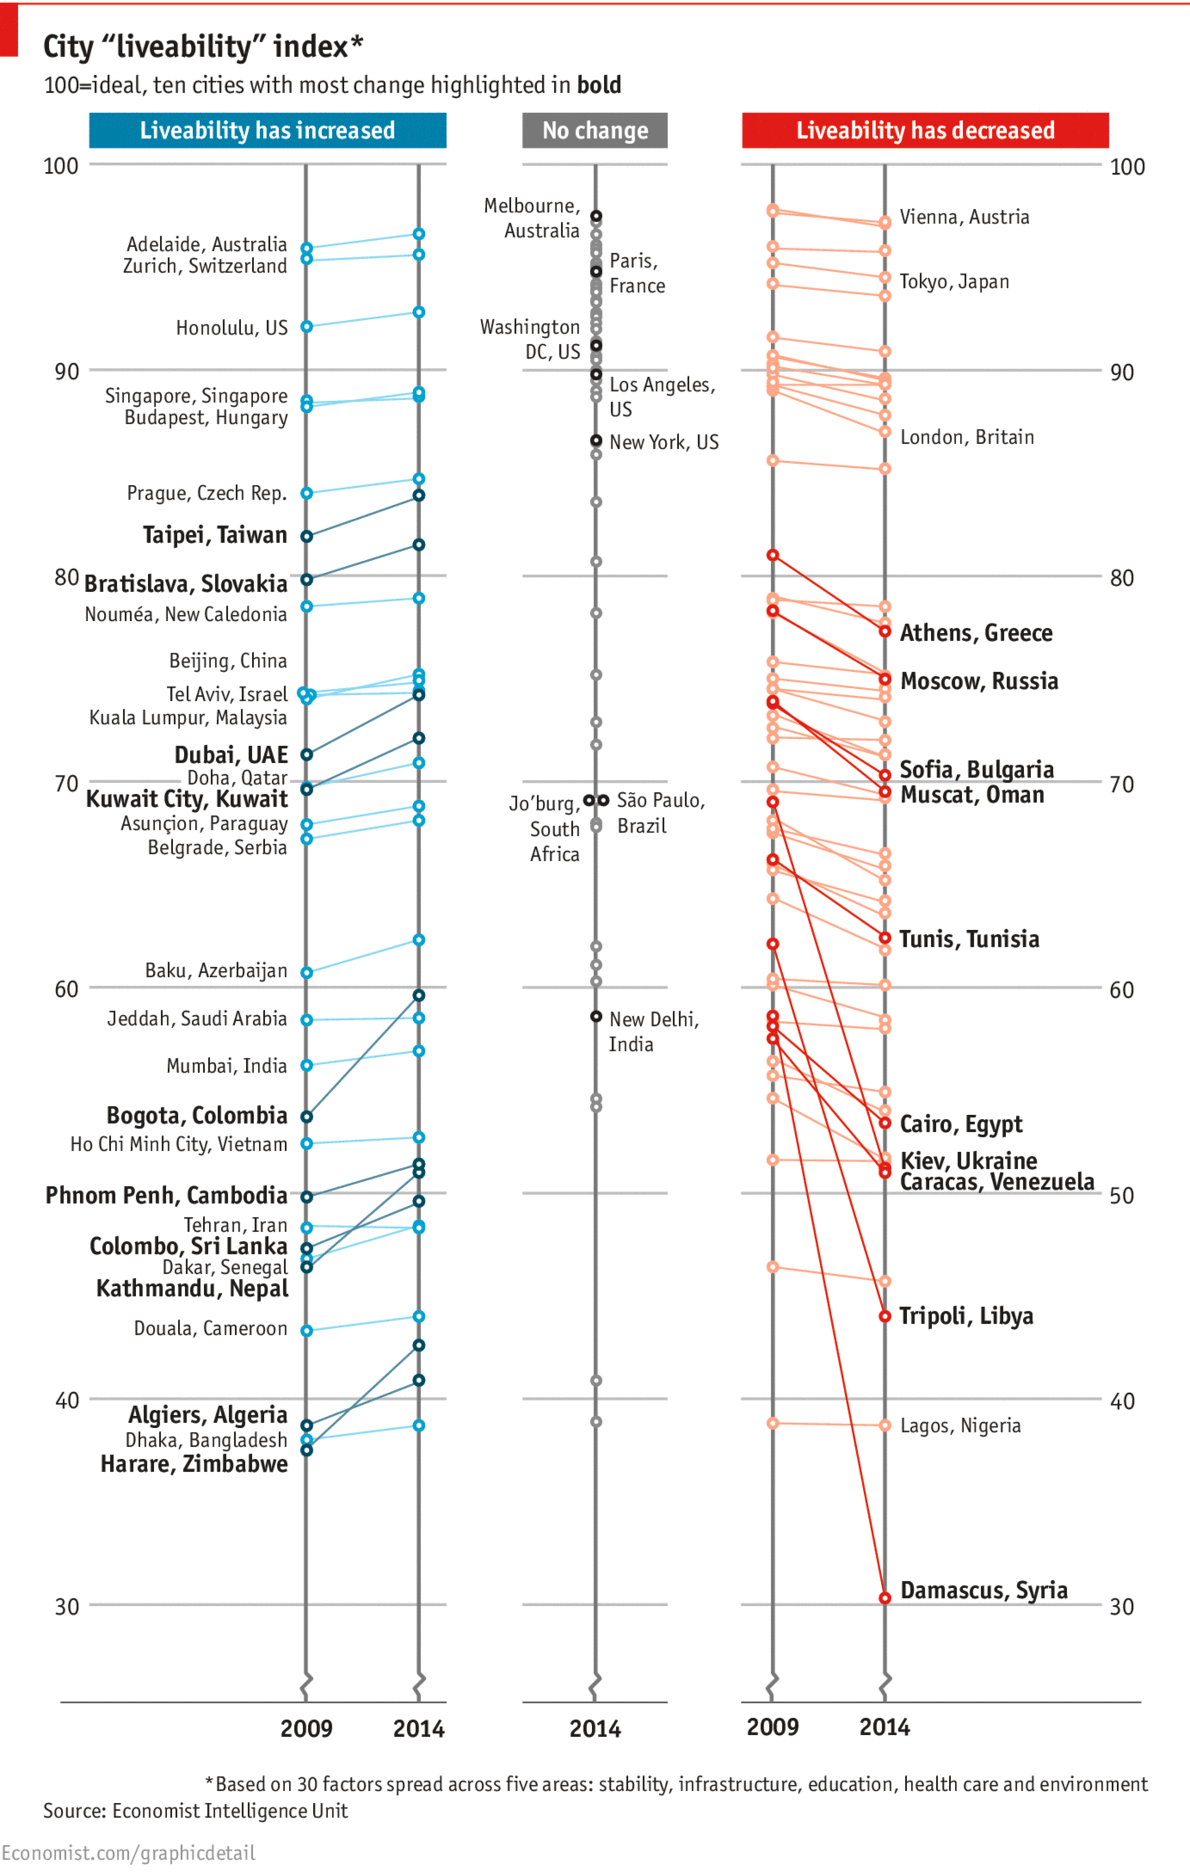
What I like about the dot plot is the separation of the data into three sections based on city movement. Those moving up on one line, those moving down on another, and then those with no change plotted in the centre. The cities with the most change in each of the movement sections are then called out in bold. Simple, but clear and effective.
Credit for the piece goes to G.S., K.N.C., and G.D.
Leave a Reply
You must be logged in to post a comment.