Prorogation of Parliament

If you’re among my British/European audience, you are probably well aware Boris Johnson has prorogued, or suspended, Parliament. He and cabinet ministers stated it was a normal, average-length prorogation to prepare for a Queen’s Speech. (The Queen’s Speech is the formal opening of a new session of Parliament that sets out a new legislative agenda and formally closes/kills any unpassed legislation from the old session.) Except that in documents revealed in a Scottish court case, we now know that the real reason was to shut down Parliament to prevent it from interfering in Boris’ plans for a No Deal Brexit. And just this morning the Scottish High Court did indeed rule that the prorogation is illegal. The case now moves to the UK Supreme Court.

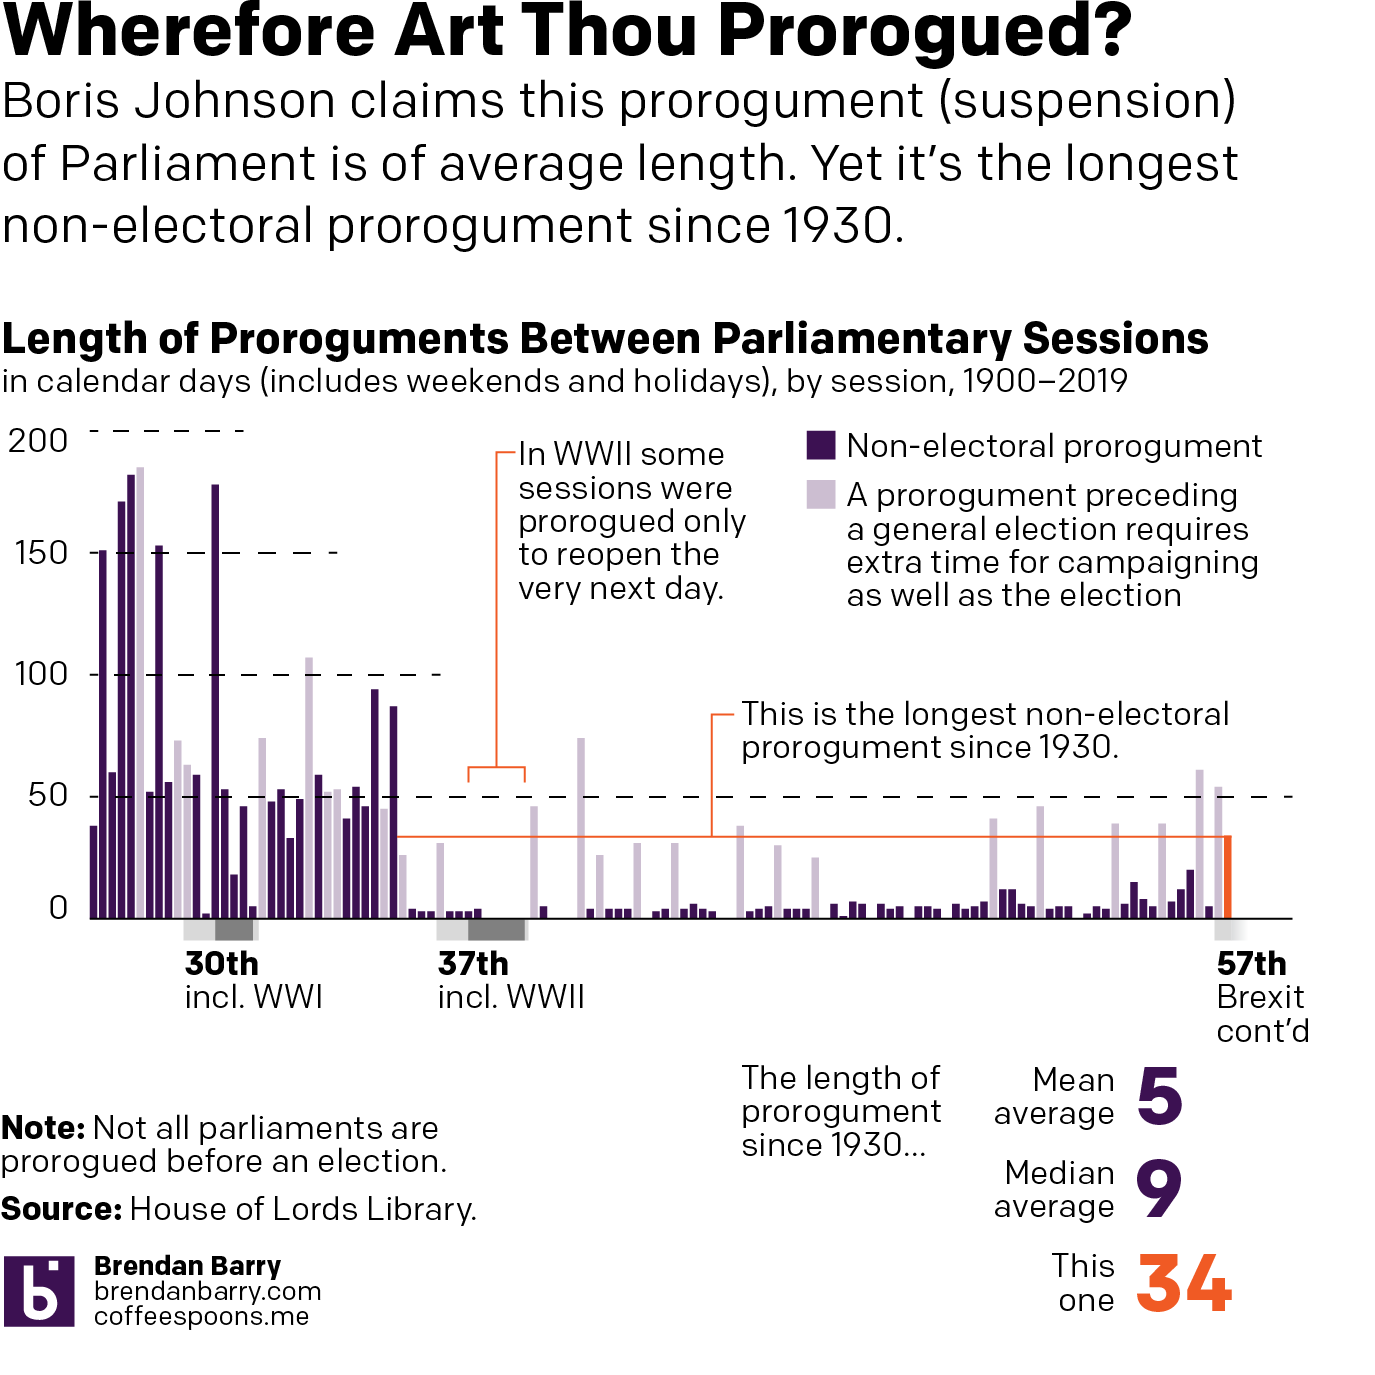
But I want to focus on the other claim, that this is a prorogation of average length. Thankfully instead of having to do a week’s hard slog of data, the House of Lords Library posted the data for me. At least since 1900, and that works well enough for me. And so here we go.
Back to the 1930s?
Back to the 1930s?

So yeah, this is not an average prorogument. If you look at only proroguments that do not precede a general election—you need time for the campaigning and then hosting the actual election in those cases—this is the longest prorogument since 1930. (Also, a Parliament does not necessarily need to be prorogued before it is dissolved before an election. And that happened quite often in the 1960s, 70s, and 80s.)

And as I point out in the graphic, Parliament was prorogued during the depths of World War II to start new legislative sessions. But in those cases, Parliament opened the very next day, during a time of national crisis. One could certainly make the argument that Brexit is a national crisis. So wherefore the extraordinarily long prorogument? Well, quite simply, Brexit.

Credit for the piece goes to me.

Greenland Is Melting

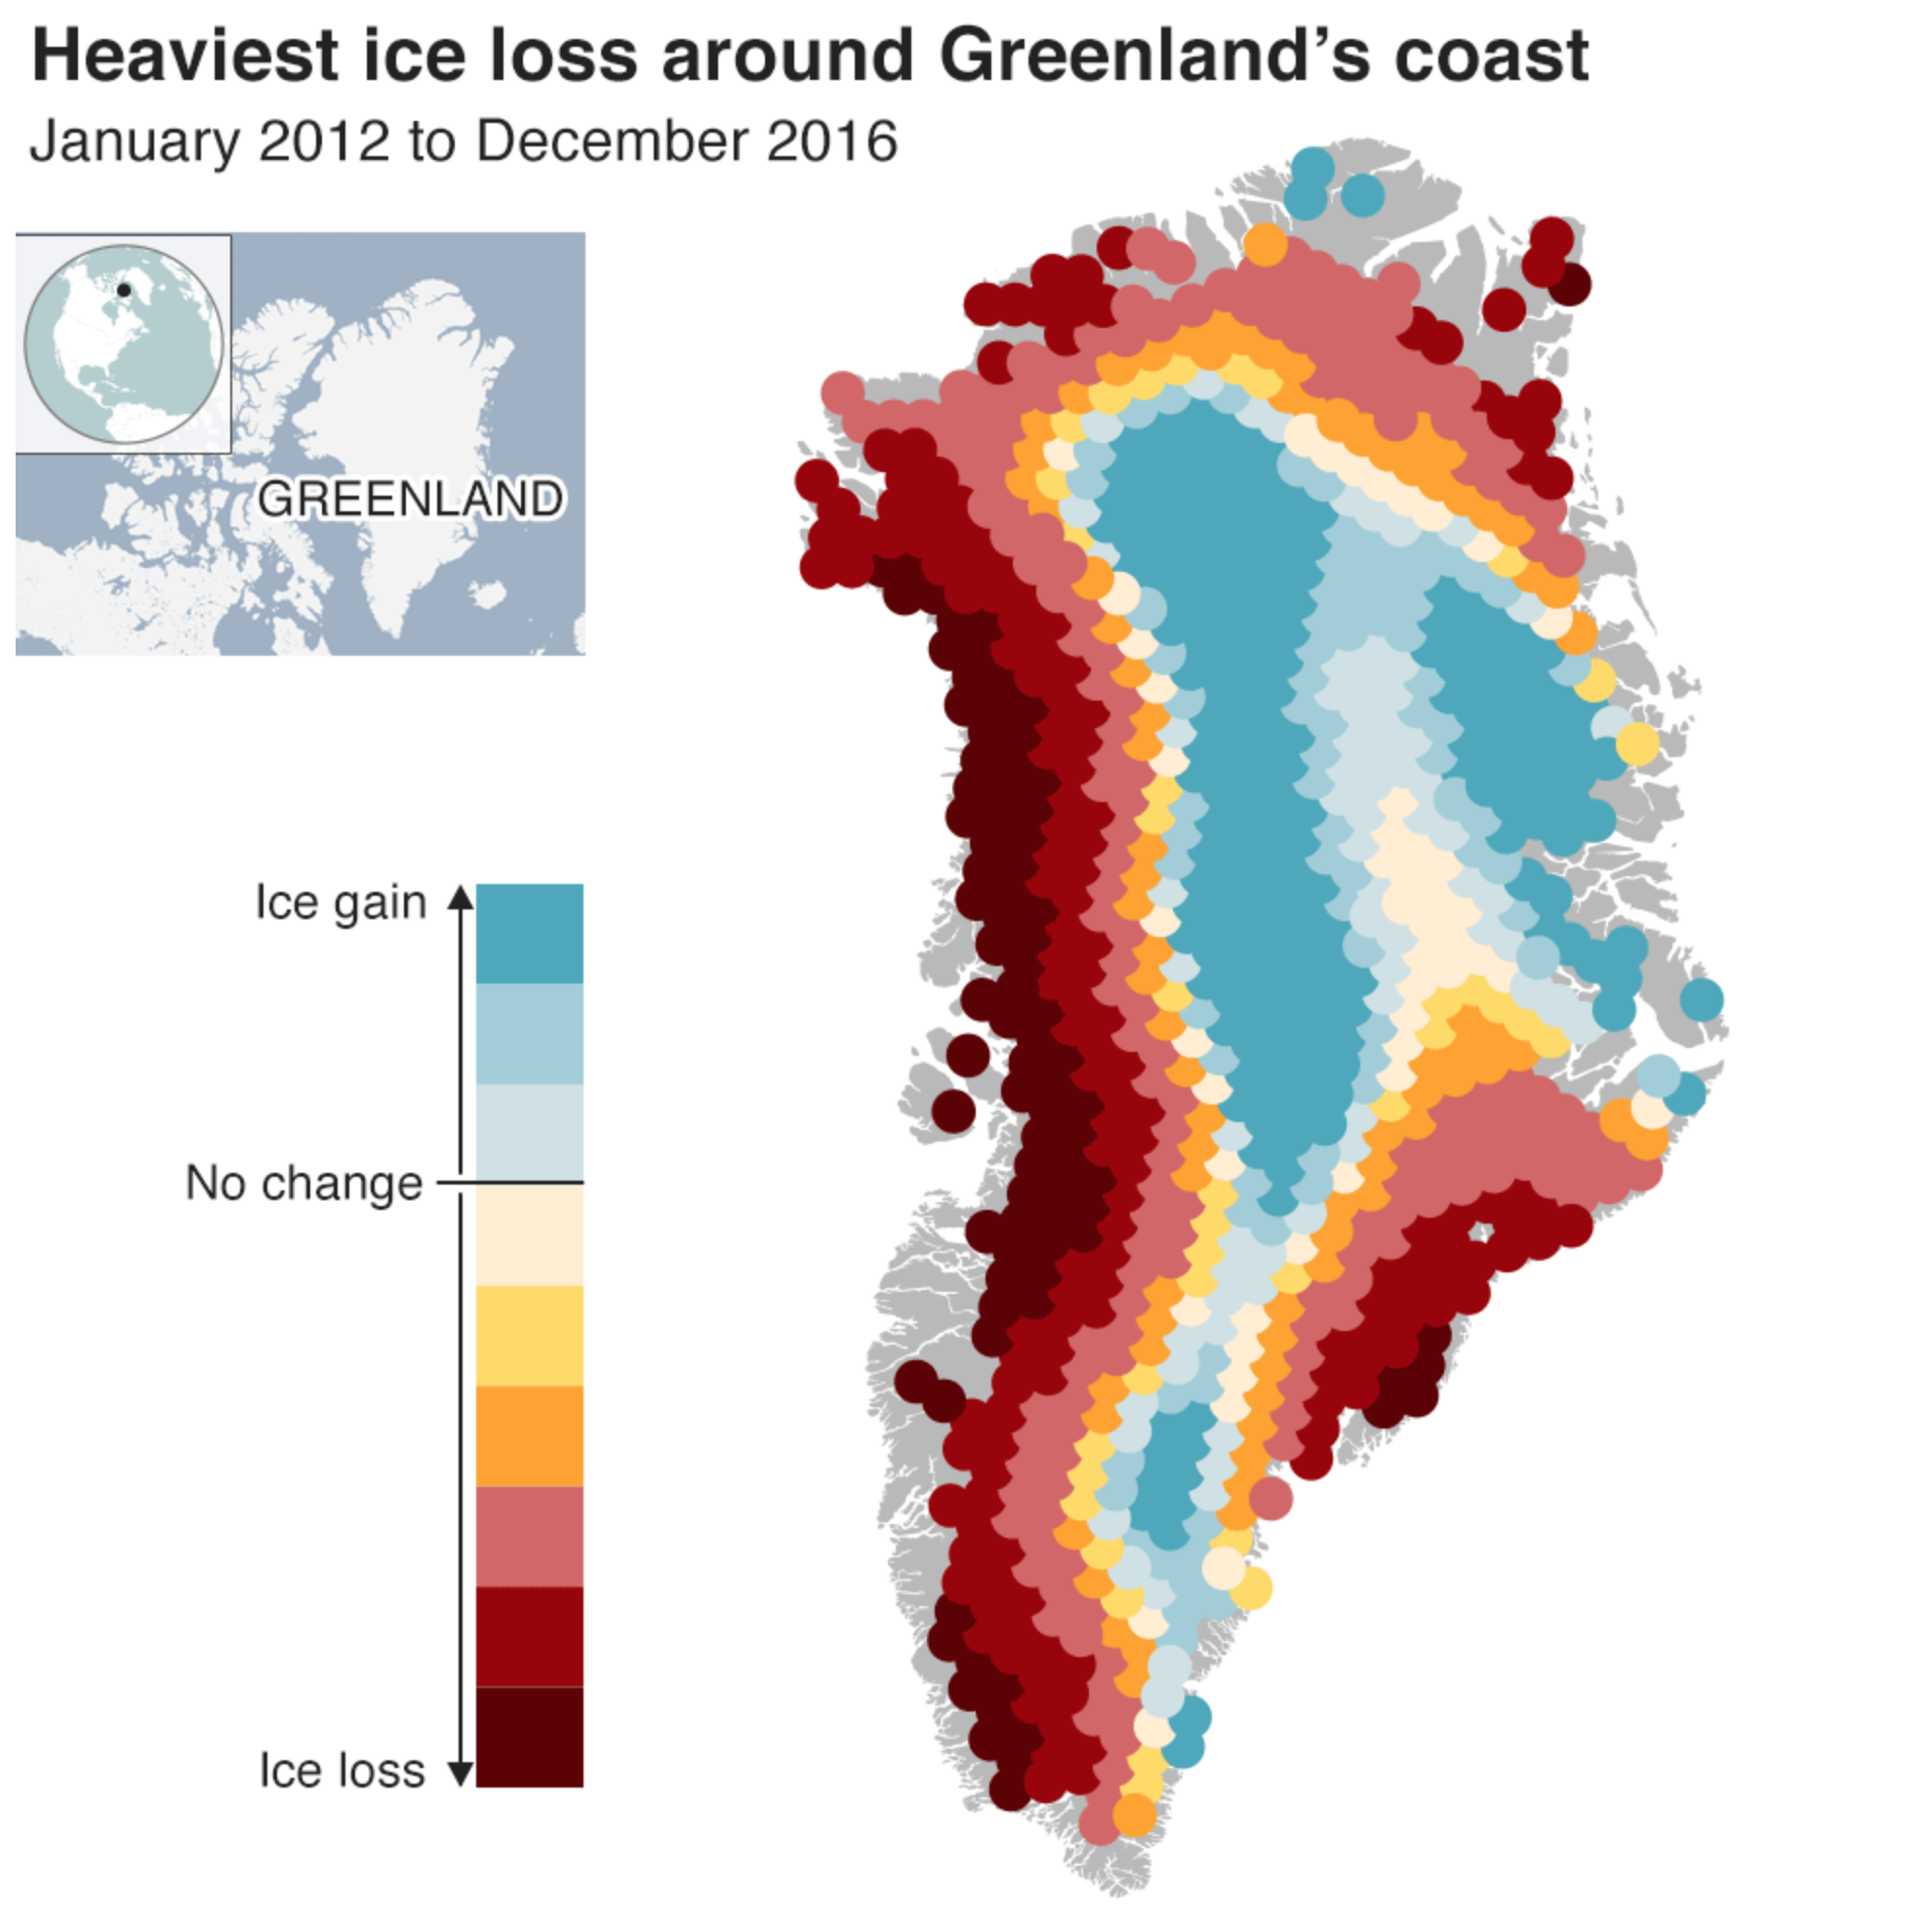
There is a lot going on in the world—here’s looking at you Brexit vote today—but I did not want to miss this frightening article from the BBC on the melting of Greenland’s ice. It’s happening. And it’s happening faster than thought.

There are several insightful graphics, including the standard photo slider of before and after, a line chart showing the forecast rise of sea levels within the possible range. But this one caught my eye.

Alarming rates along the coast.

The colour palette here works fairly well. The darkest reds are not matched by a dark blue, but that is because the ice gain does not match the ice loss. Usually we might see a dark blue just to pair with a dark red, but again, we don’t because the designers recognised that, as another chart shows, the ice loss is outweighing the gains, though there are some to be found most notably at the centre of the ice sheets. This is a small detail, but something that struck me as impressive.

My only nitpick is that the legend does not quantify the amounts of gain or loss. That could show the extremes and reinforce the point that the loss is dwarfing the gain.

Credit for the piece goes to the BBC graphics department.

Pub Trivia Scores

So today we have pub trivia scores.

It’s been a little while since I’ve posted from my data recording of my Wednesday night’s team trivia pub scores. For the very few of us who know what this means, here you go.

We're on a downward trend
We’re on a downward trend

Essentially, our ability to score points on music in the last round remains pretty bad. Hence the general downward trend.

Credit for this piece goes to me.

Greenland, the 51st State?

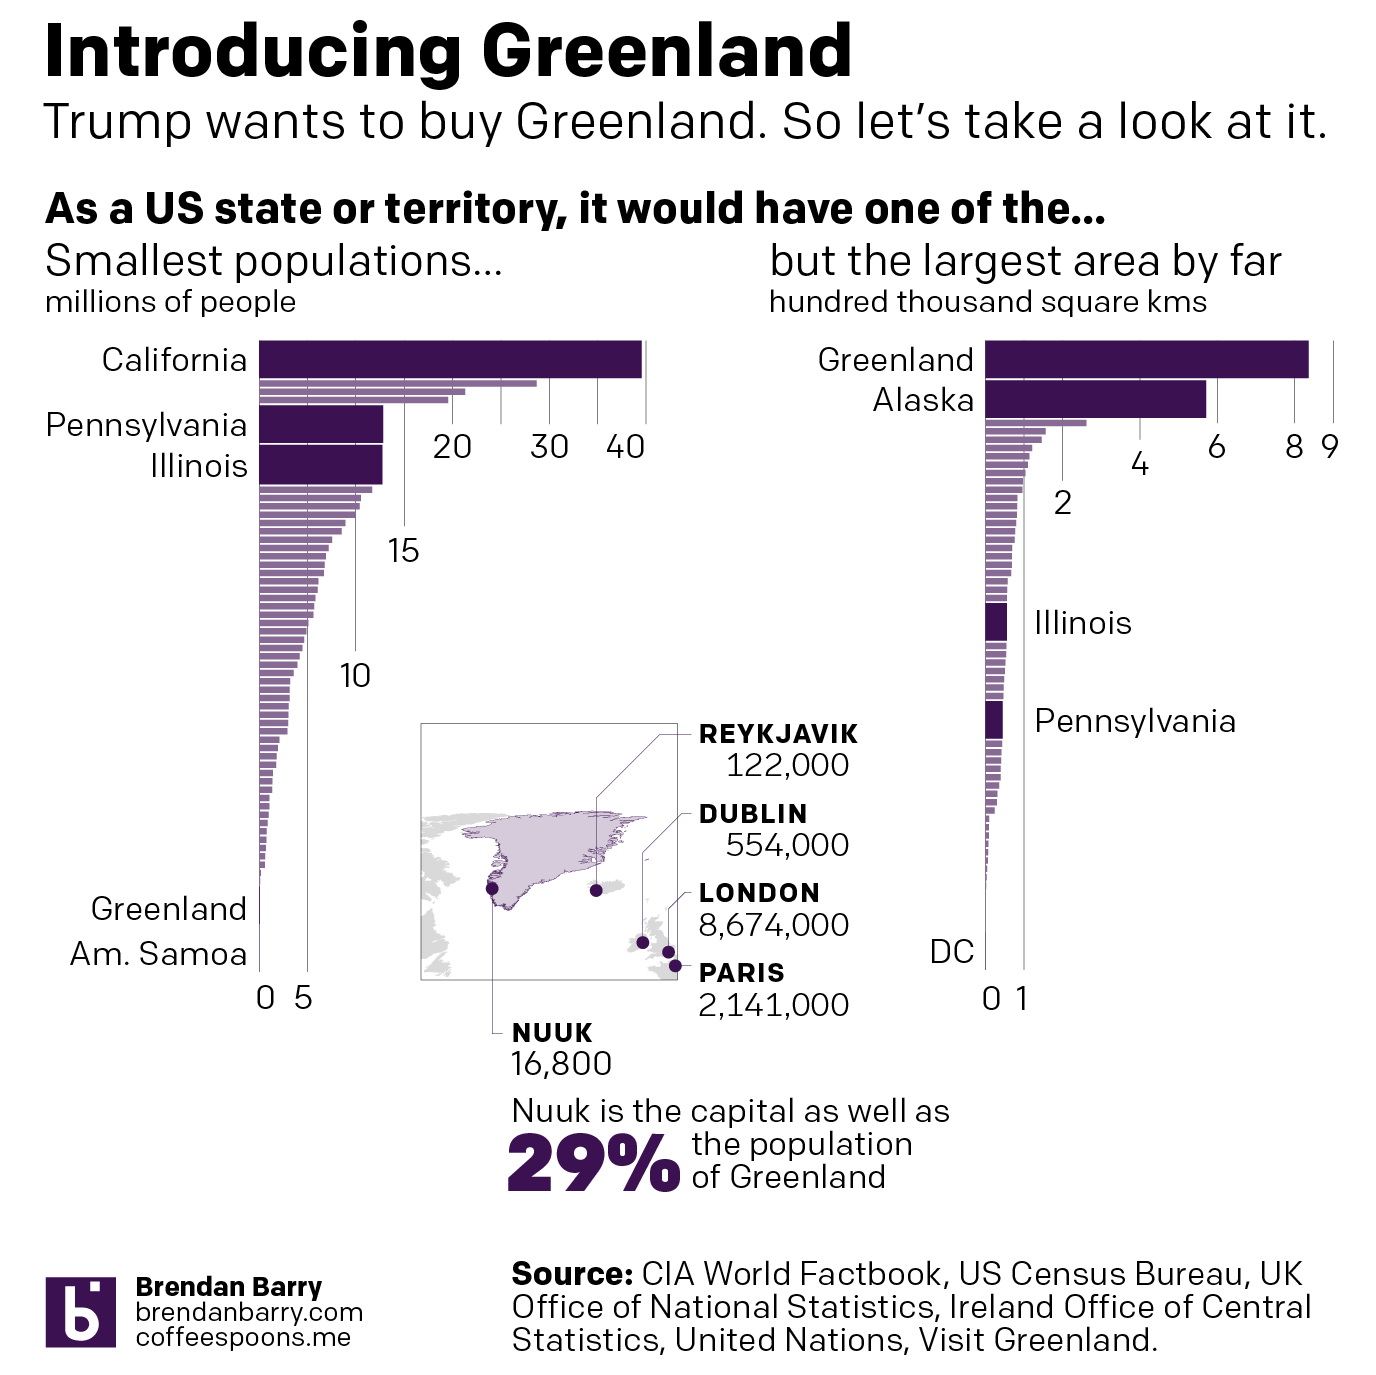
If you haven’t heard, President Trump wants to buy Greenland from Denmark. So is Greenland going to beat Puerto Rico to joining the Union as the 51st state?

No.

Not even close.

It would be the smallest state in terms of population, but also one of the smallest US territories. But in terms of area, Greenland dwarfs every state but Alaska. Though it still beats Alaska by almost 50% of its land area.

It's like a super-charged Seward's Folly
It’s like a super-charged Seward’s Folly

I had hoped to include some more economic data, but that will have to wait for a different post. Acquiring the population data was actually the most difficult—the US Census Bureau does not actually have easy to access data on the populations of US territories not called Puerto Rico.

This piece is mine.

How Warm Will It Get?

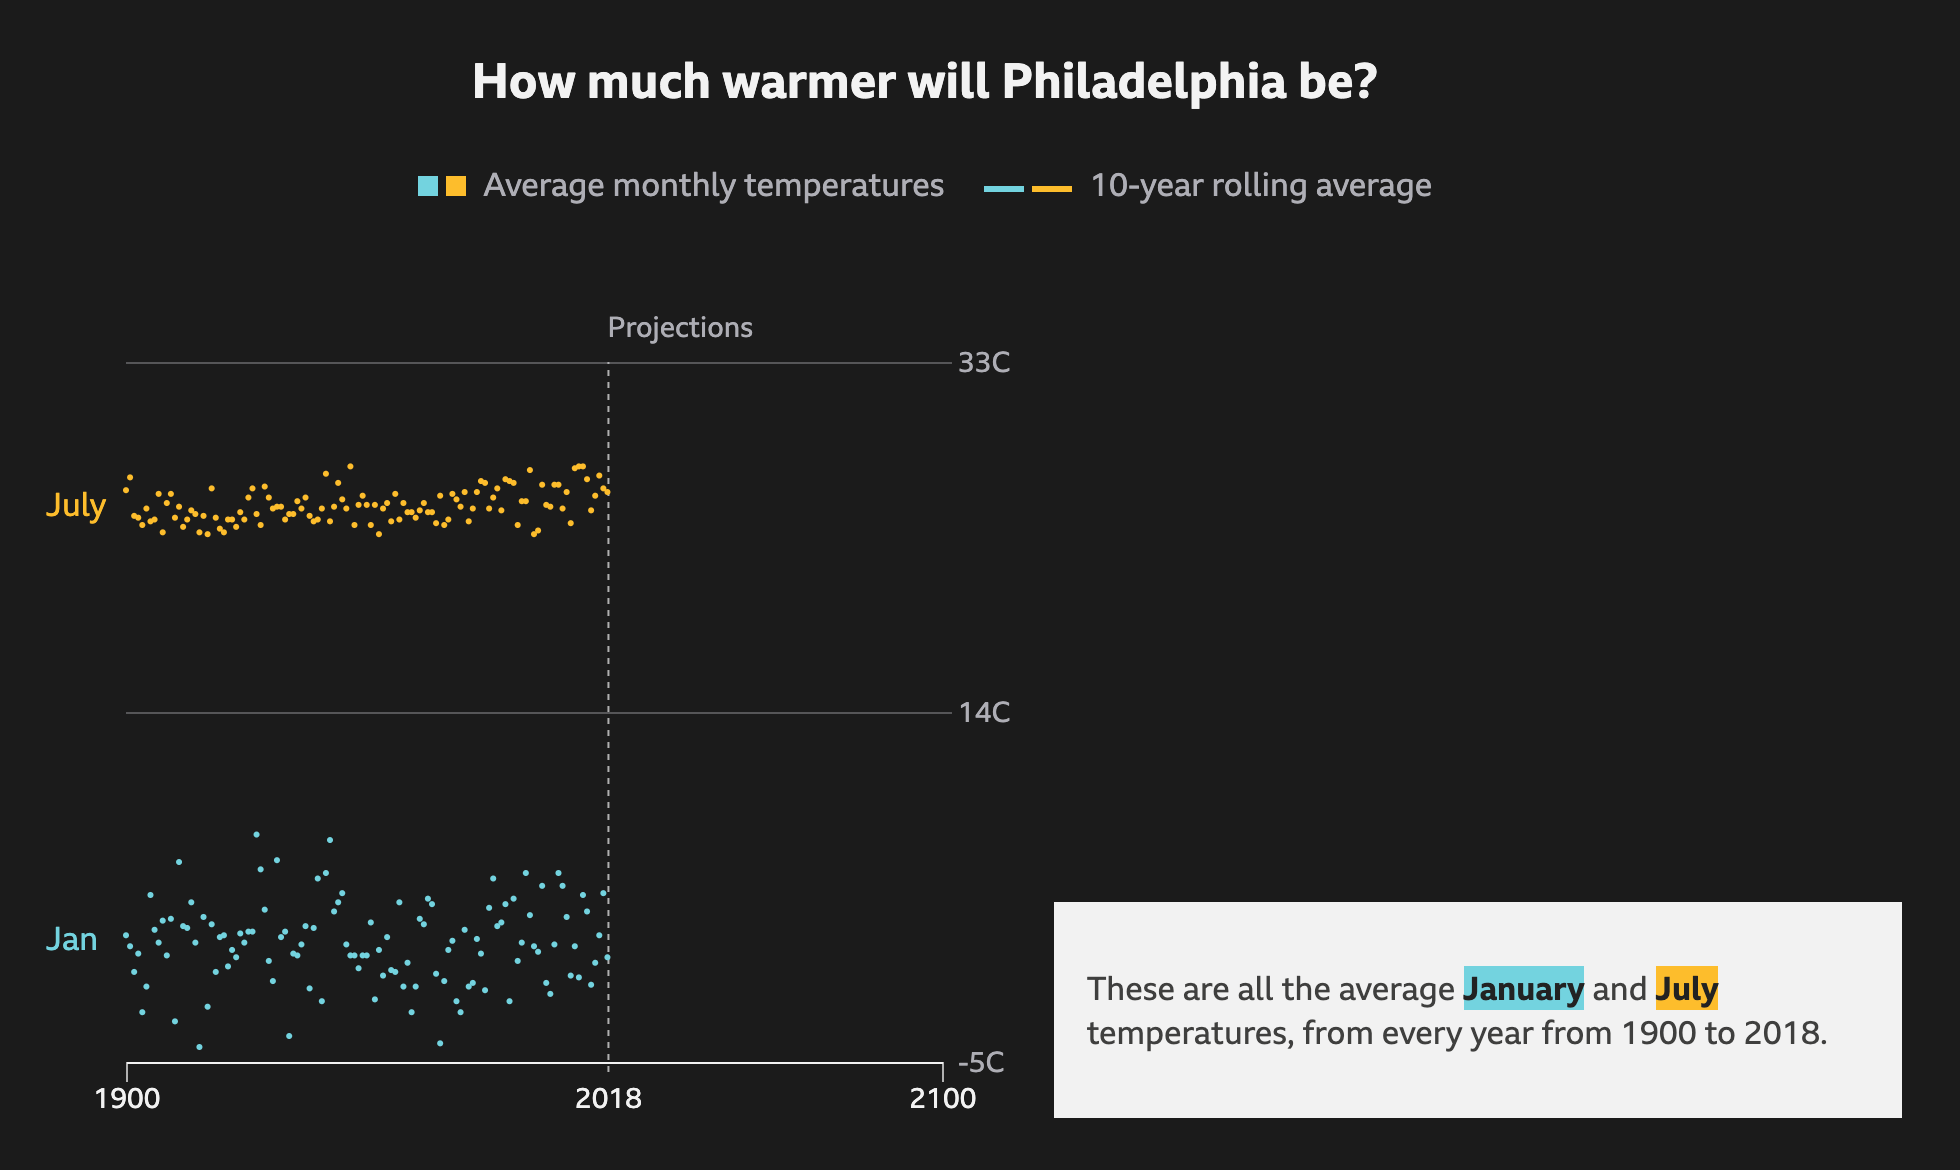
In Philadelphia, this summer has been warmer than average. But with most recent years being warmer than average, that might not mean much. However, a valid question is that with climate change, how much warmer will the city get on average? The BBC recently published an article that explored the temperature changes in cities around the world according to several different models for best to worst case scenarios.

The raw data so to speak

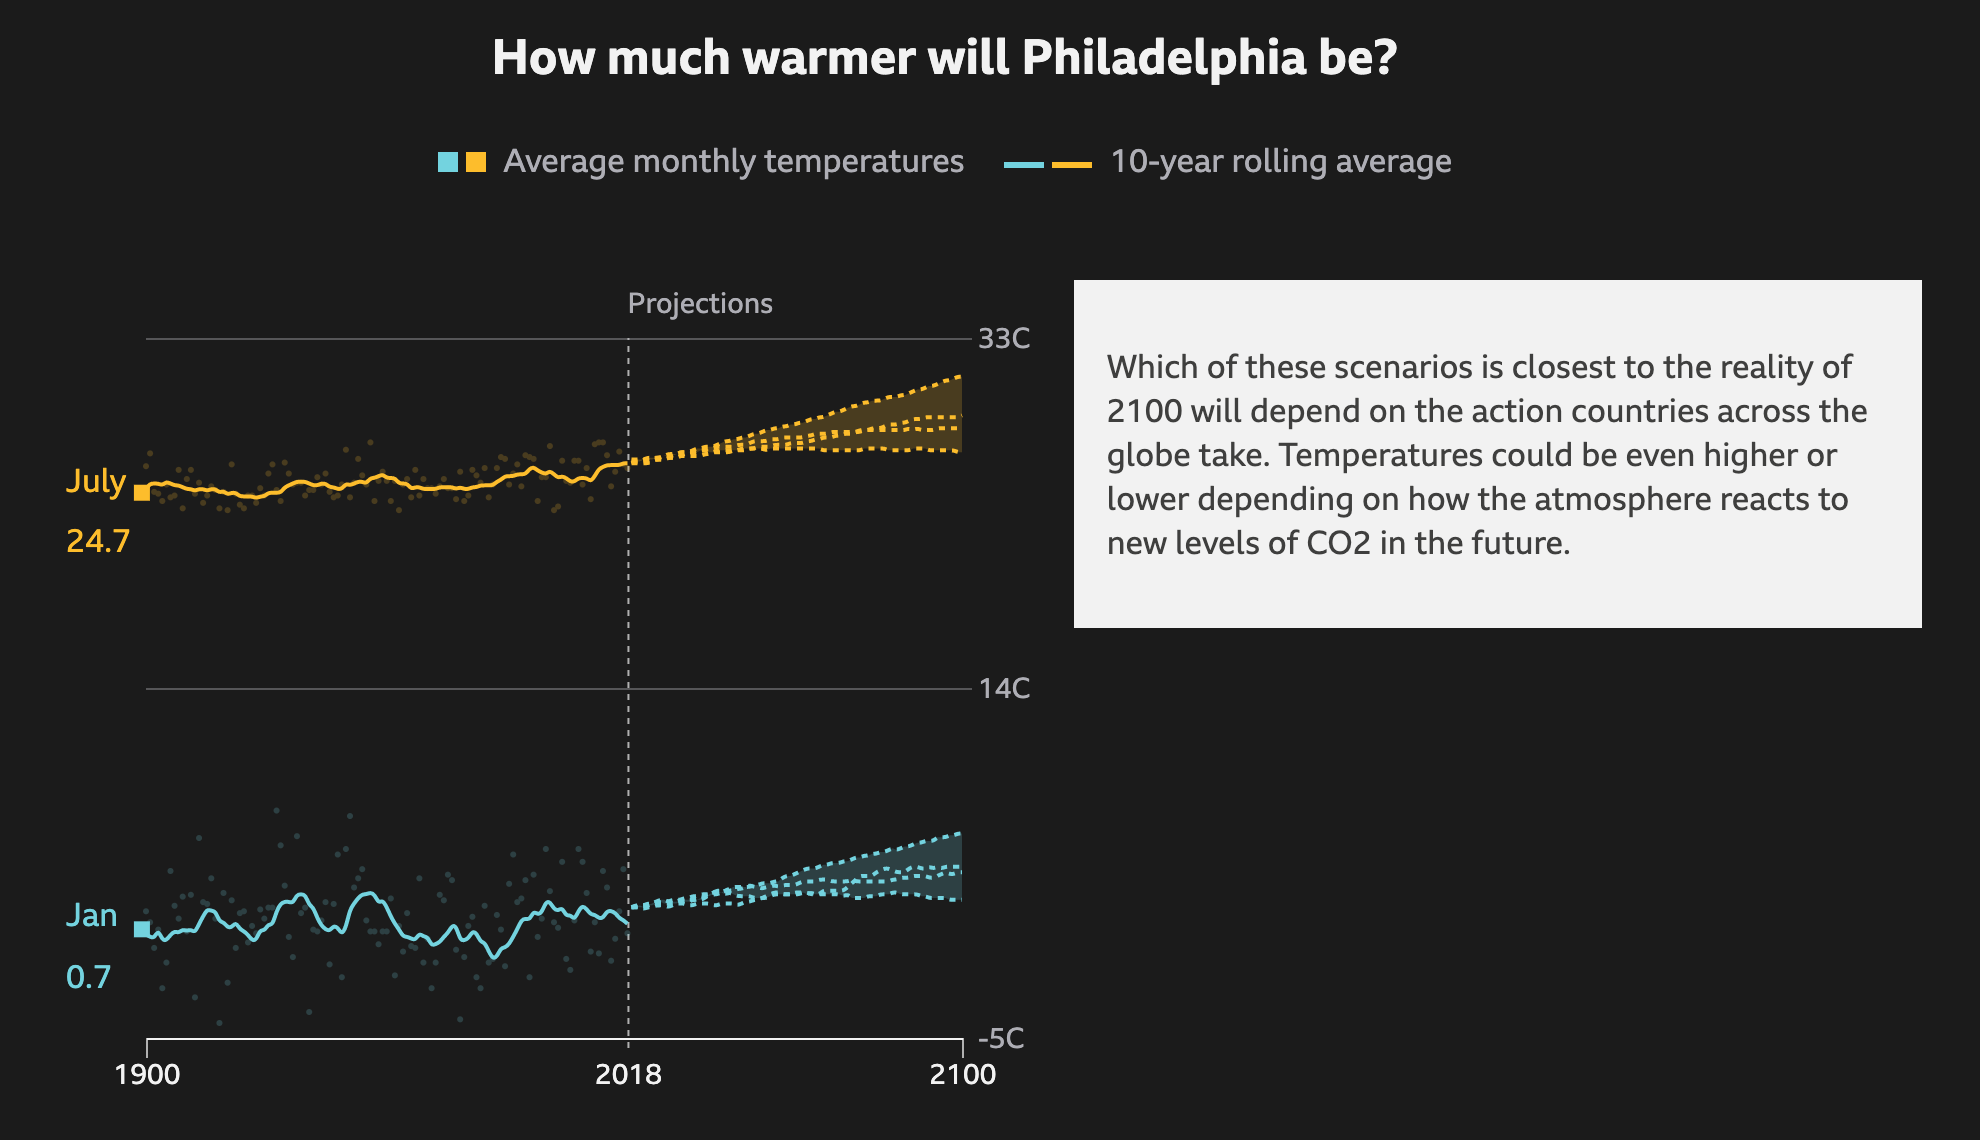
It does a nice job via scrolling of showing how the averages work as a rolling average and the increase over time. It runs through each scenario, from best case to worst case, as a dotted line and then plots each in comparison to each other to show the range of possible outcomes.

Ew. Just ew.
Ew. Just ew.

I know that dark or black background is in style for big pieces. But I still do not love them. Thankfully the choice of these two colours work here. The dotted lines also work for showing the projections. And in the intermediate steps, not screencaptured, the previous projections go dark and only the current one is highlighted.

Thankfully the text boxes to the right capture the critical numbers: the actual projection numbers for the monthly average. And they tie them to the lines via the colours used.

Not shown here are a few other elements of the piece. The top of the article starts with a spinning globe that shows how the average temperature across the globe has already changed. Spoiler: not well. While the spinning globe adds some interactivity to the article, it by definition cannot display the entire world all at once, like flat, two-dimensional projections do. This makes it difficult to see impacts across the globe simultaneously. A more standard projection map could have worked really well.

Lastly, the article closes with a few stories about specific locations and how these temperature increases will impact them. These use more illustrations and text. The exception, however, is a graphic of the Arctic that shows how summer sea ice coverage has collapsed over the last few decades.

Overall this is a strong piece that shows some global impacts while allowing the user to dive down into the more granular data and see the impact on some of the world’s largest cities.

Credit for the piece goes to BBC Visual and Data Journalism team.

How Mass Shootings Have Changed

A few weeks ago here in the United States, we had the mass shootings in El Paso, Texas and Dayton, Ohio. The Washington Post put together a piece looking at how mass shootings have changed since 1966. And unfortunately one of the key takeaways is that since 1999 they are far too common.

The biggest graphic from the article is its timeline.

Getting worse over time

It captures the total number of people killed per event. But, it also breaks down the shootings by admittedly arbitrary time periods. Here it looks at three distinct ones. The first begins at the beginning of the dataset: 1966. The second begins with Columbine High School in 1999, when two high school teenagers killed 13 fellow students. Then the third begins with the killing of 9 worshippers in a African Episcopal Methodist church in Charlestown, South Carolina.

Within each time period, the peaks become more extreme, and they occur more frequently. The beige boxes do a good job of calling out just how frequently they occur. And then the annotations call out the unfortunate historic events where record numbers of people were killed.

The above is a screenshot of a digital presentation. However, I hope the print piece did a full-page printing of the timeline and showed the entire timeline in sequence. Here, the timeline is chopped up into two separate lines. I like how the thin grey rule breaks the second from the third segment. But the reader loses the vertical comparison of the bars in the first segment to those in the second and third.

Later on in the graphic, the article uses a dot plot to examine the age of the mass shooters. There it could have perhaps used smaller dots that did not feature as much overlap. Or a histogram could have been useful as infrequently used type of chart.

Lastly it uses small multiples of line charts to show the change in frequency of particular types of locations.

Overall it’s a solid piece. But the timeline is its jewel. Unfortunately, I will end up talking about similar graphics about mass shootings far too soon in the future.

Credit for the piece goes to Bonnie Berkowitz, Adrian Blanco, Brittany Renee Mayes, Klara Auerbach, and Danielle Rindler.

It’s Boris Time, Baby

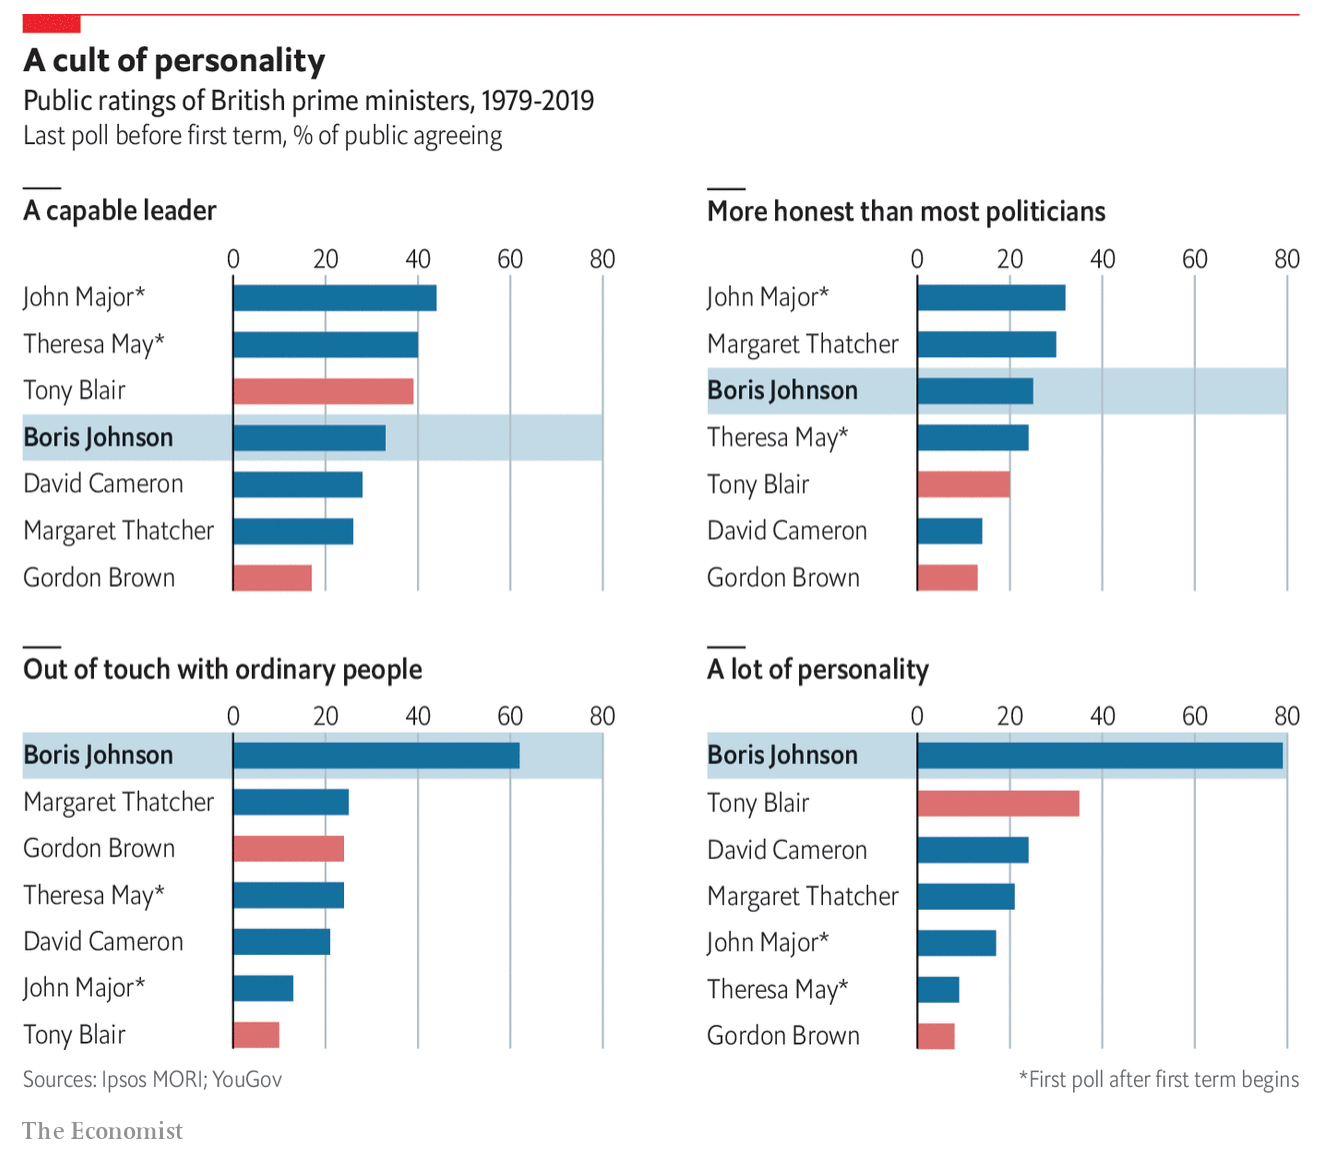
Today Boris Johnson begins his premiership as the next prime minister of the United Kingdom. He might not be popular with the wide body of the British population, but he is quite popular with the Conservative base.

The Economist looked at how Boris polled on several traits, e.g. being more honest than most politicians, compared to his prime minister predecessors before they entered office. And despite being broadly unpopular outside the Tories, he still polls better than most of his predecessors.

Boris rates higher than many previous prime ministers before they came to power

Design wise, it’s a straight-forward use of small multiples and bar charts. I find the use of the light blue bar a nice device to highlight Boris’ position amongst his peers.

But now we see where Boris goes, most importantly on Brexit.

Credit for the piece goes to the Economist graphics department.

The Rent Is Too Bloody High

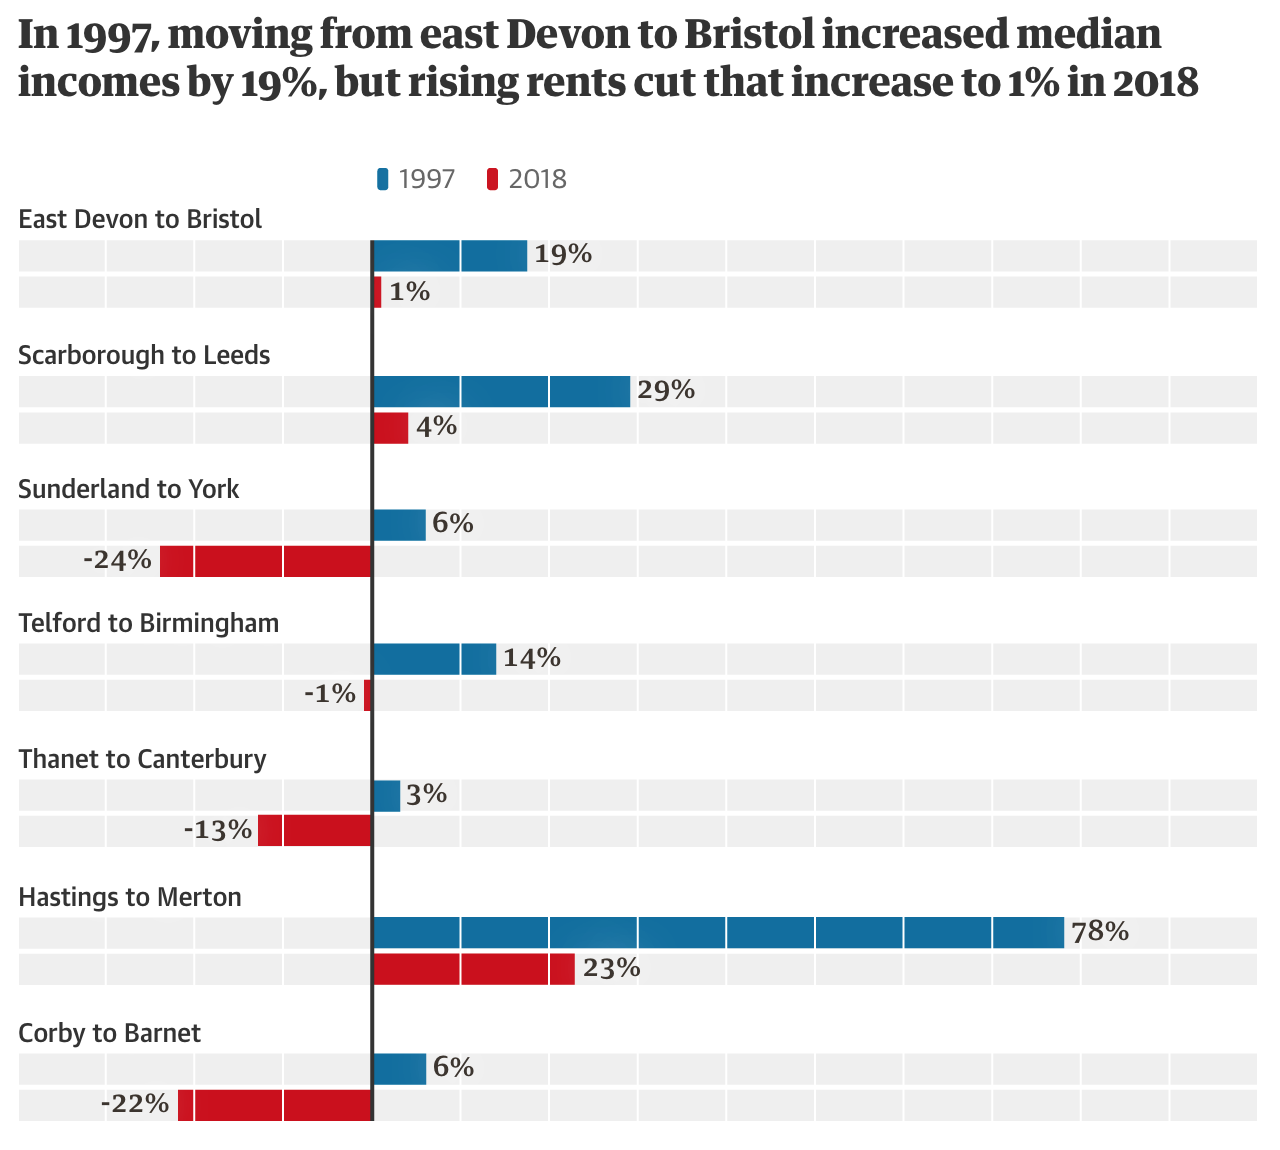
This is a graphic from the Guardian that sort of mystified me at first. The article it supports details how the rising rents across England are hurting the rural youth so much so they elect to stay in their small towns instead of moving to the big city.

But all those segments?

The first thing I noticed is that there really is no description of the data. We have a chart looking at something from 1997 and comparing it to 2018. The title is more of a sentence describing the first pair of bars. And from that title we can infer that these bars are income changes for the specified move, e.g. Sunderland to York, for the specified year. But a casual reader might not pick up on that casual description.

Then we have the issue of the bars themselves. What sort of range are we looking at? What is the min? The max? That too is implied by the data presented in the bars. Well, technically not the bars, but in the numbers at the end of each bar. I will spare you the usual rant about numbers in graphics defeating the purpose of graphics and organisation vs. visual relationship. Instead, the numbers here are essential because we can use them to suss out the scale of the grey bars. After looking at a few bars, we can tell that the white lines separating the grey boxes are most likely 10% increments. And from that we can gather the minimum is about -40% and the maximum 100%. But instead of making the reader work to figure this out, would not some min/max labels at the bottom of the chart be far clearer?

And then there is the issue of the grey boxes/bars themselves. Why are they there in the first place? If the dataset were more about an unmet value, say reservoirs in towns were only at x% of capacity, the grey bars could relate the overall capacity and the coloured bars the actual values. But here, income is not a capacity or similar type of value. It could expand well beyond the 100% or decline beyond the -40%. These bars imply the values are trapped within these ranges. I would instead drop the grey bars entirely and let the coloured bars exist on their own.

Overall this is a confusing graphic for a fascinating article. I wish the graphic had been a little bit clearer.

Credit for the piece goes to the Guardian’s graphics department.

The Ebola Outbreak in the Congo

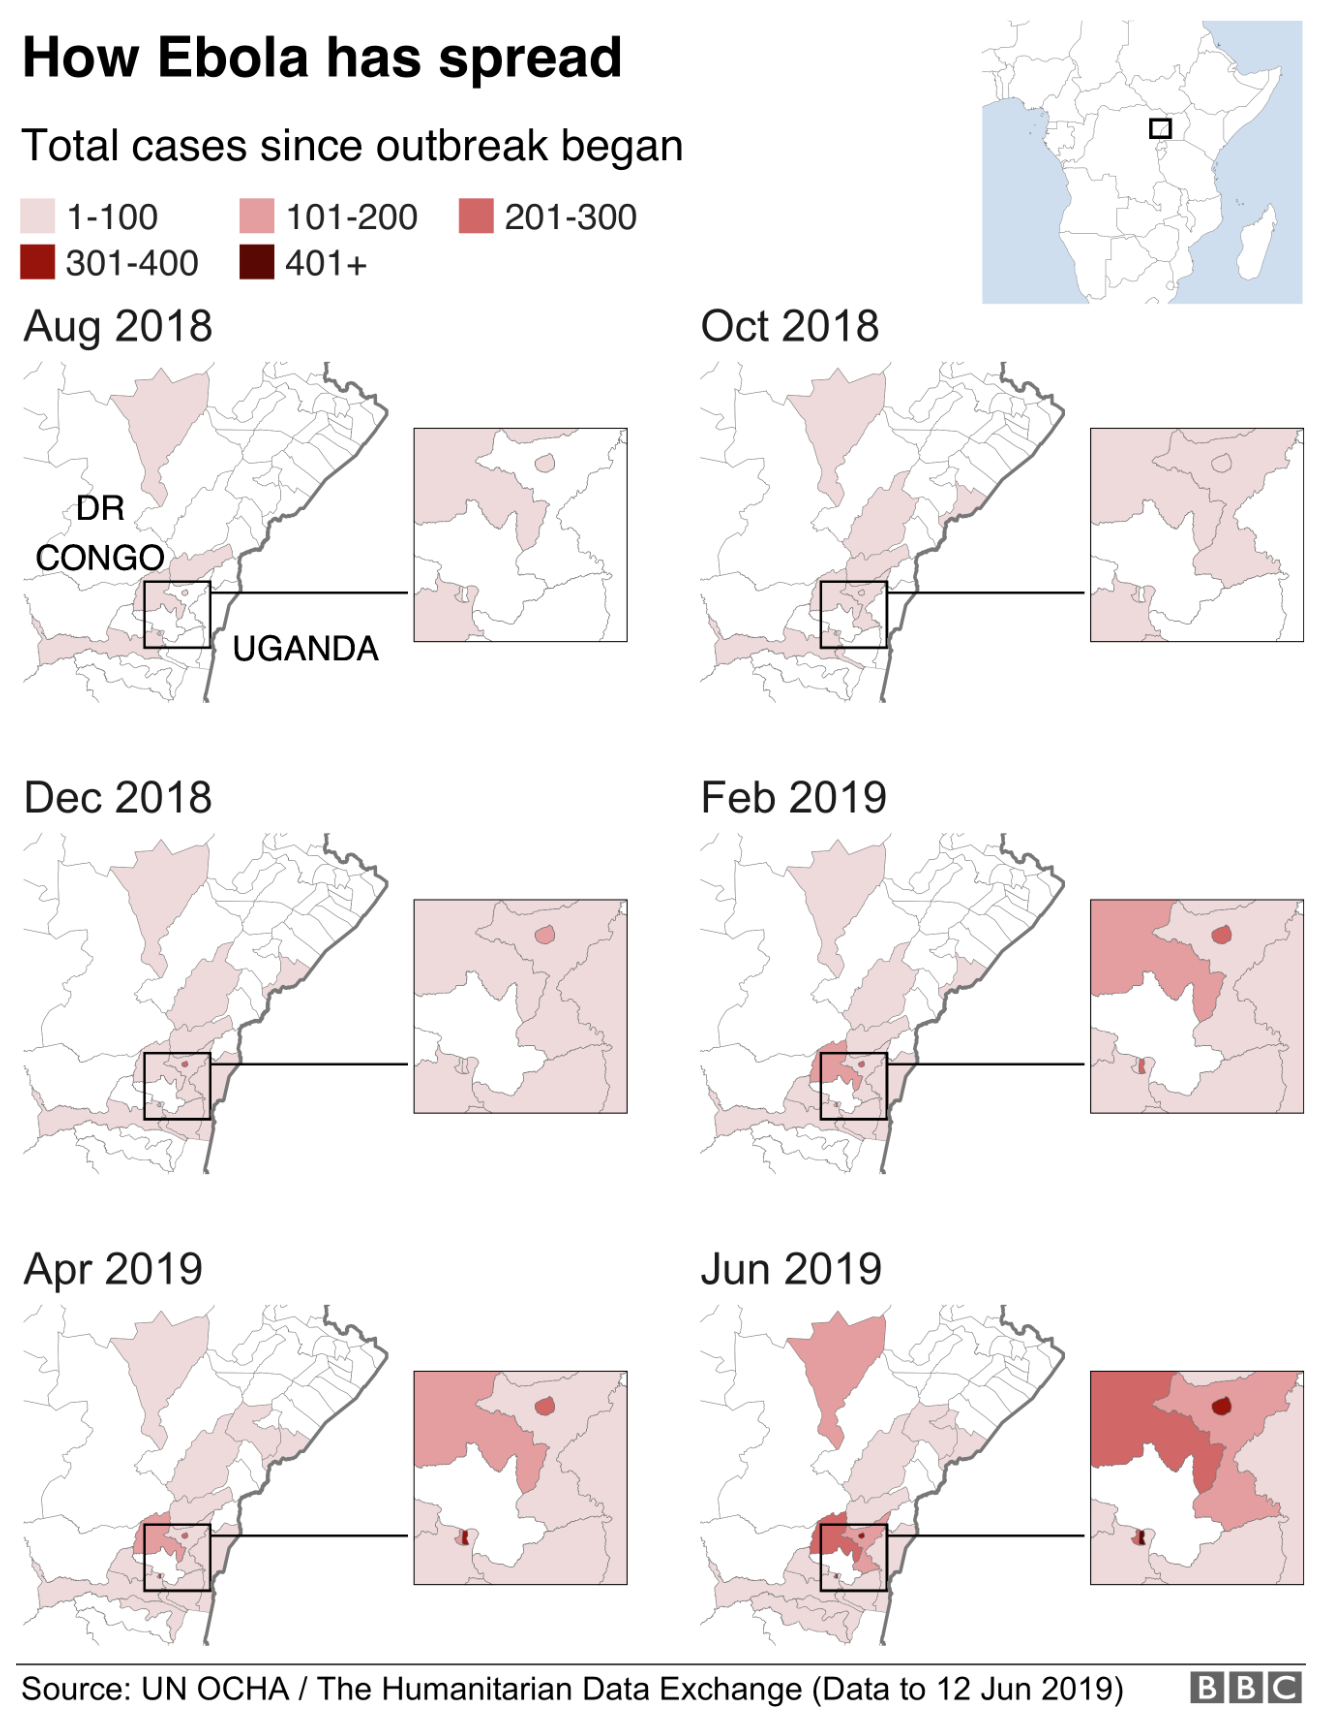
Ebola, which killed 11,000 people in West Africa in 2014 (which I covered in a couple of different posts), is back and this time ravaging the Congo region, specifically the Democratic Republic of the Congo (DRC). The BBC published an article looking at the outbreak, which at 1,400 deaths is still far short of the West Africa outbreak, but is still very significant.

That's looking like a tenuous border right now…
That’s looking like a tenuous border right now…

The piece uses a small multiples of choropleths for western Congo. The map is effective, using white as the background for the no case districts. However, I wonder, would be more telling if it were cases per month? That would allow the user to see to where the outbreak is spreading as well as getting a sense of if the outbreak is accelerating or decelerating.

The rest of the article features four other graphics. One is a line chart that also looks at cumulative cases and deaths. And again, that makes it more difficult to see if the outbreak is slowing or speeding up. Another is how the virus works and then two are about dealing with the virus in terms of suits and the containment camps. But those are graphics the BBC has previously produced, one of which is in the above links.

Credit for the piece goes to the BBC graphics department.

Or Just Don’t Be a Dick

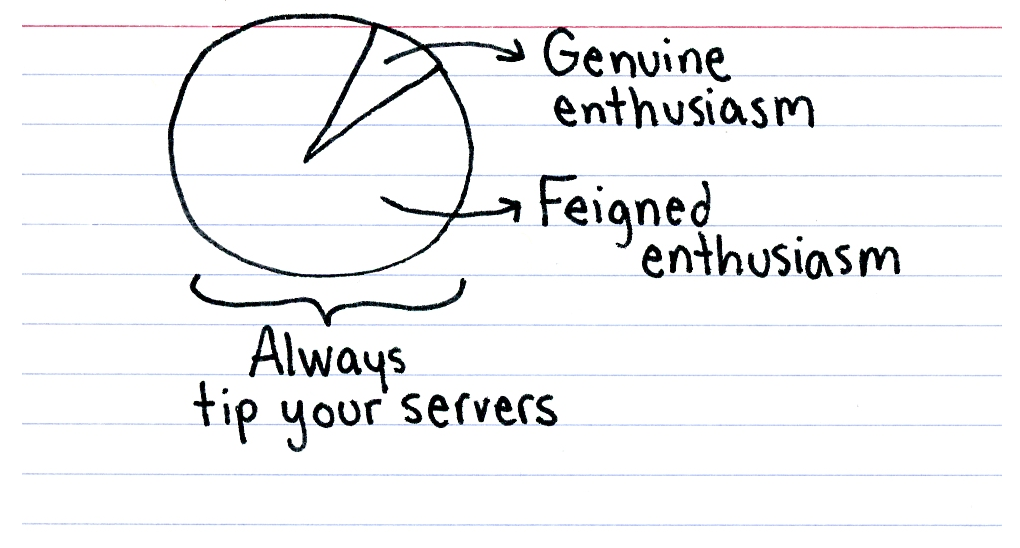
Long before I worked as a designer, I was a busboy. After that I was a dishwasher. After that I was a barista. Then I became a designer. This graphic from Indexed resonated with me, because, yeah, at a more basic level, don’t fuck with your servers.


Or, in simpler terms, don't be a dick…
Or, in simpler terms, don’t be a dick…

Credit for the piece goes to Jessica Hagy.