Revenge of the Flyover States

Just before Halloween, NBC News published an article by political analyst David Wasserman that examined what airports could portend about the 2020 American presidential election. For those interested in politics and the forthcoming election, the article is well worth the read.

The tldr; Democrats have been great at winning over cosmopolitan types in global metropolitan areas in the big blue states, e.g. New York and California. But the election will be won in the states where the metropolitan areas that sport regional airports dominate, i.e. Pennsylvania, Michigan, Wisconsin, and North Carolina. And in those districts, support for Democrats is waning.

The closing line of the piece sums it up nicely:

…to beat Trump, Democrats will need to ask themselves which candidates’ proposals will fly in Erie, Saginaw and Green Bay.

But what about the graphics?

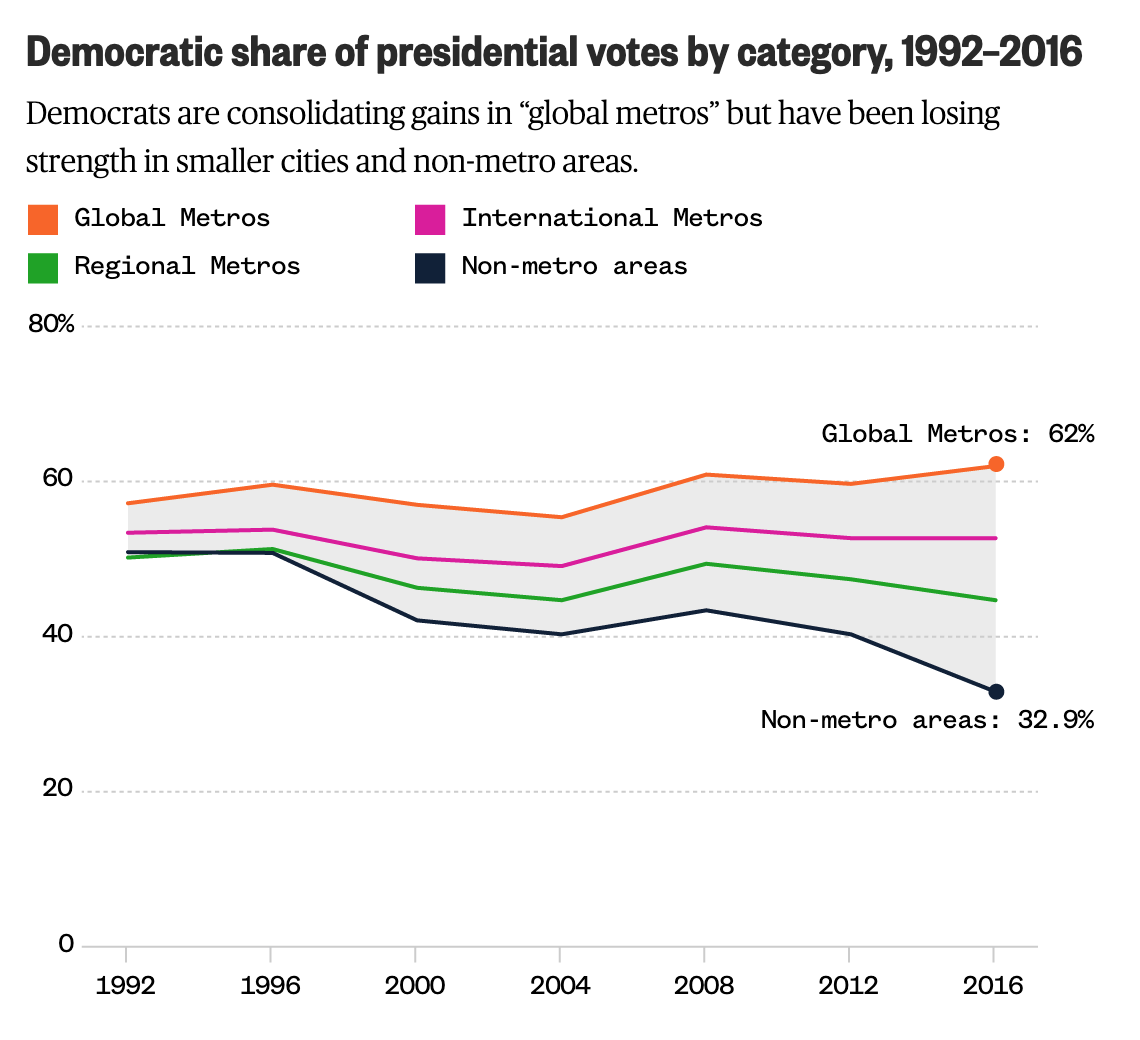
We have a line chart that shows how support for Democrats has been increasing amongst those in the global and international airport metros.
Democrats aren't performing well with the non-global and international types of metros
Democrats aren’t performing well with the non-global and international types of metros

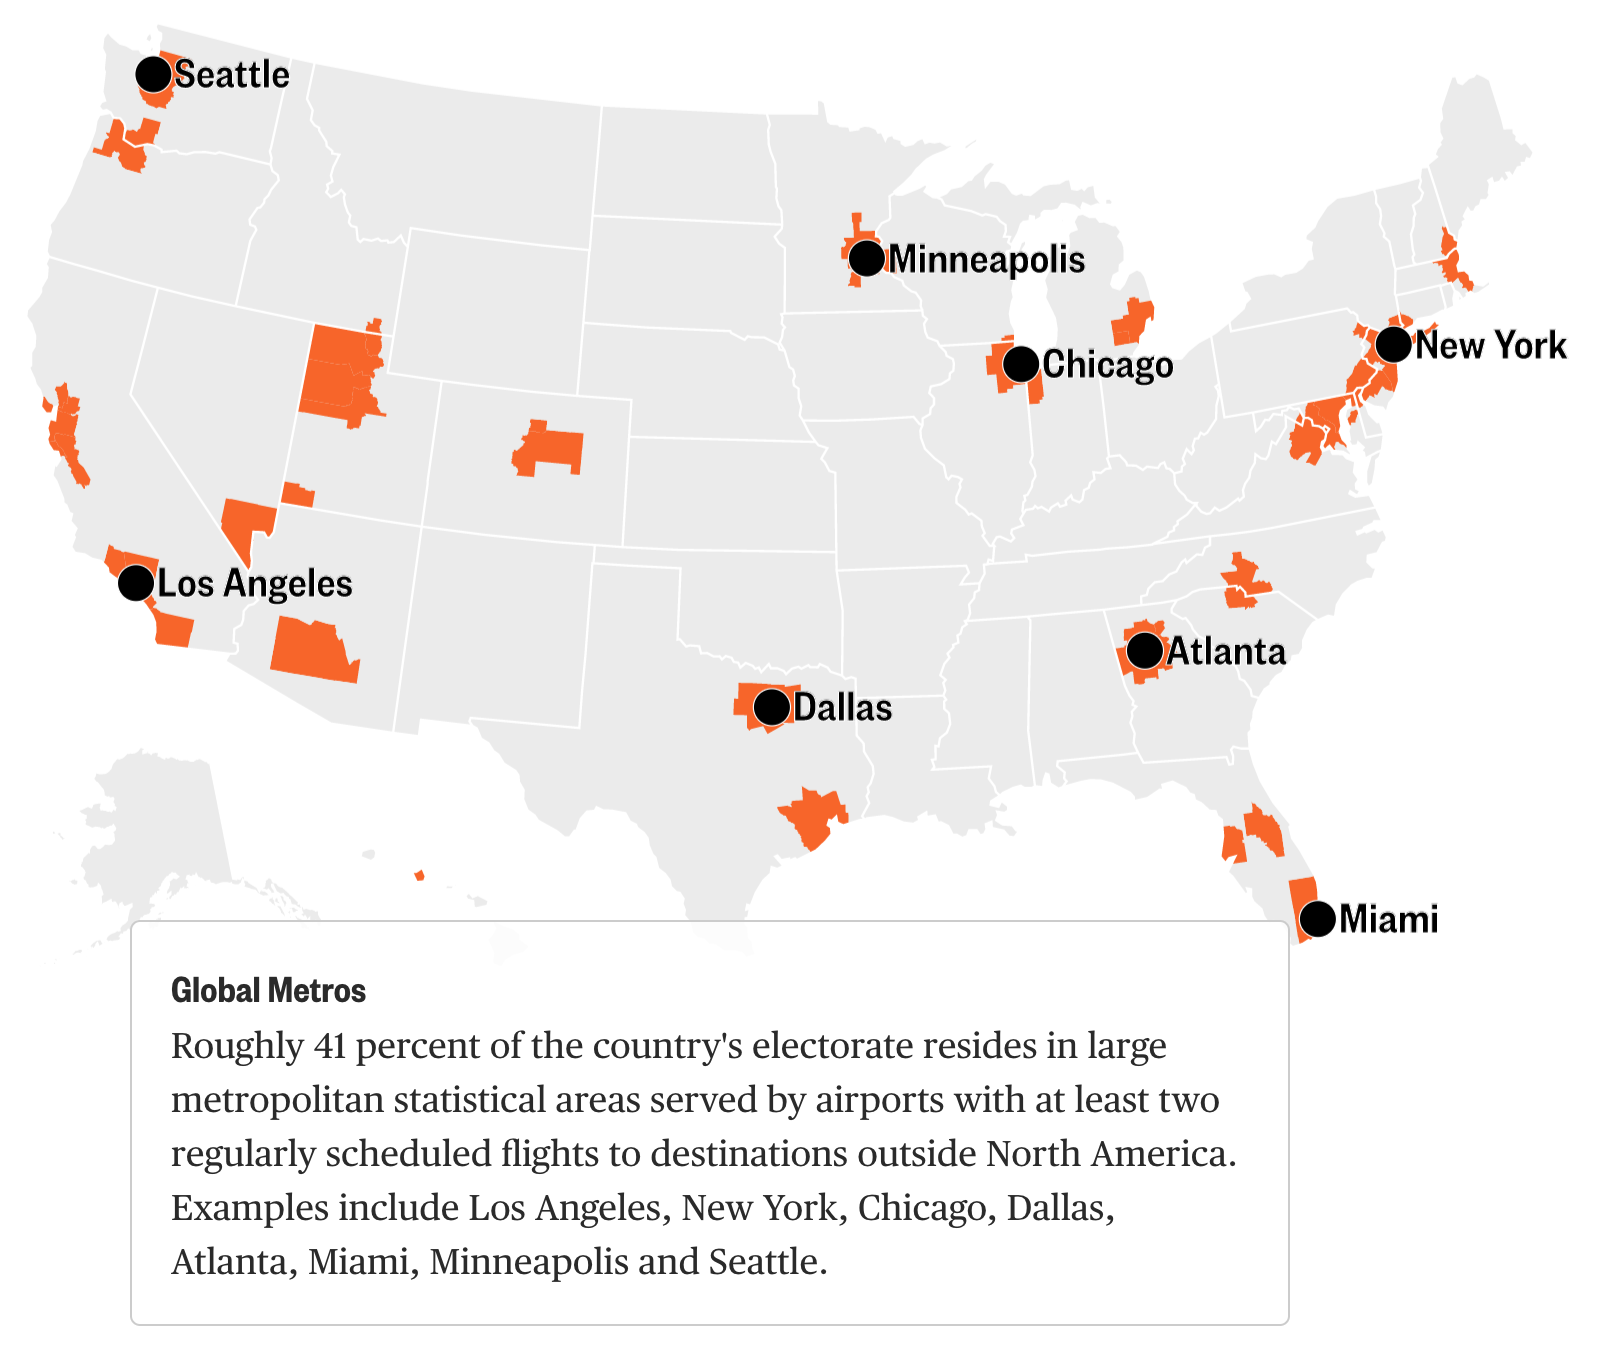
It uses four colours and I don’t necessarily love that. However, it smartly ties into an earlier graphic that did require each series to be visualised in a different colour. And so here the consistency wins out and carries on through the piece. (Though as a minor quibble I would have outlined the MSA being labelled instead of placing a dot atop the MSA.)
A lot of these global metros are in already blue states

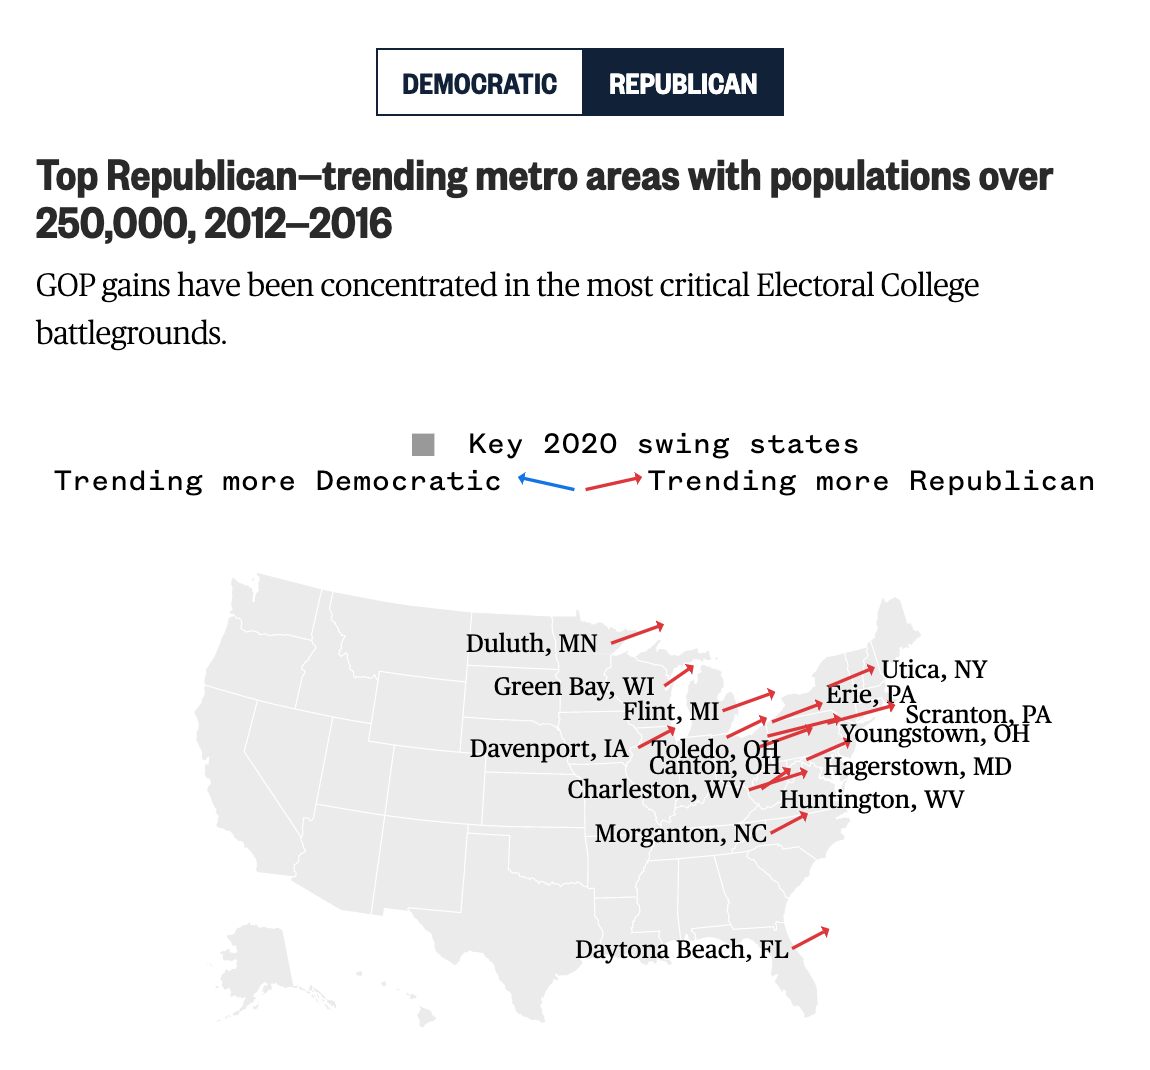
The kicker, however is one of those maps with trend arrows. It shows the increasing Republican support by an arrow anchored over the metropolitan area.
Lot of Trump support in the battleground states

The problem here is many-fold. First, the map is actually quite small in the overall piece. Whereas the earlier maps sit centred, but outside the main text block, this fits neatly within the narrow column of text (on a laptop display at least). That means that these labels are all crowded and actually make it more difficult to realise which arrow is which city. For example, which line is Canton, Ohio? Additionally with the labels, because they are set in black text and a relatively bolder face, they standout more than the red lines they seek to label. Consequently, the users’ focus falls not on the lines, but actually on the labels—the reverse of what a good graphic should do.

Second, length vs. angle. If all lines moved away from their anchor at the same angle, we could simply measure length and compare the trending support that way. However, it is clear from Duluth and Green Bay that the angles are different in addition to their sizes. So how does one interpret both variables together?

Third, I wonder if the map would not have been made more useful with some outlines or shading. I may know what the forthcoming battleground states are. And I might know where they are on a map. But Americans are notorious for being, well, not great when it comes to geography. A simple black outline of the states could have been useful, though it in this design would have conflicted with the heavy black labelling of the arrows. Or maybe a purple shading could have been used to show those states.

Overall, the piece is well worth a read and the graphics generally help tell the narrative visually. But that final graphic could have used a revision or two.

Credit for the piece goes to Jiachuan Wu and Jeremia Kimelman.

Hoyle’s House

John Bercow is no longer the British Speaker of the House. He left office Thursday. Fun fact: it is illegal for an MP to resign. Instead they are appointed to a royal office, in Bercow’s case the Royal Steward of the Manor of Northstead, that precludes them from being an elected MP. Consequently the House of Commons then had to elect a new Speaker.

For my American audience, despite the same title as Nancy Pelosi, John Bercow had a very different function and came to it in a very different fashion. First, the position is politically neutral. Whoever the House elects resigns from his or her party (along with his or her three deputies) and the political parties abide by a gentlemen’s agreement not to contest the seat in general elections. (The Tories were so displeased with Bercow they were actually contemplating running somebody in the now 12 December election to get rid of him.) Consequently, the Speaker (and his or her deputies) do note vote unless there is a tie. (Bercow actually cast the first deciding vote by a speaker since 1980 back in April.)

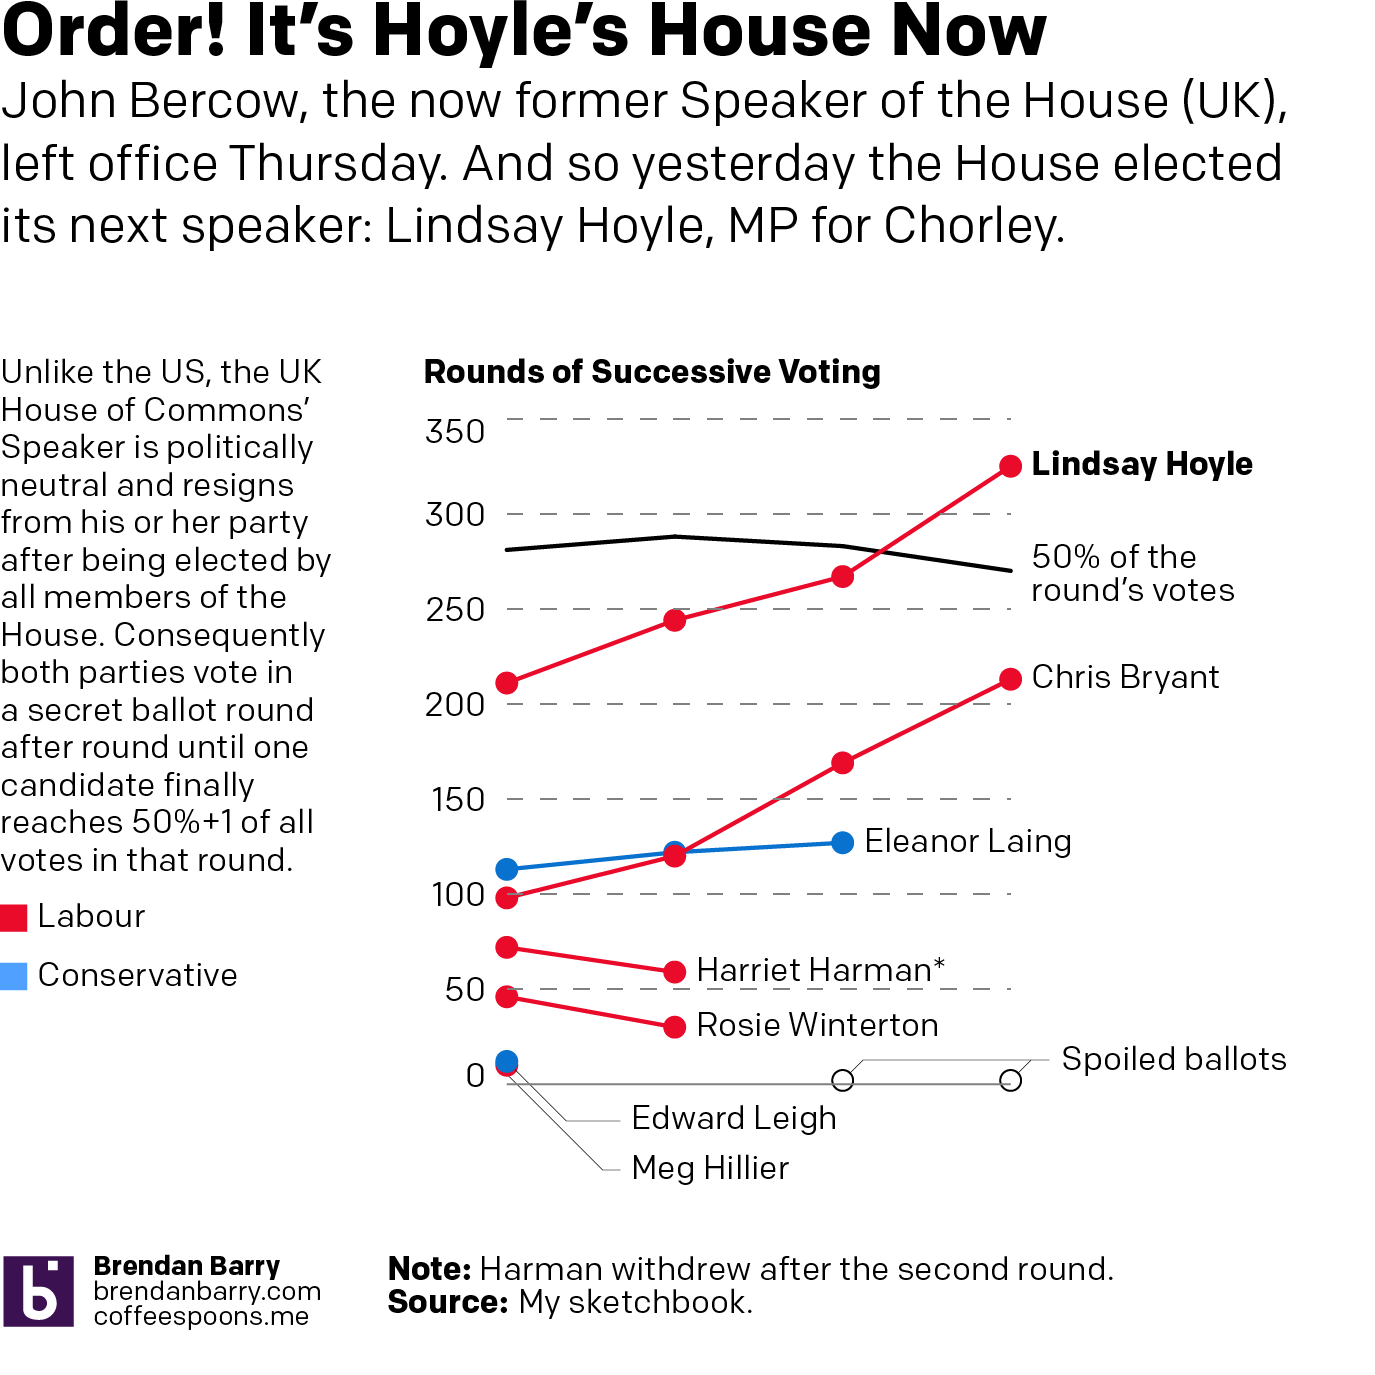
Because the position is politically neutral, all MPs vote in the election and debate is chaired by the Father of the House, the longest continuously serving MP in the House. Today that was Ken Clarke, one of the 21 MPs Boris Johnson booted from the Tory party for voting down his No Deal Brexit and who is not standing in the upcoming election. The candidates for Speaker must receive the vote of 50% of the House. And so they are eliminated in successive votes until someone reaches 50% of the total votes cast, though not all MPs cast votes, since some have already started campaigning. (Today there were 562, 575, 565, 540 votes per round.)

Notably, today’s vote occurs just days before Parliament dissolves prior to the 12 December election. Bercow, who chose to retire on 31 October, essentially ensured that the next Parliament will have a Speaker not chosen what could well likely be a pro-No Deal Brexit, one of the things which the Tories have against him.

So all that said, who won? Well I made a graphic for that.

A very different accent will occupy the big green chair.

Credit for the piece goes to me.

Americans Can’t Kick the Auto Habit

After looking this week at the growth of the physical size of cities due to improvements in transport technologies, the increasing density of cities, and then the contribution of automobile (especially personal cars) to carbon dioxide emissions, today we look at a piece from the Transport Politic comparing US and French mass transit ridership to see whether the recent decline in US ridership is inevitable or a choice made by consumers and policymakers. Spoiler: it’s not inevitable.

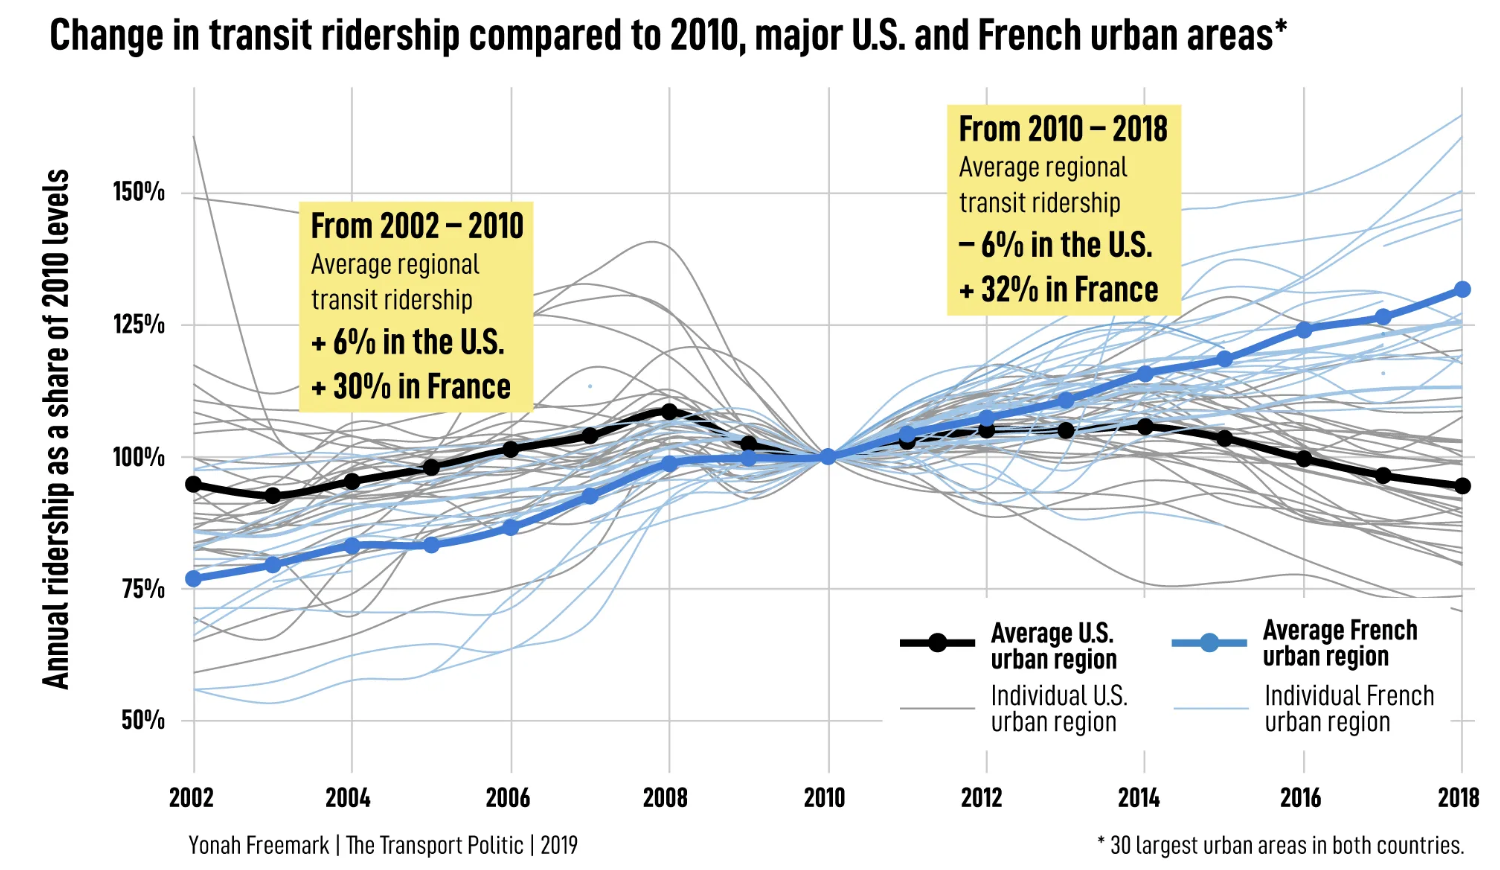
The article makes use of a few graphics and an interactive component. The lead-in graphic is a nice line chart that runs with the spaghetti nature of the graphic: lots of line but only two are really highlighted.

The French are definitely better than the US here.

Light grey lines and light blue lines encode the US and French cities under study. But only the lines representing the averages of both the US and France are darkly coloured and in a thicker stroke to stand out from the rest. Normally I would not prefer the minimum of the y-axis being 50%, but here the baseline is actually 100% so the chart really works well. And interestingly it shows that prior to the Great Recession, the United States was doing better than France in adoption of mass transit, relative to 2010 numbers.

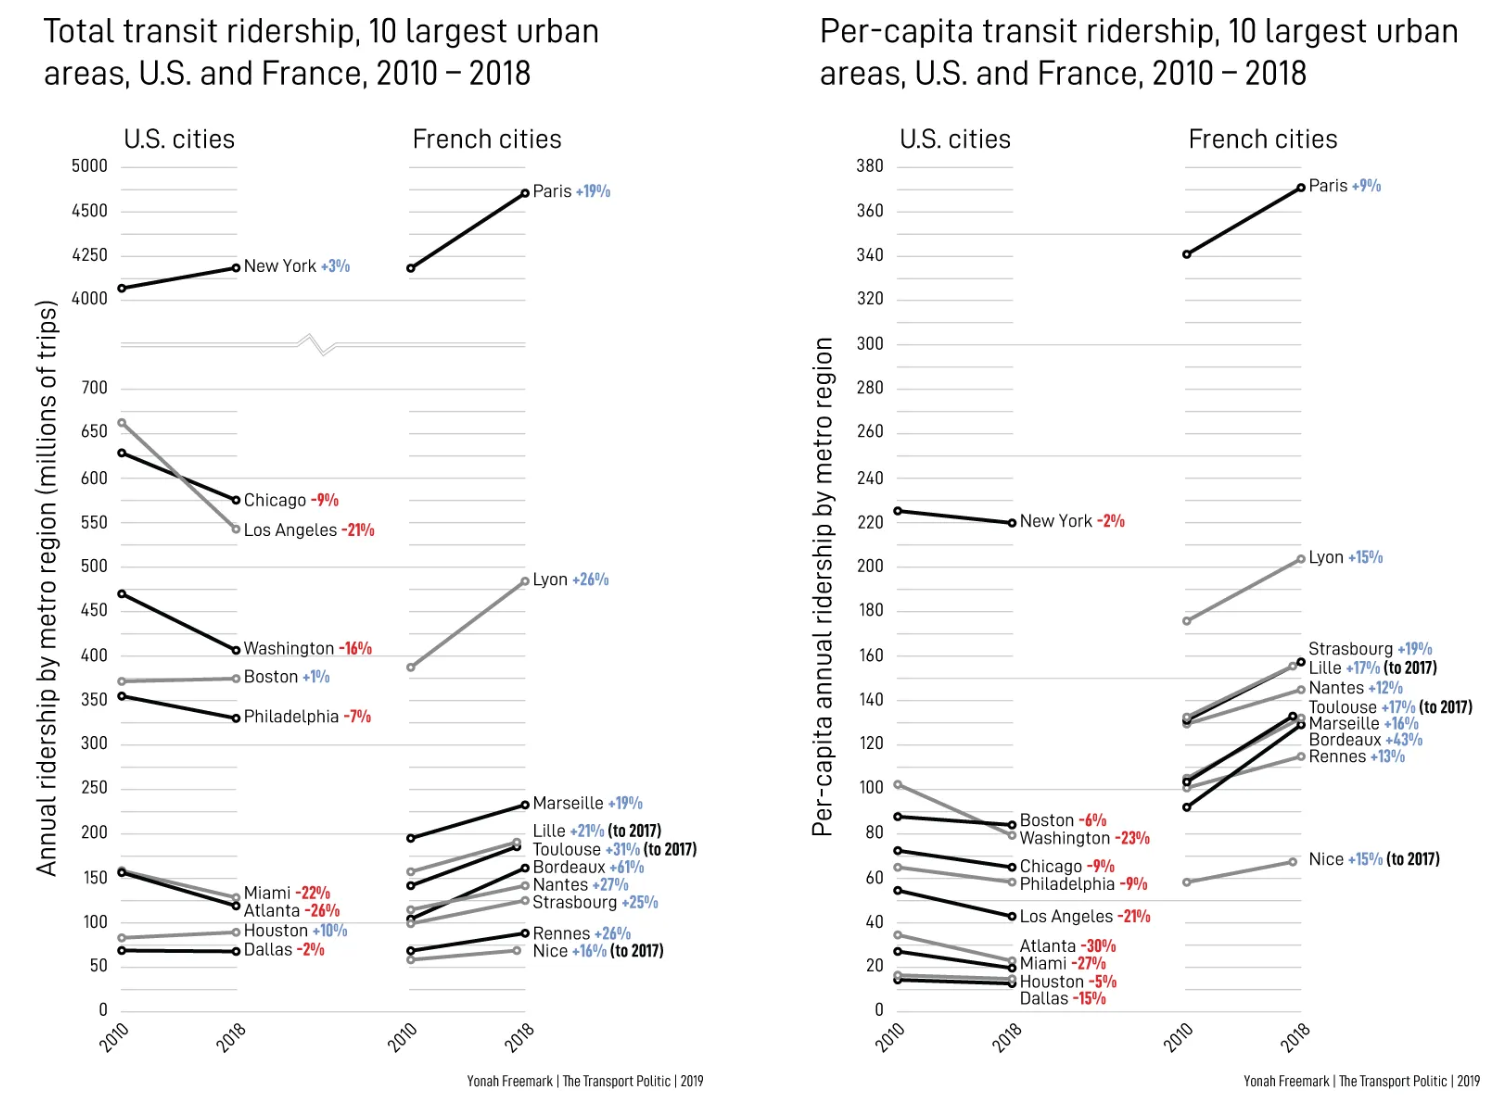
But then when you directly compare 2010 to 2018 for various US and French cities, you get an even better chart. Also you see that French cities reclaim the lead in transit growth.

A lot of declines on this side of the pond.

These two static graphics, which can each be clicked to view larger, do a really great job of cutting through what some might call noise of the intervening years. I do like, much like yesterday’s post, the comparison of total or aggregate ridership to per capita numbers. It shows how even though New York’s total ridership has increased, the population has increased faster than the ridership numbers and so per capita ridership has declined. And of course as yesterday’s post examined, in the States the key to fighting climate change is reducing the number of people driving.

What I cannot quite figure out from the graphic is what the colouration of the lines mean. I thought that perhaps the black vs. grey lines meant the largest cities, but then LA would be black. Maybe for the steepest declines, but no, because both LA and Boston are grey. I also thought the grey lines might be used when black lines overlap to aid clarity, but then why is Boston in grey? Regardless, I like the choice of the overall form.

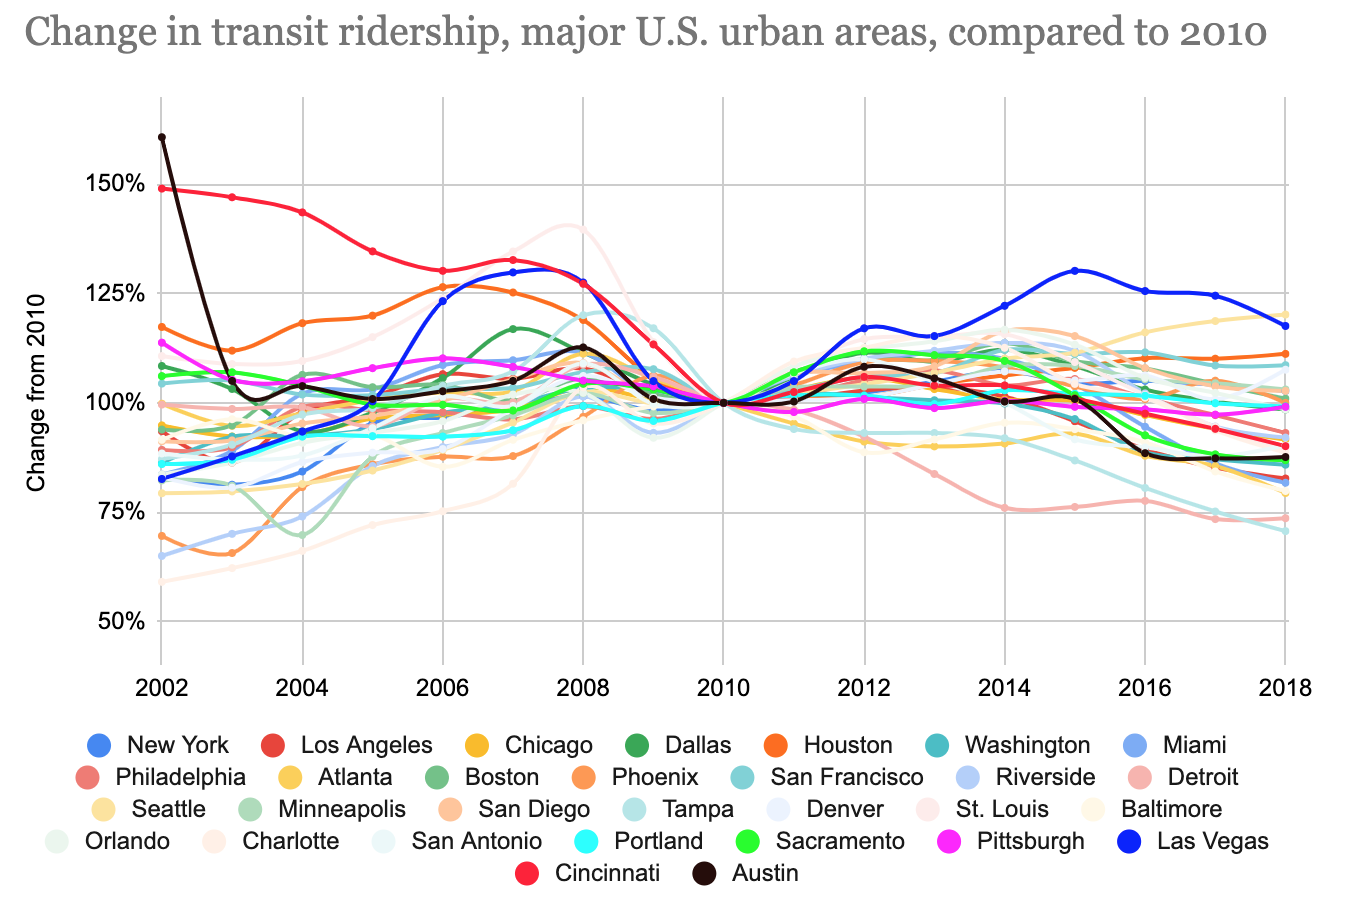
But where things go really downhill are the interactive charts.

Just what?
Just what?

Talk about unintelligible spaghetti charts. So the good. The designer kept the baseline at 100% and set the min and max around that. After that it’s a mess. Even if the colours all default to the rainbow, the ability to select and isolate a particular city would be incredibly valuable to the user. Unfortunately selecting a city does no such thing. All the other cities remain coloured, and sometimes layered atop the selected city.

I would have thrown the unselected cities into the greyscale and let the selected city rise to the top layer and remain in its colour. Let it be the focus of the user’s attention.

Or the designer could have kept to the idea in the first graphic and coloured American cities grey and French cities light blue and then let the user select one from among the set and compare that to the overall greyed/blued masses and the US and French averages.

Overall, it wasn’t a bad piece. But that final interactive bit was questionable. Unfortunately the piece started strong and ended weak, when the reverse would have been preferable.

Credit for the piece goes to Yonah Freemark.

Auto Emissions Stuck in High Gear

The last two days we looked at densification in cities and how the physical size of cities grew in response to the development of transport technologies, most notably the automobile. Today we look at a New York Times article showing the growth of automobile emissions and the problem they pose for combating the greenhouse gas side of climate change.

The article is well worth a read. It shows just how problematic the auto-centric American culture is to the goal of combating climate change. The key paragraph for me occurs towards the end of the article:

Meaningfully lowering emissions from driving requires both technological and behavioral change, said Deb Niemeier, a professor of civil and environmental engineering at the University of Maryland. Fundamentally, you need to make vehicles pollute less, make people drive less, or both, she said.

Of course the key to that is probably in the range of both.

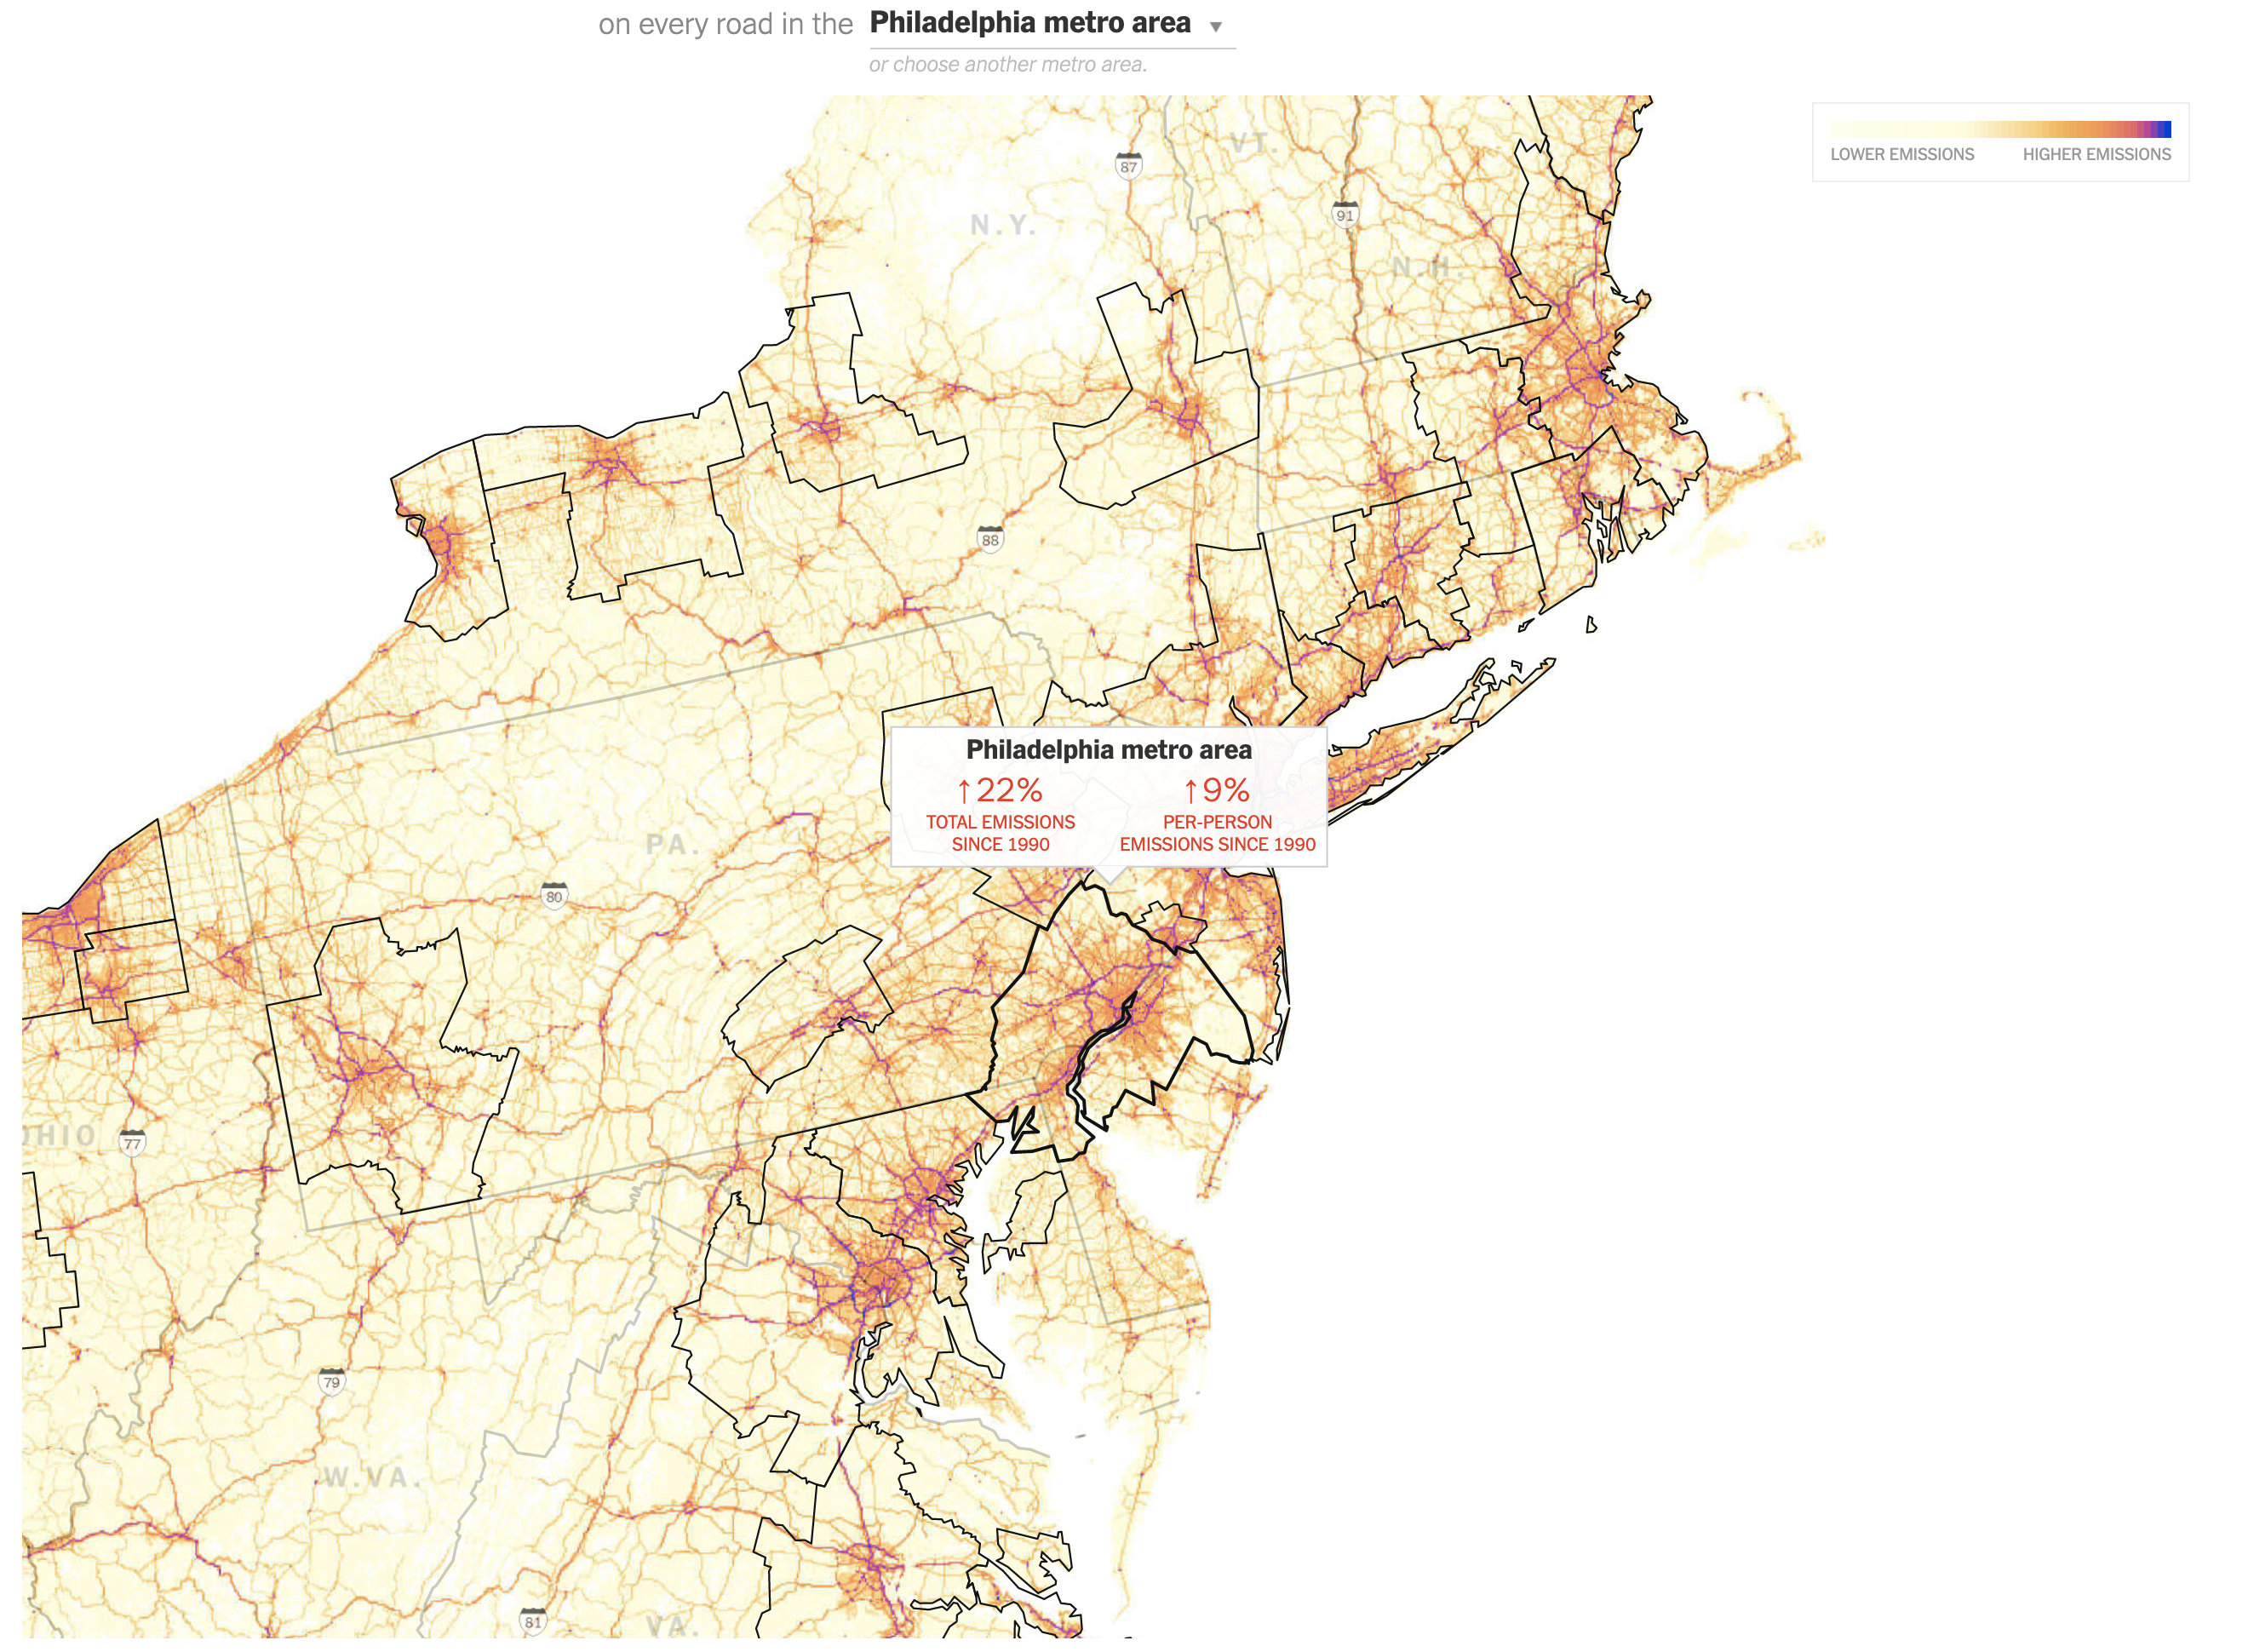
The star of the piece is the map showing the carbon dioxide emissions on the roads from passenger and freight traffic. Spoiler: not good.

From this I blame the Schuylkill, Rte 202, the Blue Route, I-95, and just all the highways

Each MSA is outlined in black and is selectable. The designers chose well by setting the state borders in a light grey to differentiate them from when the MSA crosses state lines, as the Philadelphia one does, encompassing parts of Pennsylvania, New Jersey, Delaware, and Maryland. A slight opacity appears when the user mouses over the MSA. Additionally a little box remains up once the MSA is selected to show the region’s key datapoints: the aggregate increase and the per capita increase. Again, for Philly, not good. But it could be worse. Phoenix, which surpassed Philadelphia proper in population, has seen its total emissions grow 291%, its per capita growth at 86%. My only gripe is that I wish I could see the entire US map in one view.

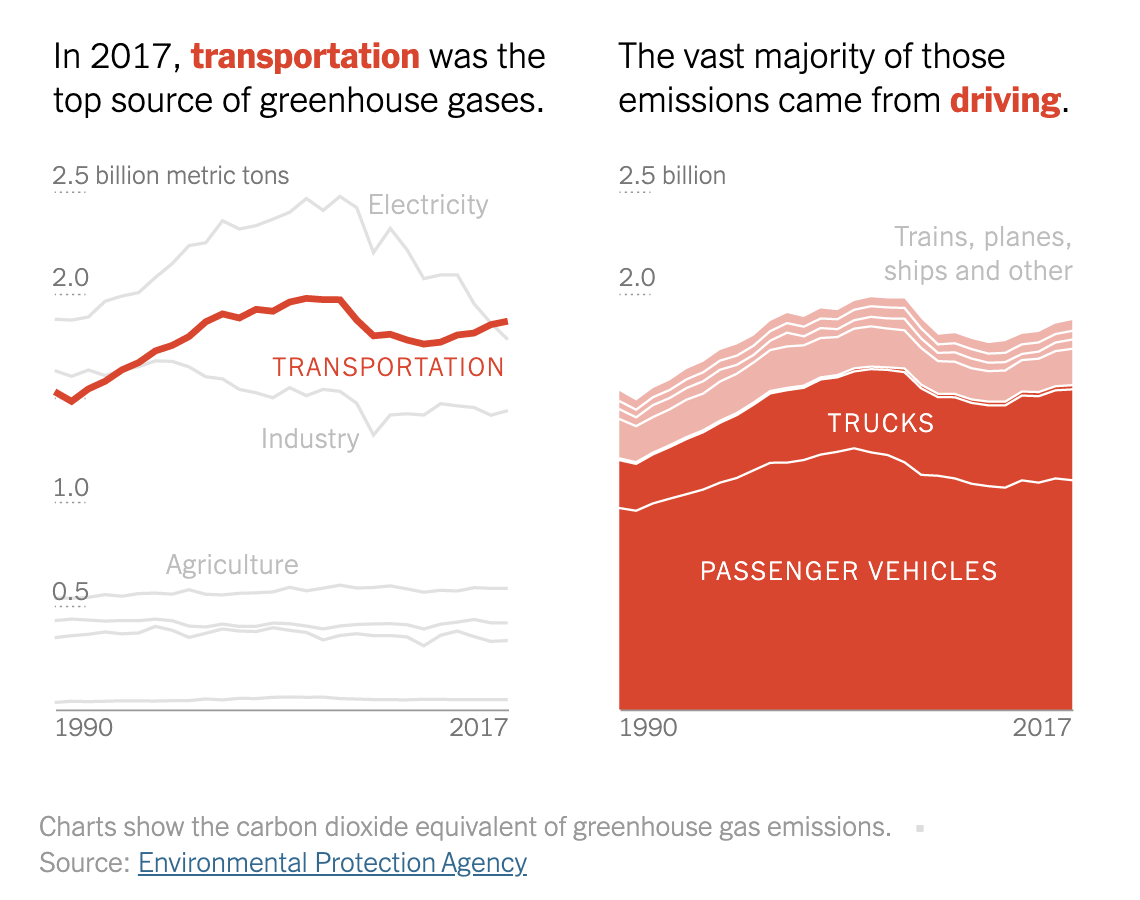
The piece also includes some nice charts showing how automobile emissions compare to other sources. Yet another spoiler: not good.

I've got it: wind-powered cars with solar panels on the bonnet.
I’ve got it: wind-powered cars with solar panels on the bonnet.

Since 1990, automobile emissions have surpassed both industry emissions and more recently electrical generation emissions (think shuttered coal plants). Here what I would have really enjoyed is for the share of auto emissions to be treated like that share of total emissions. That is, the line chart does a great job showing how auto emissions have surpassed all other sources. But the stacked chart does not do as great a job. The user can sort of see how passenger vehicles have plateaued, but have yet to decline whereas lorries have increased in recent years. (I would suspect due to increased deliveries of online-ordered goods, but that is pure speculation.) But a line chart would show that a little bit more clearly.

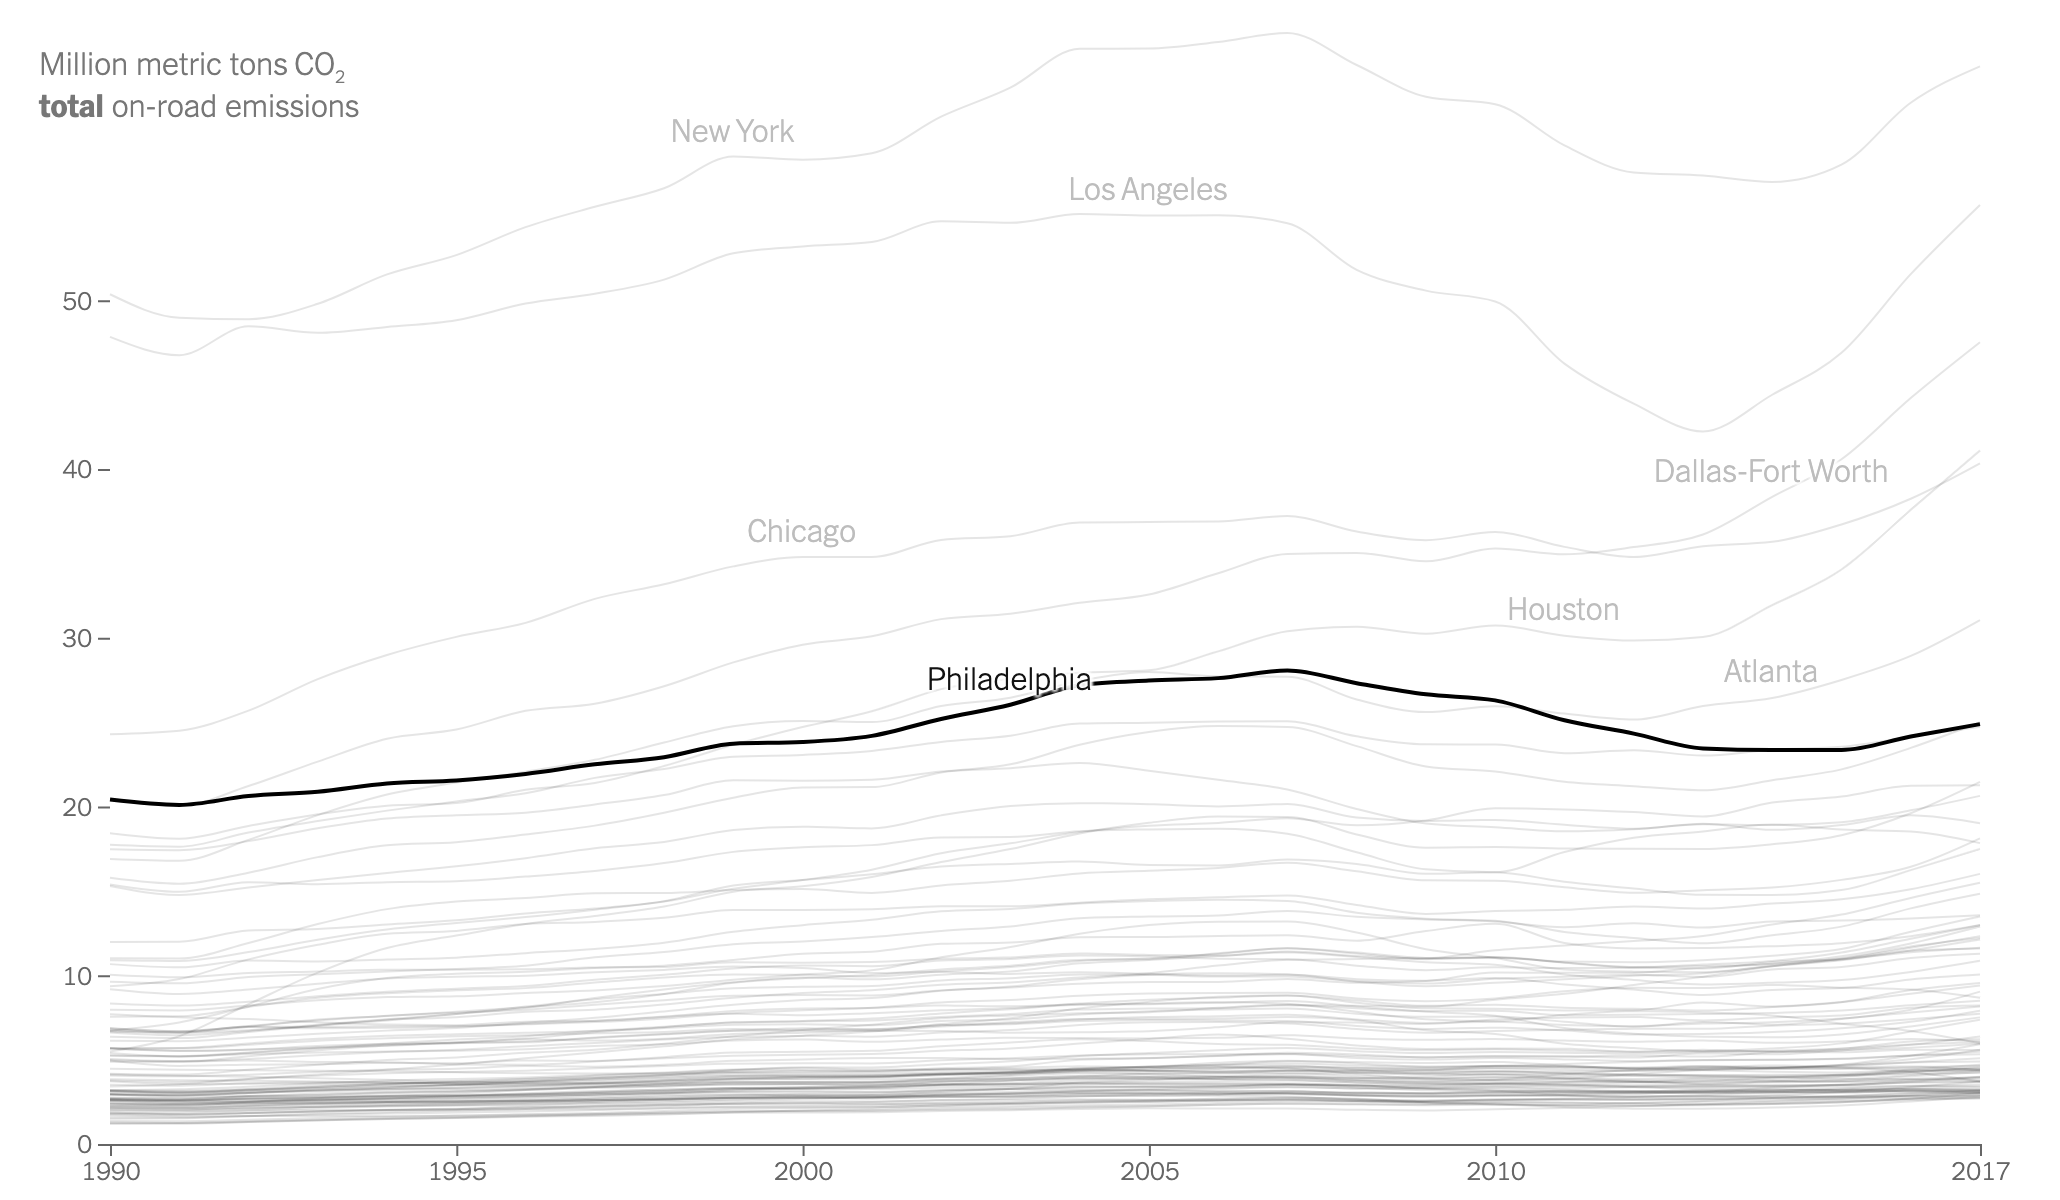
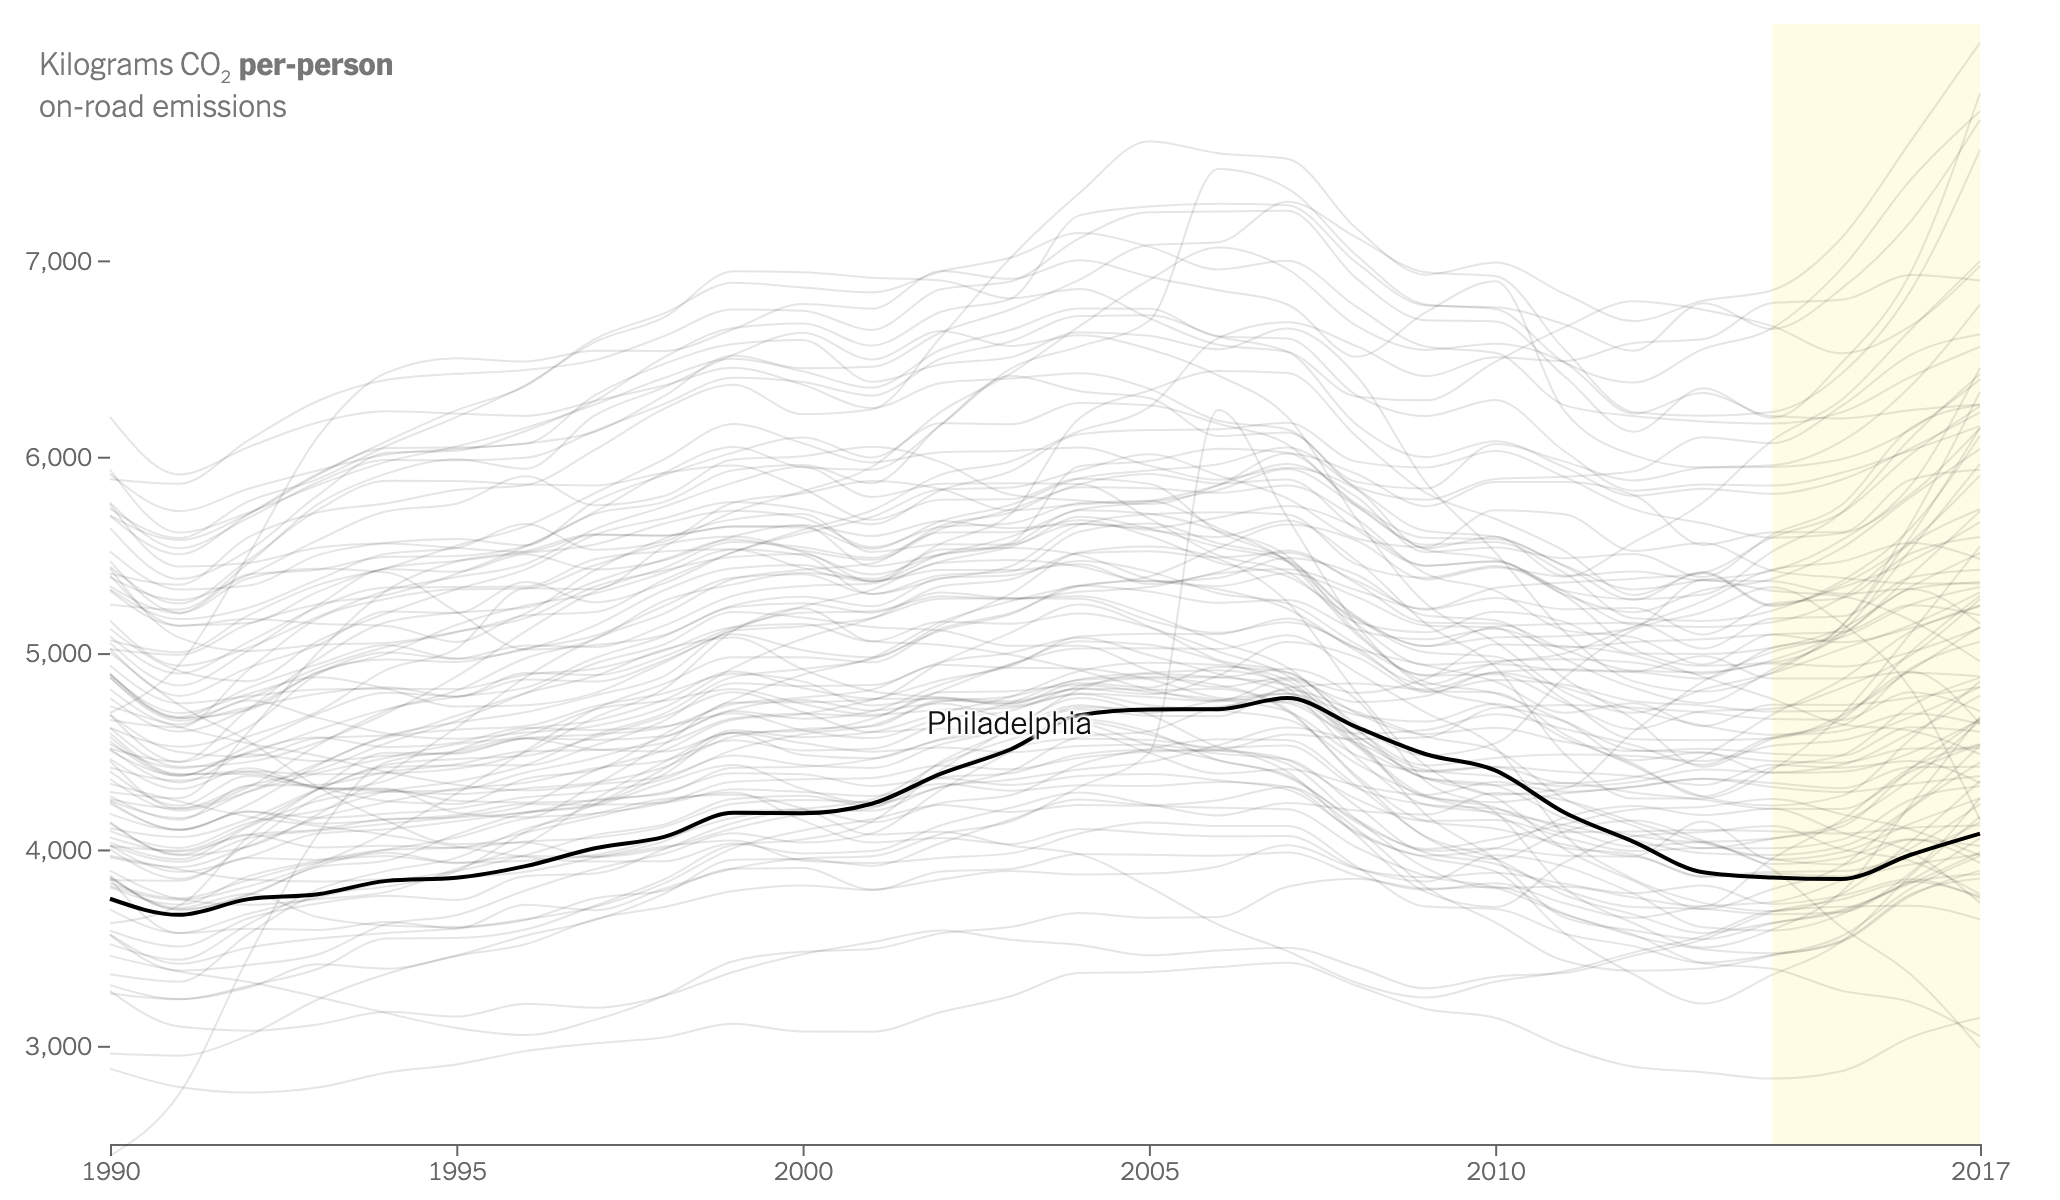
Finally, we have a larger line chart that plots each city’s emissions. As with the map, the key thing here is the aggregate vs. per capita numbers. When one continues to scroll through, the lines all change.

Lots of people means lots of emissions.
There's driving in the Philadelphia area, but it's not as bad as it could be.
There’s driving in the Philadelphia area, but it’s not as bad as it could be.

Very quickly one can see how large cities like New York have large aggregate emissions because millions of people live there. But then at a per capita level, the less dense, more sprawl-y cities tend to shoot up the list as they are generally more car dependent.

Credit for the piece goes to Nadja Popovich and Denise Lu.

I Have an App for That Too

Well, everyone, we made it to Friday. So let’s all reflect on how many things we did on our mobile phones this week. xkcd did. And it’s fairly accurate. Though personally, I would only add that I did not quite use my mobile for a TV remote. Unless you count Chromecasting. In that case I did that too.

What about boarding passes?

If I have to offer a critique, it’s that it makes smart use of a stacked bar chart. I normally do not care for them, but it works well if you are only stacking two different series in opposition to each other.

Credit for the piece goes to Randall Munroe.

How Worldly Is the World Series?

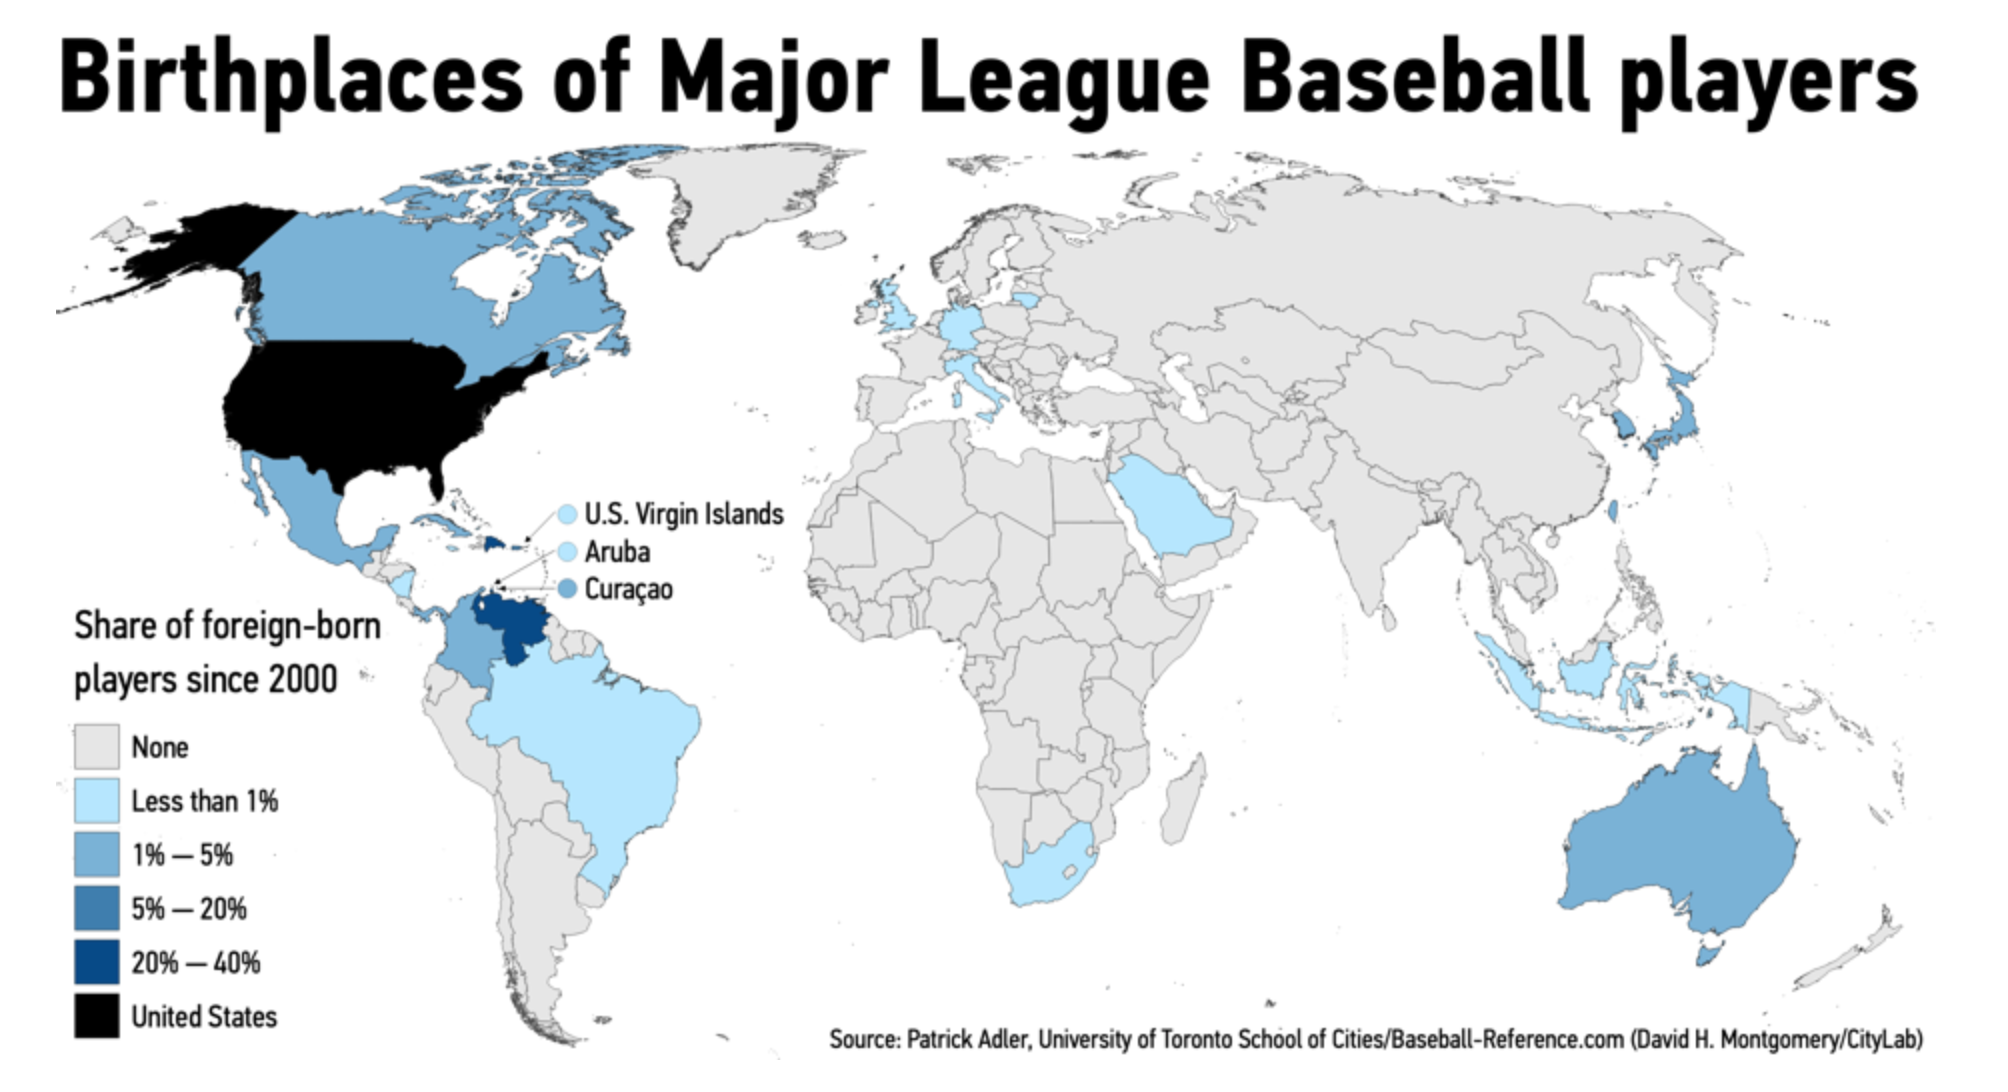
The World Series began Tuesday night. But, as many people reading this blog will know, baseball is not exactly a global sport. But is it really? CityLab looked at the origin of Major League Baseball players and it turns out that almost 30% of the players today are from outside the United States. They have a number of charts and graphics that explore the places of birth of ball players. But one of the things I learned is just how many players hail from the Dominican Republic—since 2000, 12% of all players.

There are quite a few players from countries around the Caribbean.

The choropleth here is an interesting choice. It’s a default choice, so I understand it. But when so many countries that are being highlighted are small islands in the Caribbean, a geographically accurate map might not be the ideal choice. Really, this map highlights from just how few countries MLB ball players originate.

Fortunately the other graphics work really well. We get bar charts about which cities provide MLB rosters. But the one I really enjoy is where they account for the overall size of cities and see which cities, for every 100,000 people, provide the most ballplayers.

One of the other things I want to pick on, however, is the inclusion of Puerto Rico. In the dataset, the designers included it as a foreign country. When, you know, it’s part of the United States.

Credit for the piece goes to David H. Montgomery.

Pub Trivia Scores—The Ryan’s Wedding Version

So another Wednesday, another pub trivia night. But two weekends ago, I attended the wedding of a good mate of mine down in Austin, Texas. And at his rehearsal/welcome dinner, he and his now wife had a trivia game. How well did their guests know them?

Turns out my friends and I, not so much. And I can prove it, because I documented our score after every round in my sketchbook.

Somewhere towards the middle we just started picking the most ridiculous answers.

Credit for this one is mine.

Canadian Election Results

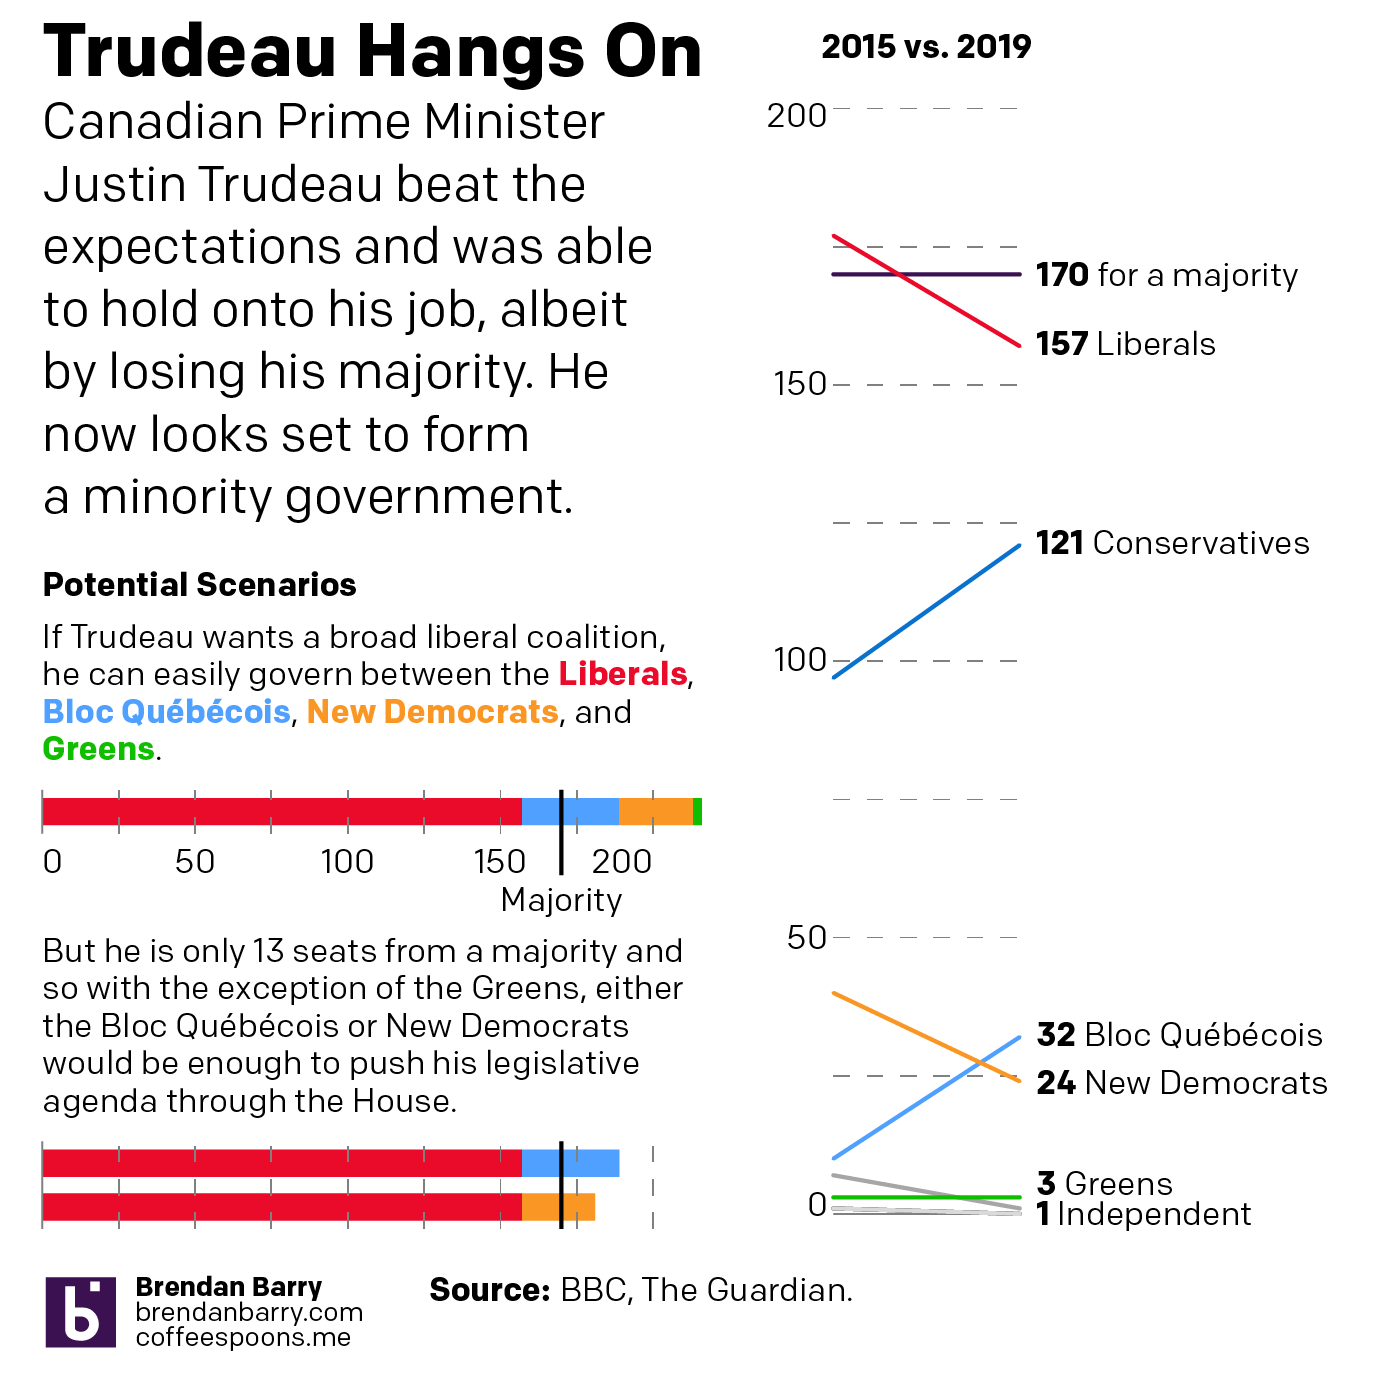
Yesterday Canada went to the polls for the 43rd time. Their prime minister, Justin Trudeau, has had a bad run of it the last year or so. He’s had some frivolous scandals with wearing questionable fashion choices to some more serious scandals about how he chose to colour his face in his youth to arguably the most serious scandal where an investigation concluded improperly attempted to influence a criminal investigation for political gain. (Sound familiar, American readers?) Consequently, there was some chatter about whether he would lose to the Conservatives.

But nope, Trudeau held on.

So this morning I charted some of the results. It was a bad night for Trudeau, but not nearly as bad as it could have been. He remains in power, albeit head of a minority government.

That's a steep drop in seats, but it could have been worse
That’s a steep drop in seats, but it could have been worse

Credit for the piece goes to me.

The Vaping Outbreak Spreads

And now with more deaths.

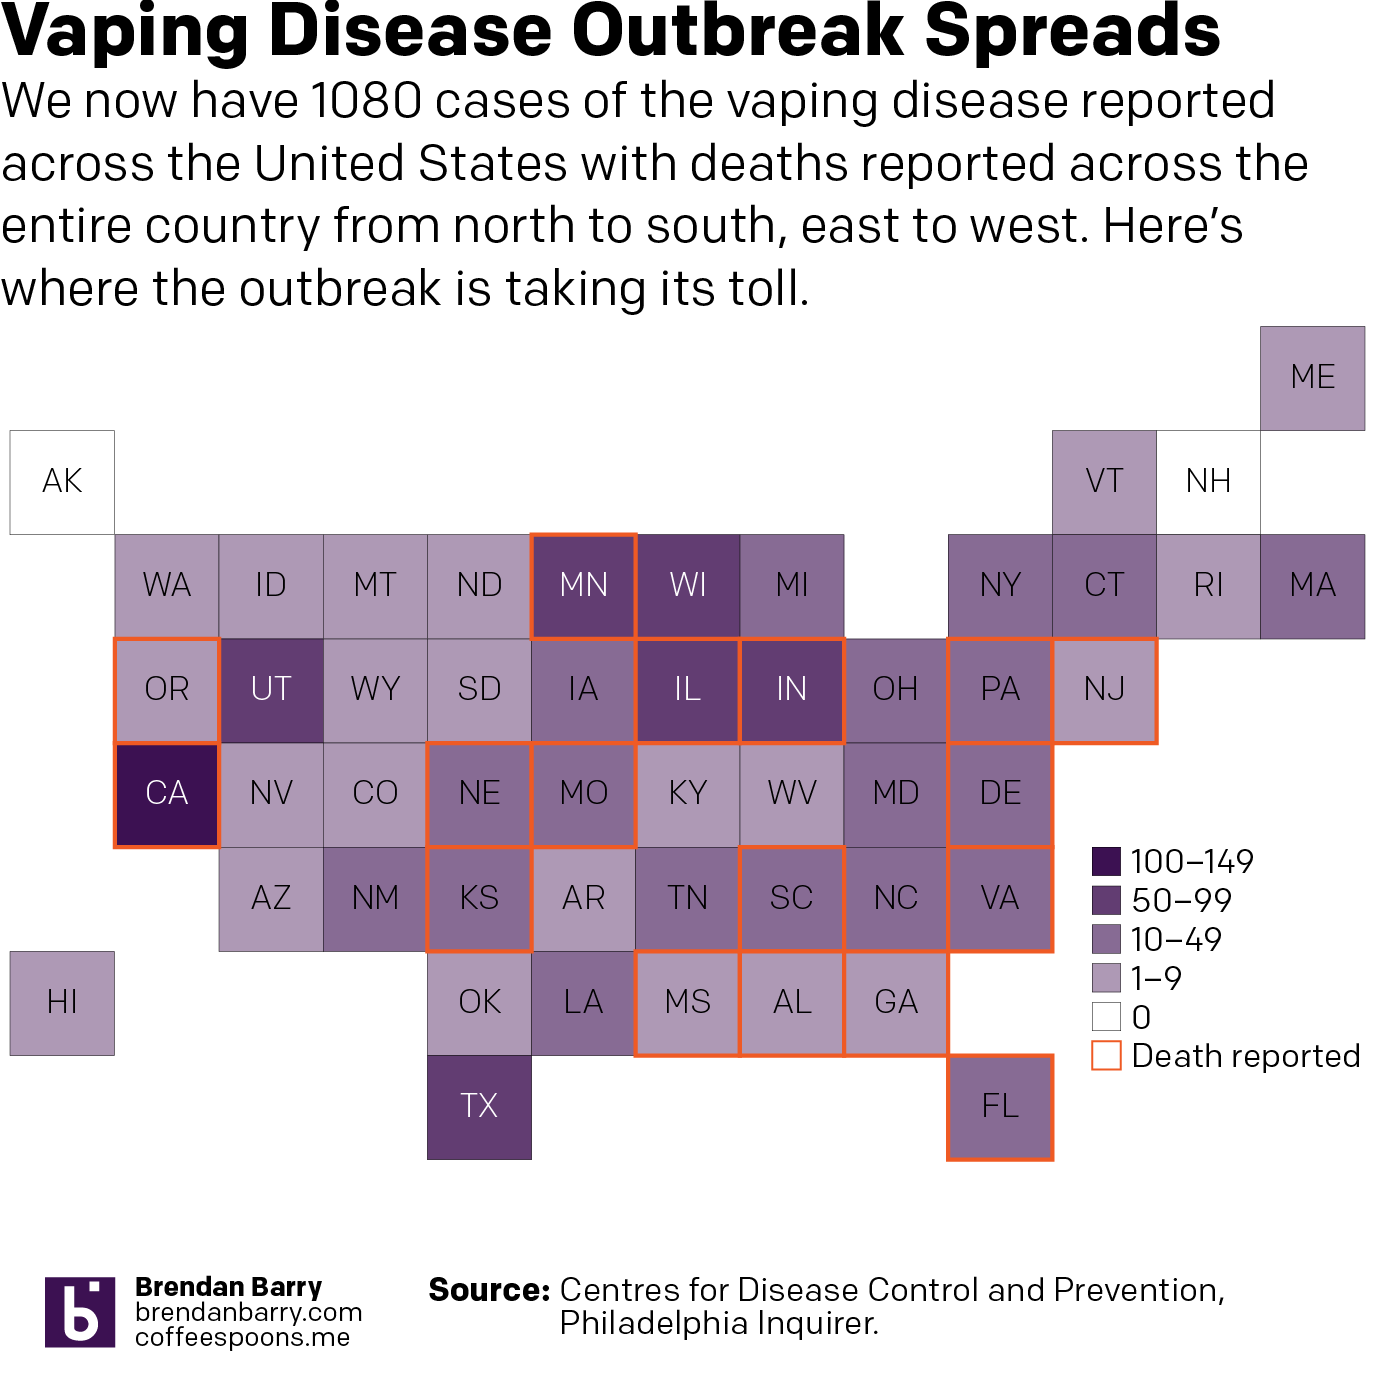
On Friday, Pennsylvania reported its first death from the vaping disease spreading across the country. So I decided I would take a moment to update the map I made a month ago charting the outbreak. Then, the CDC had tallied 450 cases. Now we are at 1080. And whereas last time New England, parts of the deep South, and the Southwest were untouched, now the disease is everywhere but New Hampshire and Alaska.

But we are starting to see a pattern in a clustering of high numbers of cases around Lake Michigan and the Upper Midwest. Though I should point out these bin breakdowns come from the CDC. They did not provide more granular data.

Now with deaths in Pennsylvania.

Credit for this piece goes to me.

Brexit Crazyness Continues

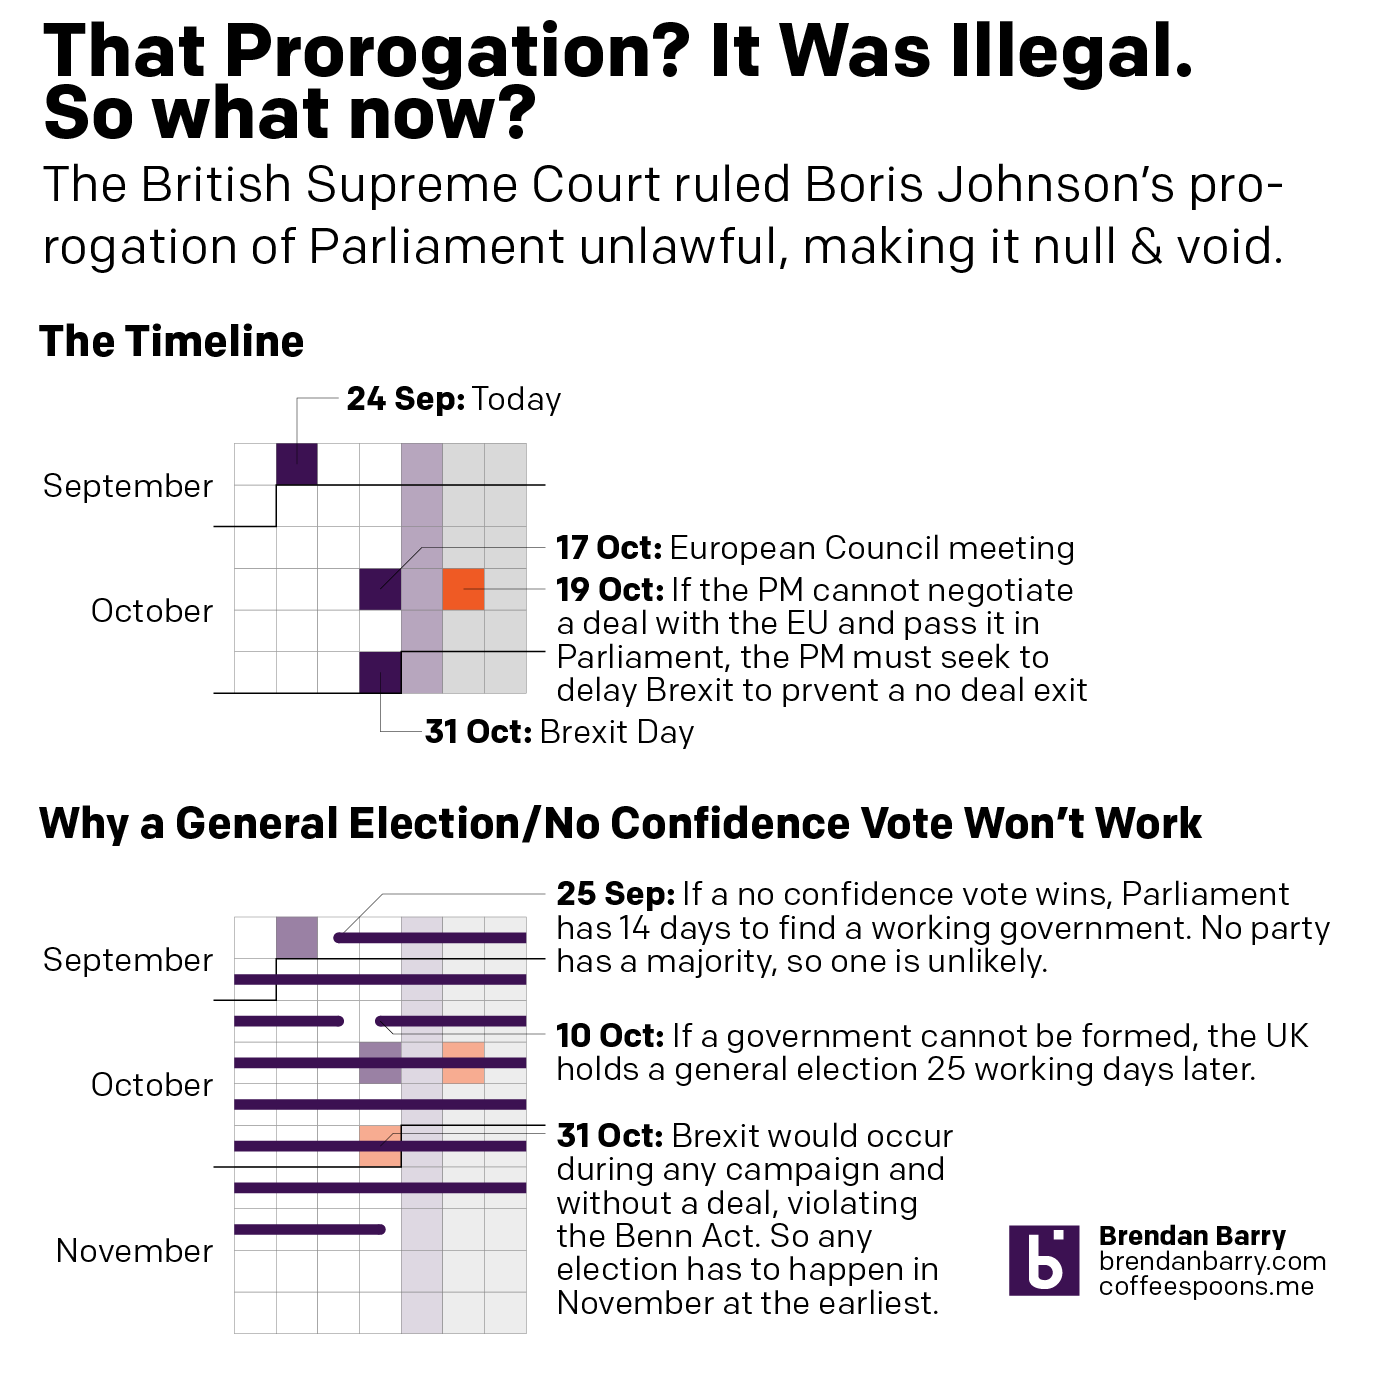
The British Supreme Court ruled today that Boris Johnson unlawfully advised the Queen to prorogue Parliament. And because the advice was unlawful, the act was therefore unlawful. And because the act was unlawful, the effects of said act were unlawful. And because the effects were unlawful, said effects are null and void. So, you know, prorogation never happened.

So the Prime Minister has misled the Queen. He has failed to pass all but one bill in Parliament (it was a bill for the restoration of the Palace of Westminster totally unrelated to Brexit). He lost three seats, one via a by-election and two by defecting MPs. And then he purged 21 MPs from his party to completely obliterate his working majority. In any other year, this would be cause for the immediate resignation of the Prime Minister. Instead he is sticking around in New York to give a speech about, what else, Brexit, before flying back to London tonight (Eastern US time).

So what’s next? Who really knows. This has never before happened in the history of the United Kingdom. But one possible option is that the opposition parties may hold a no confidence vote. But there will be significant pressure against that, because, as my graphic shows, any election that would likely result, would mean Brexit happening with Parliament dissolved. And that would, ahem, defeat the entire purpose of preventing a No Deal Brexit. Consequently, a no confidence vote or general election is unlikely. (Unless, the opposition and Tory rebels can agree to a non-Jeremy Corbyn caretake prime minister, e.g. Ken Clarke or Margaret Beckett.)

Omnishambles. Even Iannucci couldn't have made this stuff up.
Omnishambles. Even Iannucci couldn’t have made this stuff up.

Regardless, get ready for a crazy day of Parliamentary procedure tomorrow.