Another day in Philadelphia, another post of Philly data visualisation work. Here we have a piece from 2015 that was updated earlier this spring. It looks at overdose rates in the Philadelphia region, including parts of New Jersey. It does include a map, because most pieces like this typically do. However, what I really find interesting about the piece is its use of small multiple line charts below to take a look at particular counties.
The piece overall is not bad, and the map is actually fairly useful in showing the differences between Jersey and Philadelphia (although why New Jersey is outlined in black and the Philly suburban counties are not I do not know). But I want to take a look at the small multiples of the piece, screenshot below.
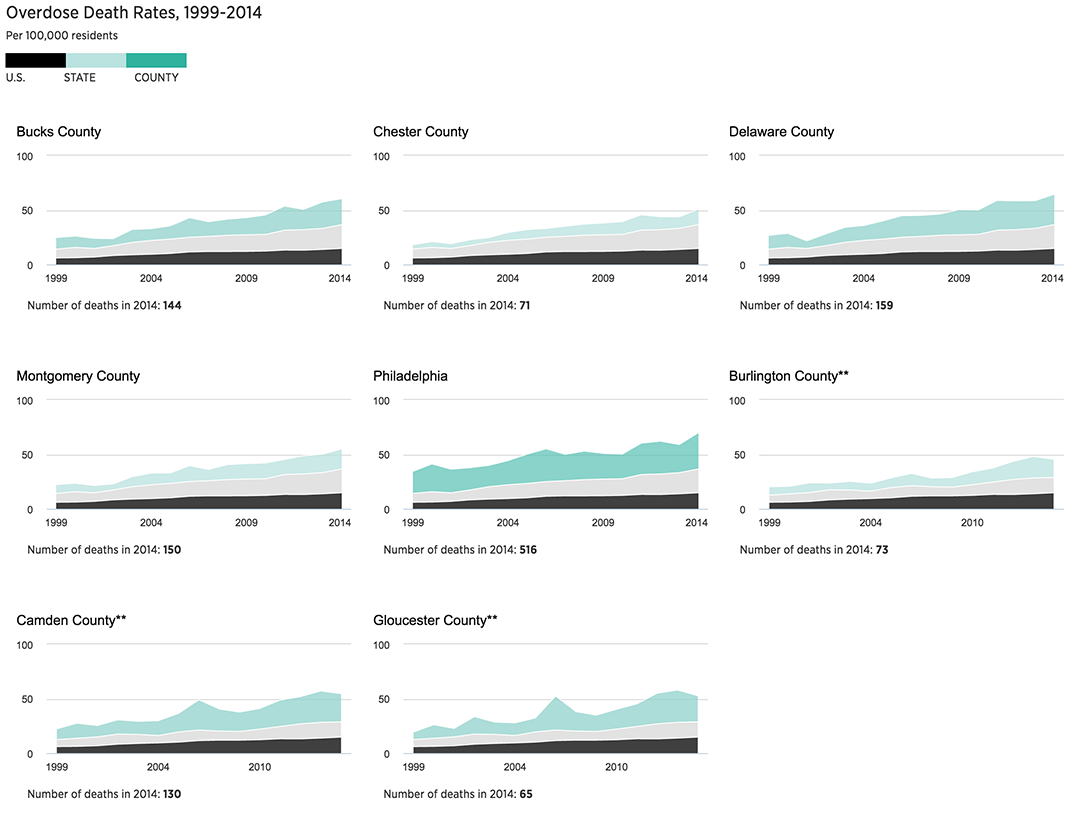
You can see an interesting decision in the choice of stacked line charts. Typically one would compare death rates like for like and see whether a county is above, below, or comparable to the state, local, or national averages. But combining the three gives a misleading look at the specific counties and forces the user to mentally disentangle the graphic. I probably would have separated them into three separate lines. And even then, because of the focus on the counties, I would have shifted the colour focus to the specific counties and away from the black lines for the national average. The black is drawing more attention to the US line than to the county line.
Credit for the piece goes to Don Sapatkin.
Leave a Reply
You must be logged in to post a comment.