America’s Most Popular Beers—And Almost All Are Crappy

Or so says Adweek. I would heartily disagree about their inclusion of Yuengling in their group of crappy. Though the other nineteen, yeah, I would tend to agree. Regardless, the infographic that sparked the Adweek post is quite blah. I do enjoy the illustrations of the bottles and labels, but the data visualisation below is weak.

The 20 best in table form

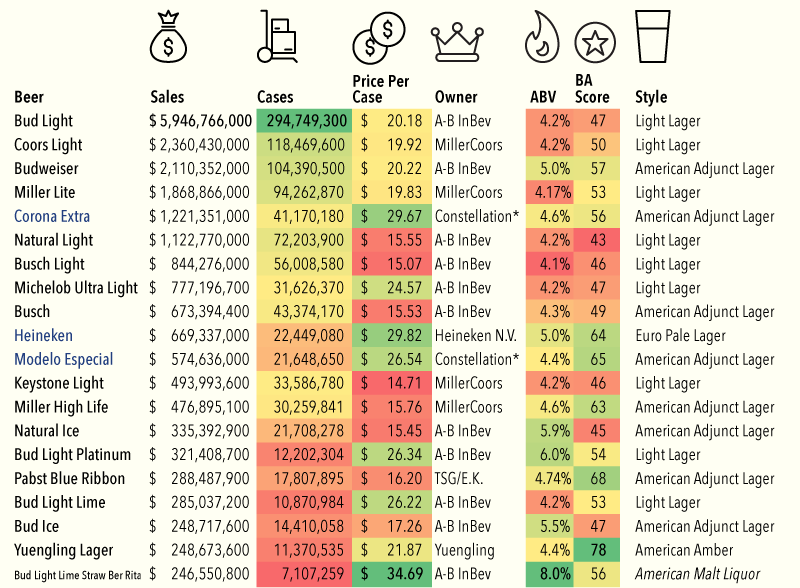
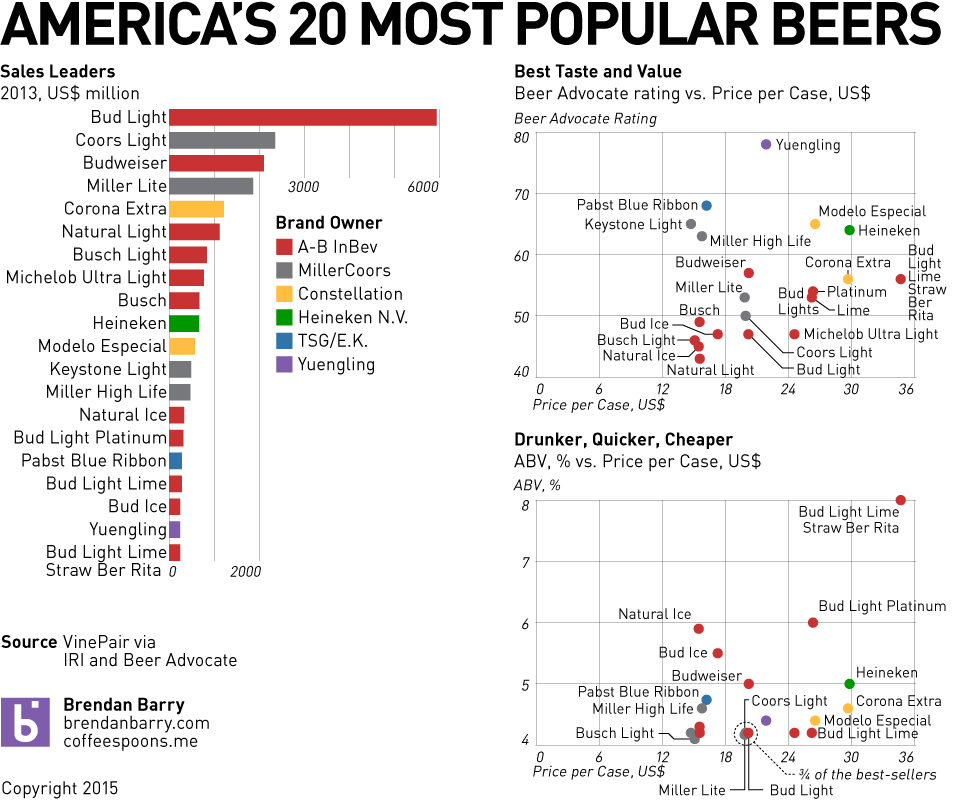
So because of Yuengling, I decided to take a quick stab at ways to improve it. My first finding in the data was that the different brands were assigned a Beer Advocate rating, and Yuengling rated the highest—though not terribly high overall. Still, unless you are looking to get drunk, it does offer a good taste/cost value among the consideration set.

Visualising some of the data

Credit for the infographic goes to VinePair.

Chipotle and Calories

In my office, Chipotle is a popular fast-casual lunch choice. I am not sure, however, whether people would want to see today’s piece, an article from the New York Times about the nutritional value of a Chipotle meal. The piece makes good use of a few bar charts and nice photographs and table to explain how calorific a burrito there can be. Maybe I should be having a salad for lunch today…

Chipotle calories
Chipotle calories

Credit for the piece goes to Kevin Quealy, Amanda Cox, and Josh Katz.

A Year on Pluto

Last week, NASA’s Dawn probe entered orbit above Ceres, a dwarf planet in the asteroid belt. But later this summer, the New Horizons spacecraft is set to race past Pluto, formerly a planet but now a dwarf planet. New Horizons launched in 2006 and will have taken nine years to reach Pluto. But how long is a year on Pluto? Thanks to the New Horizons team, we can see how one year on Pluto is 248 Earth years, or longer than the history of the independent United States.

A year on Pluto
A year on Pluto

Credit for the piece goes to the NASA/New Horizon team graphics department.

Where to Catch Foul Balls

As we established yesterday, baseball is rumbling back to life with Spring Training. That means it is time to start buying tickets for games. But if, like me, you have never caught a foul ball or home run, you may want to sit in a location where you can optimise your chances. Where is that? Well, now we have an app for that, Ideal Seat, as covered by Time. It uses interactive maps of stadiums and data on where hit balls land to generate an average number of balls per game—an average of about 30 foul balls per game.

Safeco Field as a sample

Credit for the piece goes to Ideal Seat.

Baseball Is (Almost) Back

As the title says, baseball is almost back. Red Sox spring training games begin as the Red Sox take on Northeastern today. The off-season is perhaps the hardest part of the year for a fan, because unless you take super interest in trades, there is no baseball. But what about on Twitter? Well, today’s piece is an article from Fangraphs that looks at team-by-team off-season Twitter use.

Twitter engagement
Twitter engagement

Personally, I am not really a fan of the graphic. As a static image, it does not allow me to easily compare the different retweets or favourites. But, in the aggregate, you can see that the Seattle Mariners are perhaps the most active Twitter account.

Credit for the piece goes to Sean Dolinar.

Wars Are Bad, But Not as Bad as They Used To Be

War is bad for the population business—arguably good for business business. A year ago, the Hague Centre for Strategic Studies released a .pdf that looked at peace and conflict and their respective drivers. The designers clumsily pieced everything together so that the sum is less than the constituent parts. But, if you isolate each piece and look at it alone, you can ignore the overall design and focus on the merits of each component. The excerpt below looks at the deaths in wars over time and their share of world population.

You don't see the word Westphalian used very often
You don’t see the word Westphalian used very often

Credit for the piece goes to Tim Sweijs and Joshua Polchar.

Lynchings

Let’s follow up yesterday’s good news story about measles with lynchings. The New York Times mapped and charted historical lynchings from 1877 to 1950 across 12 states in the South.

Locations of lynchings across the South, 1877–1950

Credit for the piece goes to the New York Times graphics department.

The Measles Outbreak

People, science is your friend. Vaccinations are not only for the benefit of yourself, but for others. Anyway, let us take a look at the measles outbreak through some graphics produced by the New York Times. It started in Disneyland. Because we had eliminated the disease about 15 years ago. Science, people.

Where the outbreak had spread as of 6 February

Credit for the piece goes to Jonathan Corum, Josh Keller, Haeyoun Park, and Archie Tse.

Presidents Day Popularity Contests

Yesterday was Presidents Day and I had the day off. So today’s post is a bit late, but it still works. Pew Research Centre pulled together data they had on presidential popularity from Eisenhower to Obama. The data point was job approval.

There has been a widening polarity gap

Credit for the piece goes to the graphics department of the Pew Research Centre.

Squaring Up London

Choropleths are not always a good idea. For example, look at election maps. Highly populated but geographically small cities appear as mere drops of ink on paper or pixels on a screen. Meanwhile, vast deserts appear gigantic empires. Nothing new there. But even within cities, these issues exist. London is one such city and one design studio has been working on a means of changing that. London Squared Map converts the boroughs of London into almost all squares of equal area. Each is placed in the appropriate space to represent geographic location. But to convey actual geography and familiarise the audience, not all squares are equal. Instead, just like the city itself, the squares are divided by a simplified shape of the Thames.

the London Squared Map

Credit for the piece goes to After the Flood.