New York Is Still Beating London

So two weeks ago I posted about the graphics in a BBC article about how London has surpassed New York in terms of murders, due to a spate of stabbings in the British capital. Well, somehow I missed this: an article from the Economist that rebuts that point. And it does it brilliantly.

Lies, damned lies, and statistics.

I think everybody who works with data knows that adage. Now, I am not using it to say that the BBC—or the numerous other media outlets that ran the story—lied. Just that it is easy to change the story based on the data, how it is presented, or which subsets of the data are selected.

The Economist’s article points out that the surpassing of New York is a short term data point, a worrying short term trend, definitely, but they then look at the data. They select two timeframes and look at them side-by-side.

It's all about what data you show, choose to highlight, and then how you show it.
It’s all about what data you show, choose to highlight, and then how you show it.

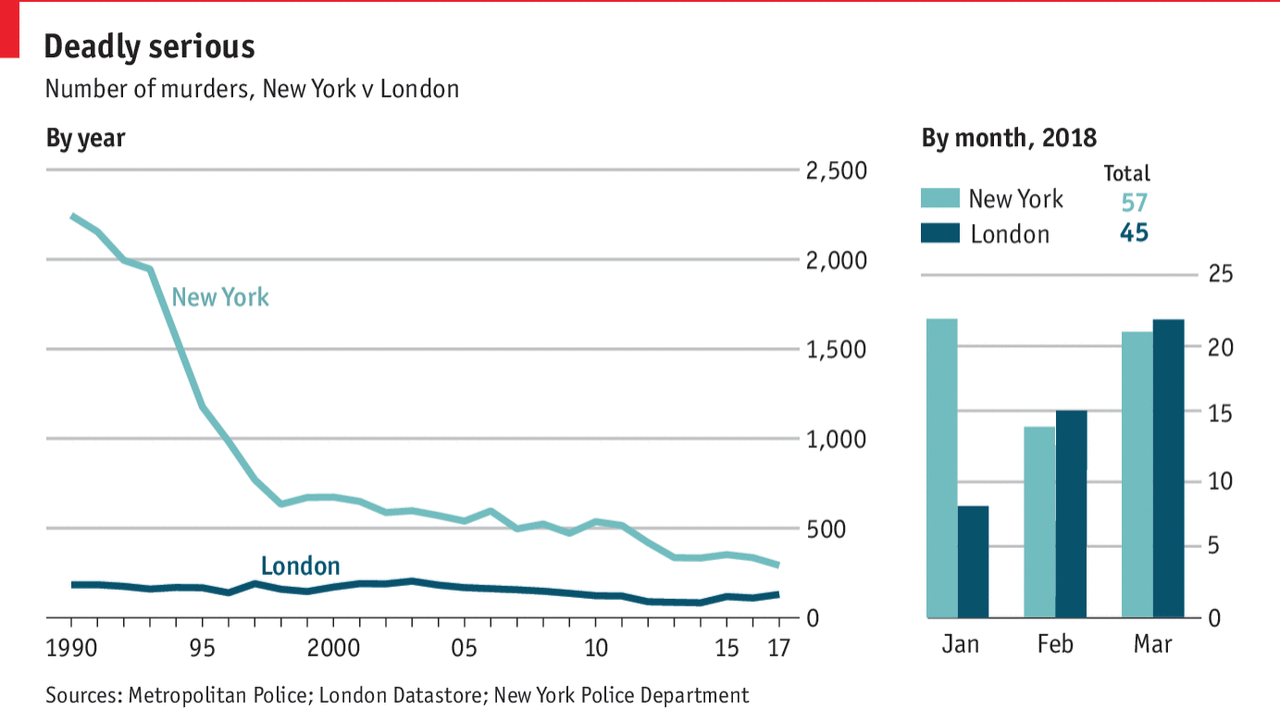
And that is what I love about this piece. It shows the long-term context of New York having a far-higher medium-term history of murder (some 28 years of data is shown). When I was growing up in the 90s, murders in New York—and to be fair almost all large American cities—was just something that was a known fact. During that time, London hovered below 200 or so, compared to the 2000+ in early 90s New York.

But then they also show the short term, which does point to a steady rise in London murders. But, the data could also show a one-time dip in the murders in New York. But they also show that the total number of deaths is still higher in New York than London, despite the three months of data.

Murder is not good. But these graphics are a good example of how selecting different time series for the same data set, and then showing which parts of the data to show. The earlier BBC piece, and my revision of it, did not show the total deaths. Nor did either piece show the longer timeline of data.

Credit for the piece goes to the Economist graphics department.

Gowanus, Brooklyn

This past weekend I was reading an article in the New York Times about how a diary from the 19th century may indicate a plot in Gowanus Brooklyn destined for development may contain an old slave burial ground. You may recall how this author’s hobbies include genealogy and family history—how I would love to find a 19th century diary. Then, given this interest and the article, it was fantastic to find a map in the article.

Brooklyn in black and white

Suffice it to say the map held my fascination for long enough that I saved the paper to post about it today. I was curious about two things, however, one, did the graphic have a credited author—it did not in the print edition—and two, was there a neat interactive version in the online version? The online version is simply a colour version of the map.

Brooklyn, now in colour

But the colour version does one thing that really helps make the graphic complete. In the print edition, there is no clear idea what the different layers are and it did take me a moment or two to understand the overlay. But the online version calls out specifically the map of the area from two different time periods.

Maps like these are my favourite. They blend history and the present. After all the places we live have often been lived in for centuries and they bear the marks of that inhabitance.

As to the first question, credit for the piece goes to Joe Burgess.

The Disappearing Urban Middle Class

Today we look at income in American cities and in particular the middle class disappearance. The Guardian published the graphics, but they originate with Metrocosm, LTDB at Brown, and IPUMS National Historical Geographic Information System. So what are we looking at? Well, the big one is a set of small multiples of cities and their income breakdowns as percentages of city census tracts. This screenshot is static, but the original is an animated .gif.

The flattening of the curve

I have a few issues with the design of the graphic, the most important of which is the colour palette. If the goal is to focus on the decline of the middle class—and I admit that may be the point of the Guardian’s authors and not the original authors—why are the most visually striking colours at the top of the income distribution. Instead, you would want to draw attention to the middle of each chart, not the right. And if the idea was that the darker colours represent the higher income groups, well the positioning of each bar on the chart and the axis labelling does that already. After all, if anything, the story is that in a number of cities the middle class has shrunk while the lower income groups have grown. And you can barely see that with the lower income groups coloured yellow.

My other issues are more minor design things such as the city labelling. I kept reading the label as being below the bars, not above as it actually is.

And then I wonder if a different chart form would be more effective at showing the decline in the middle class. Perhaps a line chart plotting the beginning and end points for each cohort?

Then the piece gets into some three-dimensional maps that you can spin and rotate.

Just stop
Just stop

Yeah. Shall I count the ways? A more conventional choropleth would have served the purpose far more effectively. The dimensionality hides lower income tracts behind higher ones. The solution? Allow the user to rotate and spin the map? No, get rid of the dimensionality. It offers little to the understanding of the underlying data. Not to mention, are the areas of shadows shadows? Or are they another bin or cohort of income?

And then you have to read the piece to get a fuller understanding of my criticism.

But don’t worry, I can quote it.

Chicago was largely successful transitioning away from manufacturing to a service-based economy. This shift is evident in the bifurcated pattern present in 2015 – a heavy concentration of wealth in the business/financial district and marked decline in the surrounding area.

Those of you who read this blog from Chicago or who have lived in Chicago will pick up on it. The rest of you not so much. The concentration of wealth is not located in the business/financial district. Those dark red skyscrapers are not actual skyscrapers, they are census tracts located not in the financial district, but the areas of River North, Old Town, Gold Coast, &c. Thinking of the issue more logically, yes incomes are up in cities that are doing well. But how many of those very wealthy live on the same block as their office? Not many. Your higher income is going to be concentrated in residential or mixed-residential neighbourhoods near, but not in the business/financial district.

The data behind this work fascinates me. I just wish the final graphics had been designed with a bit more consideration for the data and the stories therein. And a little bit of proper understanding of the cities and their geography would help the text.

Credit for the piece goes to Metrocosm, LTDB at Brown University, and IPUMS National Historical Geographic Information System.

Uber vs. Taxi (in New York)

I just spent the weekend back in my hometown of Philadelphia and while we walked most places, there were a few Uber rides. As someone who doesn’t use the app and normally will hail a taxi when necessary, I had been looking forward to posting this piece. FiveThirtyEight looked at data for New York comparing Uber to taxis.

Share in New York
Share in New York

Credit for the piece goes to Reuben Fischer-Baum.

How Can a Bar Chart Explain an Epidemic?

Today’s piece really is not a flashy one. I mean you can see that from the bar chart below. But, FiveThirtyEight put together a piece around it explaining just how that one chart is incredibly useful.

The epidemic curve
The epidemic curve

Credit for the graphic goes to the New York City Department of Health. For the analysis piece, that goes to FiveThirtyEight.

Hudson River Tunnels

Readers of this blog know that I am a fan of rail travel. And in particular, how the rail system on the East Coast is brilliant when compared to anywhere else in the States. Unfortunately, the railway system on the East Coast is also old and in need of serious capital investment. The tunnels linking New York and New Jersey beneath the Hudson River are a prime example. But a few years ago, Governor Christie of New Jersey killed Amtrak’s plans to build new tunnels to provide a backup to the existing infrastructure and increase overall capacity. The Wall Street Journal takes a look at Amtrak’s new plan to cross the Hudson. Let’s hope this venture is a bit more successful.

The new project
The new project

Credit for the piece goes to the Wall Street Journal graphics department.

Investigating the NYPD for Excessive Force

Sometimes complaints about excessive police force are frivolous or vindictive in nature. Sometimes, however, they are legitimate. In New York, the Civilian Complaint Review Board is the first line of investigation. It makes recommendations that the NYPD then takes up. Or not. This piece from WNYC looks at how the NYPD has responded to those recommendations.

What the NYPD chose to do with cases in which charges were recommended

In total, the piece is a guided story. Each step morphs the data into a new display. Overall a small, but quite nice piece.

Credit for the piece goes to the WNYC graphics department.

The Cycling Gender Gap

Here in Chicago this week is Bike Week and today Bike to Work Day. So today is a great day for some work from Buzzfeed that highlights the gender gap in cycling (at least in three US cities). To be fair, the data for the statement comes only from urban bike share programmes. But it does hint at a disparity all the same.

Chicago's cycling gender gap
Chicago’s cycling gender gap

Credit for the piece goes to Jeremy Singer-Vine.

Bloomberg’s New York

For those of you who read this blog and are not from New York, Mayor Bloomberg is done later this year; he is not running for reelection. So now is the time for retrospective and plaudits for the long-serving mayor. The New York Times published a piece this weekend examining how all of Bloomberg’s changes for redevelopment have reshaped the city of New York.

Rezoned areas of the city

Credit for the piece goes to Ford Fessenden, Tom Giratikanon, Josh Keller, Archie Tse, Tim Wallace, Derek Watkins, Jeremy White, and Karen Yourish