Auto Emissions Stuck in High Gear

The last two days we looked at densification in cities and how the physical size of cities grew in response to the development of transport technologies, most notably the automobile. Today we look at a New York Times article showing the growth of automobile emissions and the problem they pose for combating the greenhouse gas side of climate change.

The article is well worth a read. It shows just how problematic the auto-centric American culture is to the goal of combating climate change. The key paragraph for me occurs towards the end of the article:

Meaningfully lowering emissions from driving requires both technological and behavioral change, said Deb Niemeier, a professor of civil and environmental engineering at the University of Maryland. Fundamentally, you need to make vehicles pollute less, make people drive less, or both, she said.

Of course the key to that is probably in the range of both.

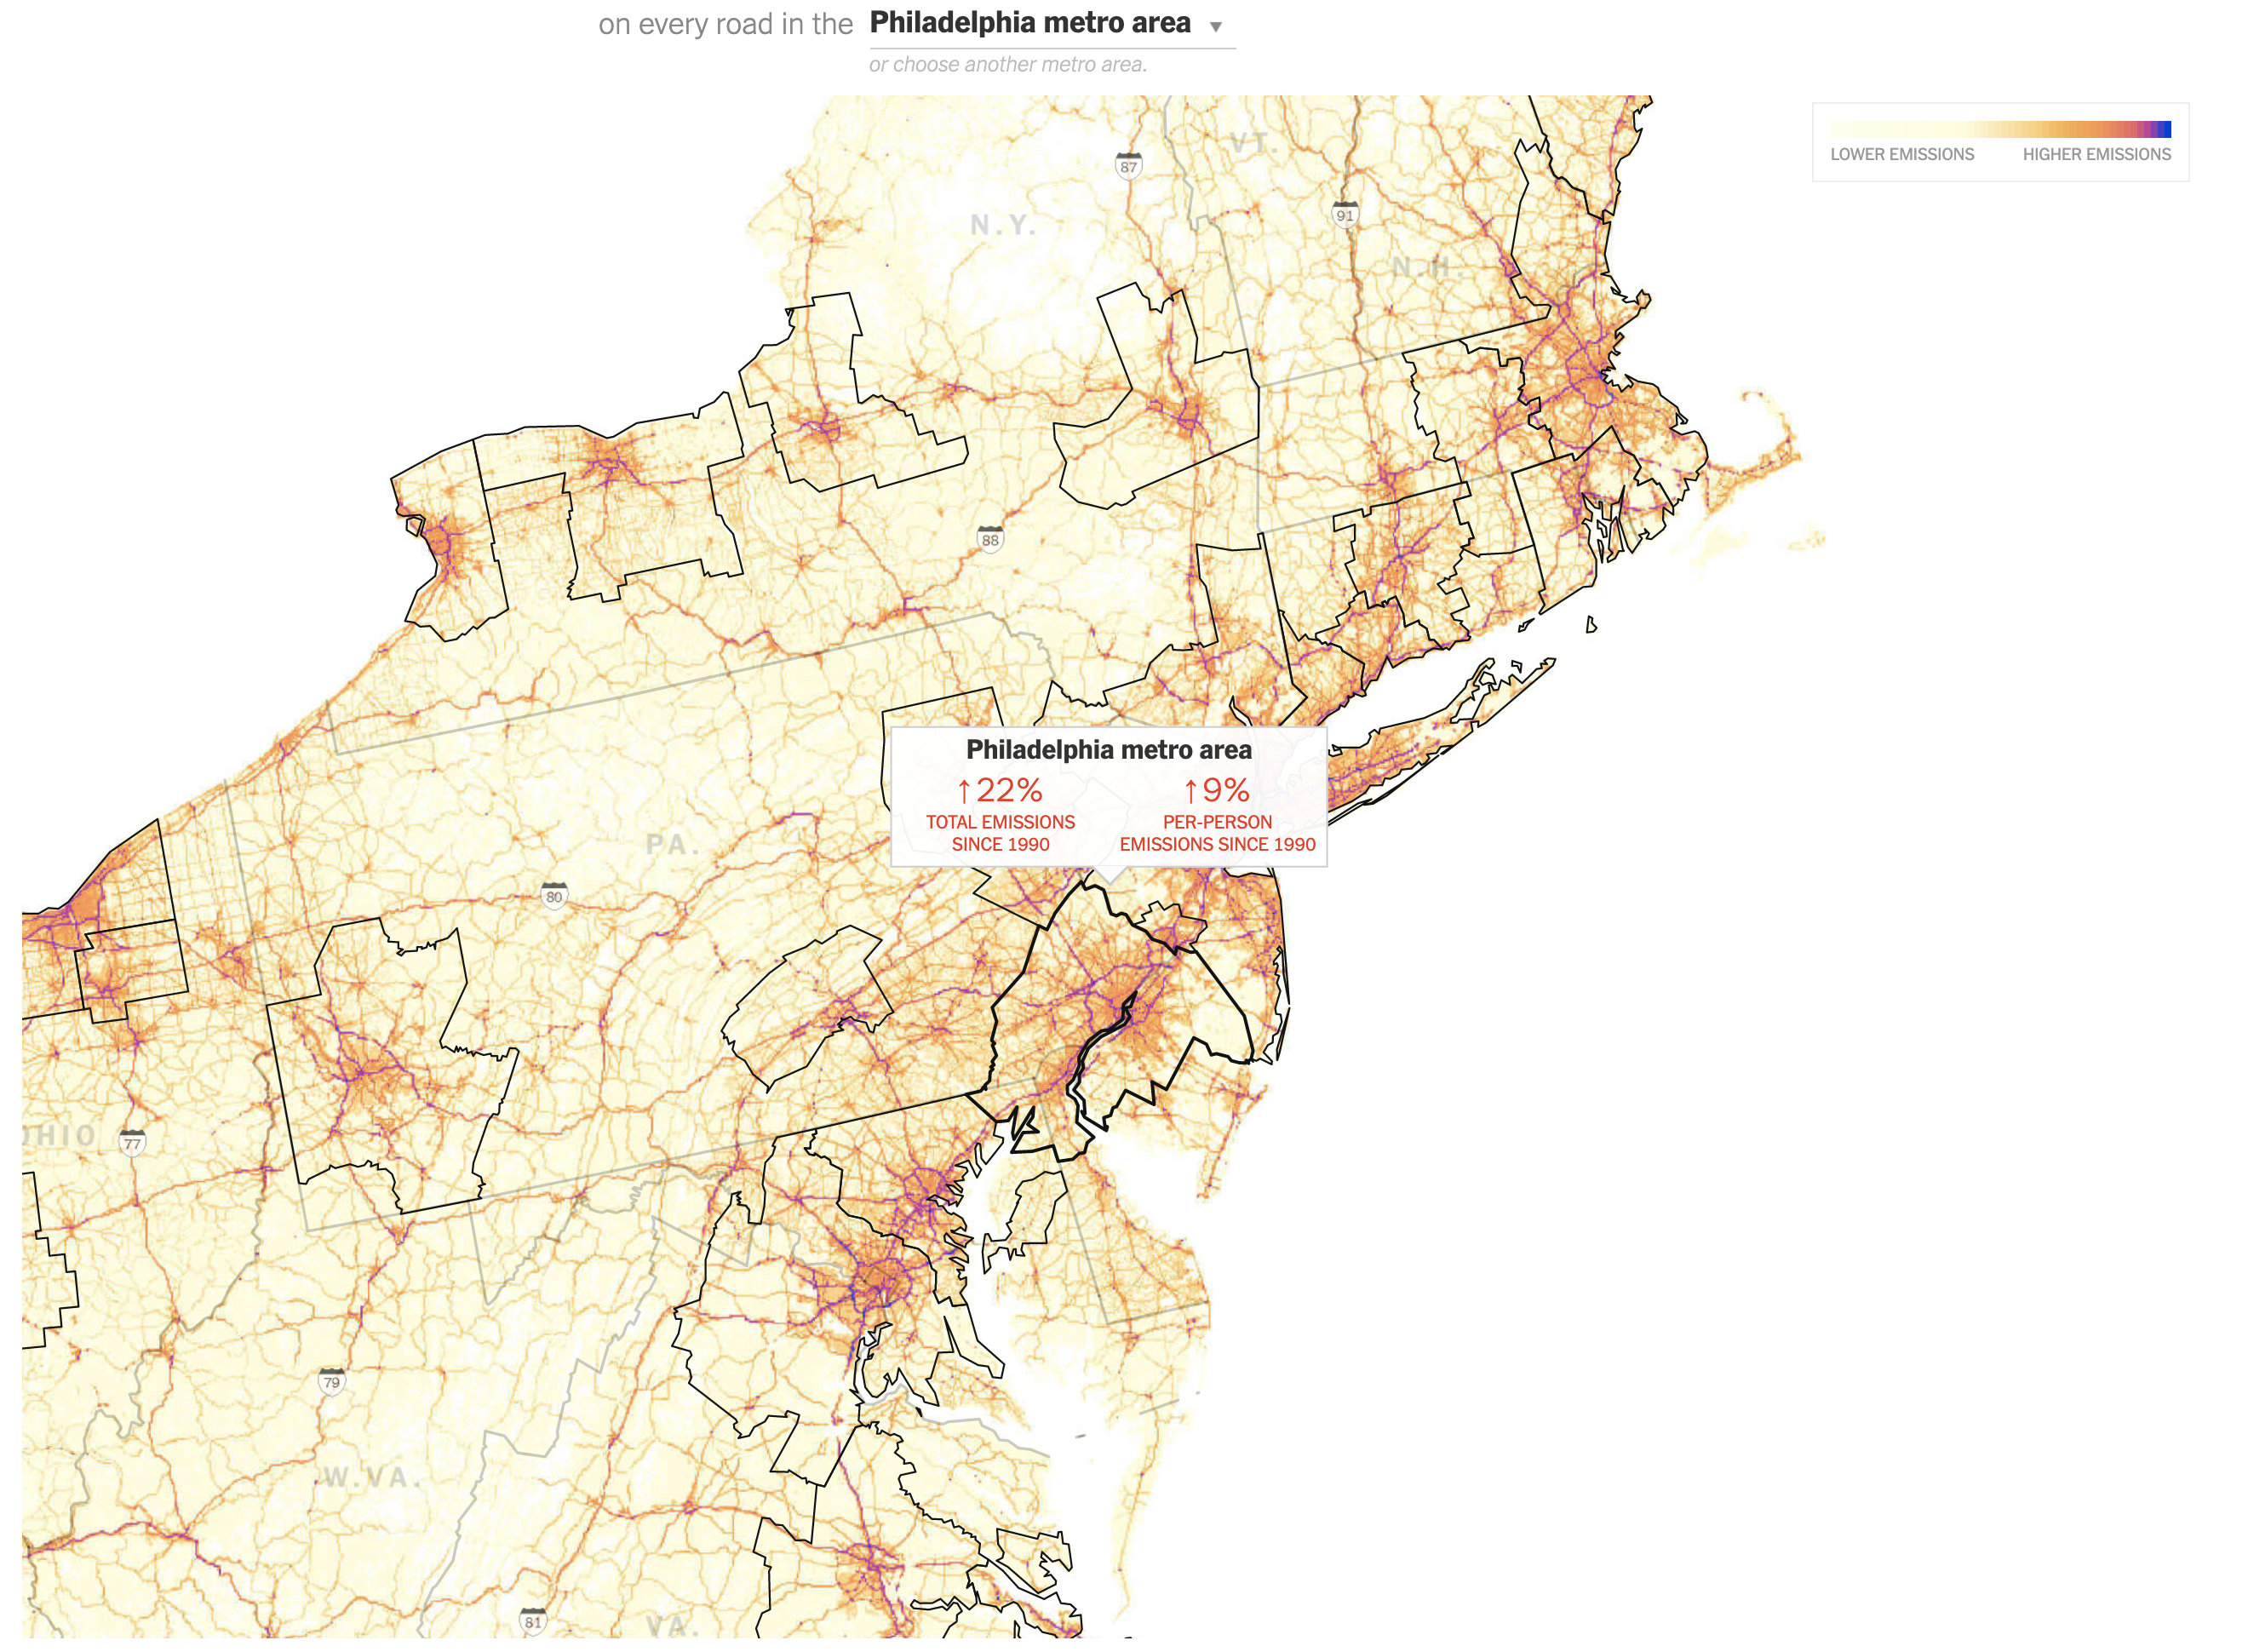
The star of the piece is the map showing the carbon dioxide emissions on the roads from passenger and freight traffic. Spoiler: not good.

From this I blame the Schuylkill, Rte 202, the Blue Route, I-95, and just all the highways

Each MSA is outlined in black and is selectable. The designers chose well by setting the state borders in a light grey to differentiate them from when the MSA crosses state lines, as the Philadelphia one does, encompassing parts of Pennsylvania, New Jersey, Delaware, and Maryland. A slight opacity appears when the user mouses over the MSA. Additionally a little box remains up once the MSA is selected to show the region’s key datapoints: the aggregate increase and the per capita increase. Again, for Philly, not good. But it could be worse. Phoenix, which surpassed Philadelphia proper in population, has seen its total emissions grow 291%, its per capita growth at 86%. My only gripe is that I wish I could see the entire US map in one view.

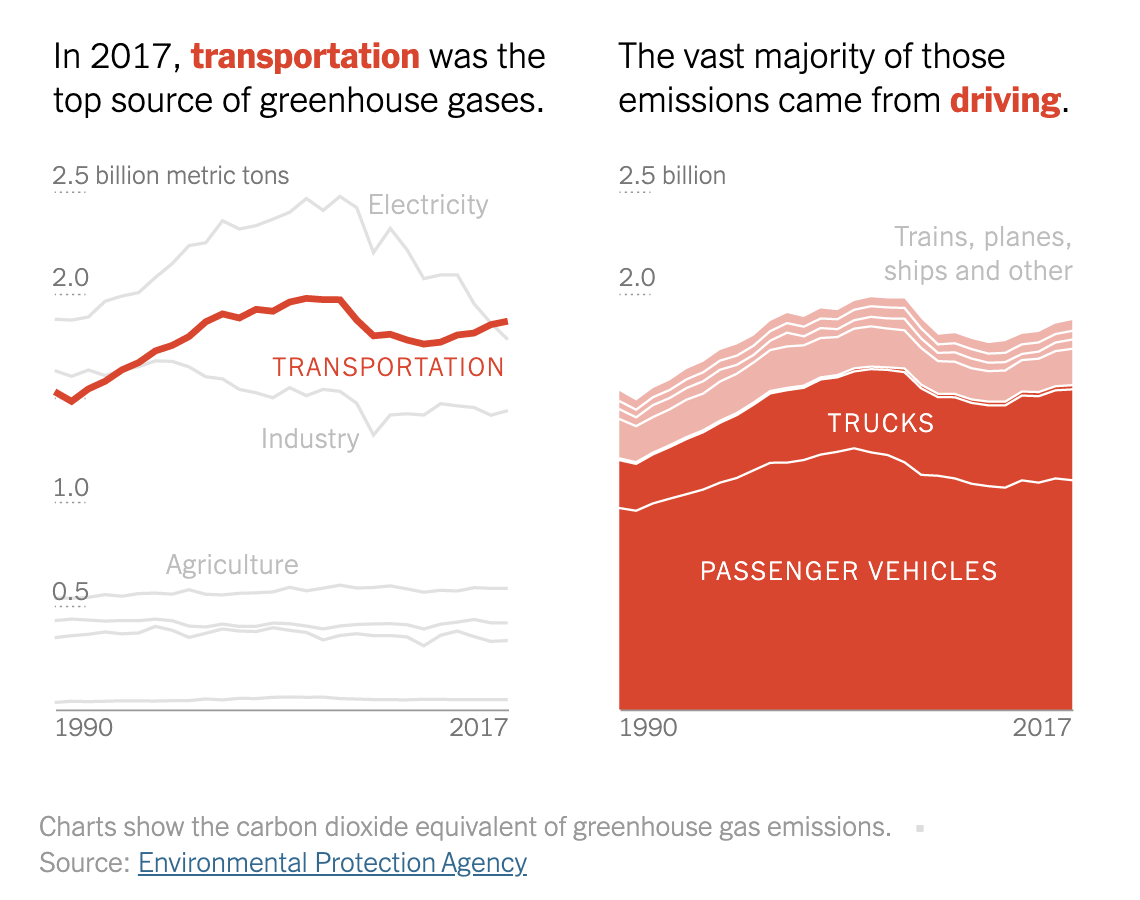
The piece also includes some nice charts showing how automobile emissions compare to other sources. Yet another spoiler: not good.

I've got it: wind-powered cars with solar panels on the bonnet.
I’ve got it: wind-powered cars with solar panels on the bonnet.

Since 1990, automobile emissions have surpassed both industry emissions and more recently electrical generation emissions (think shuttered coal plants). Here what I would have really enjoyed is for the share of auto emissions to be treated like that share of total emissions. That is, the line chart does a great job showing how auto emissions have surpassed all other sources. But the stacked chart does not do as great a job. The user can sort of see how passenger vehicles have plateaued, but have yet to decline whereas lorries have increased in recent years. (I would suspect due to increased deliveries of online-ordered goods, but that is pure speculation.) But a line chart would show that a little bit more clearly.

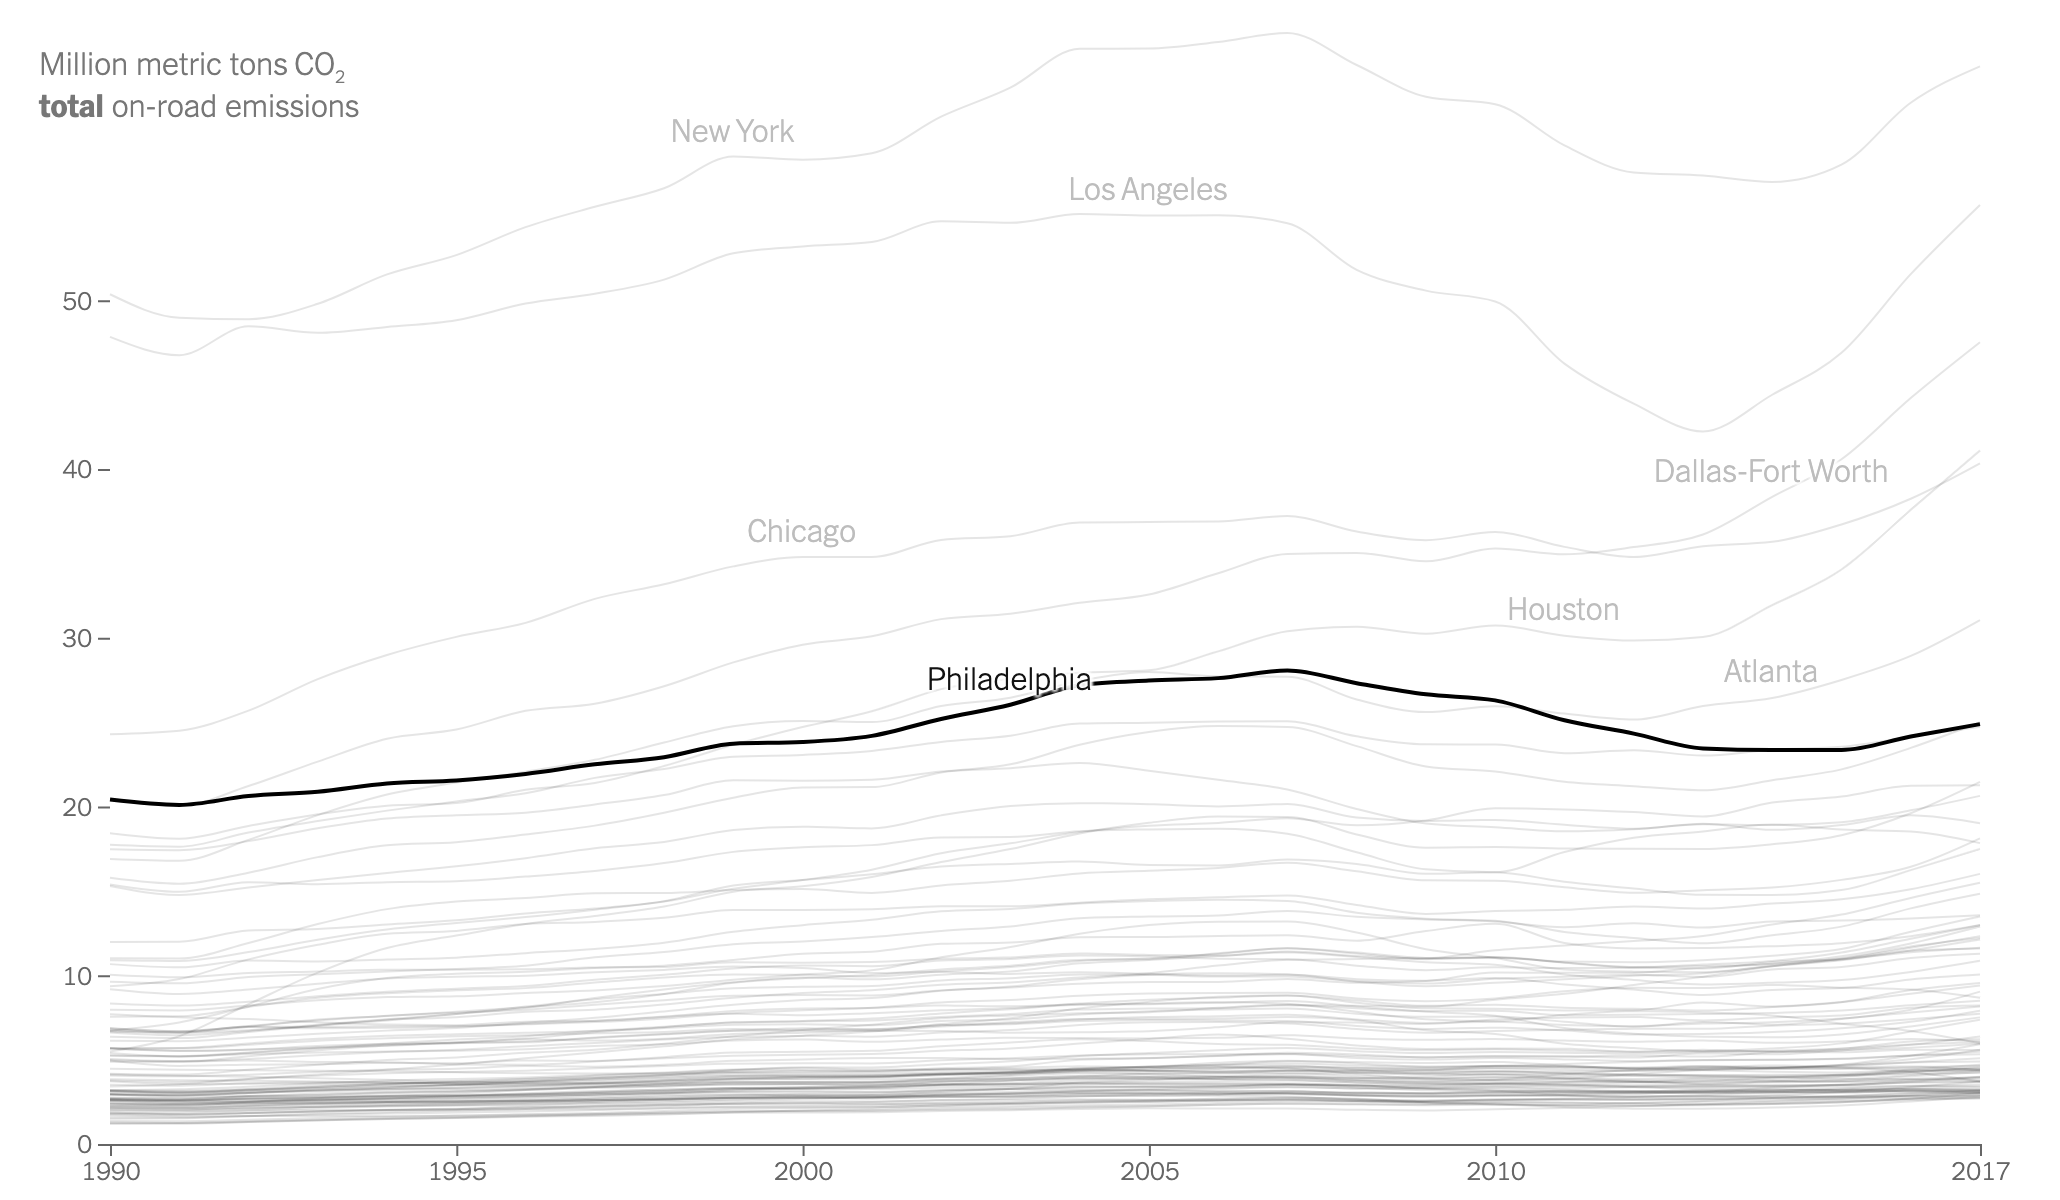
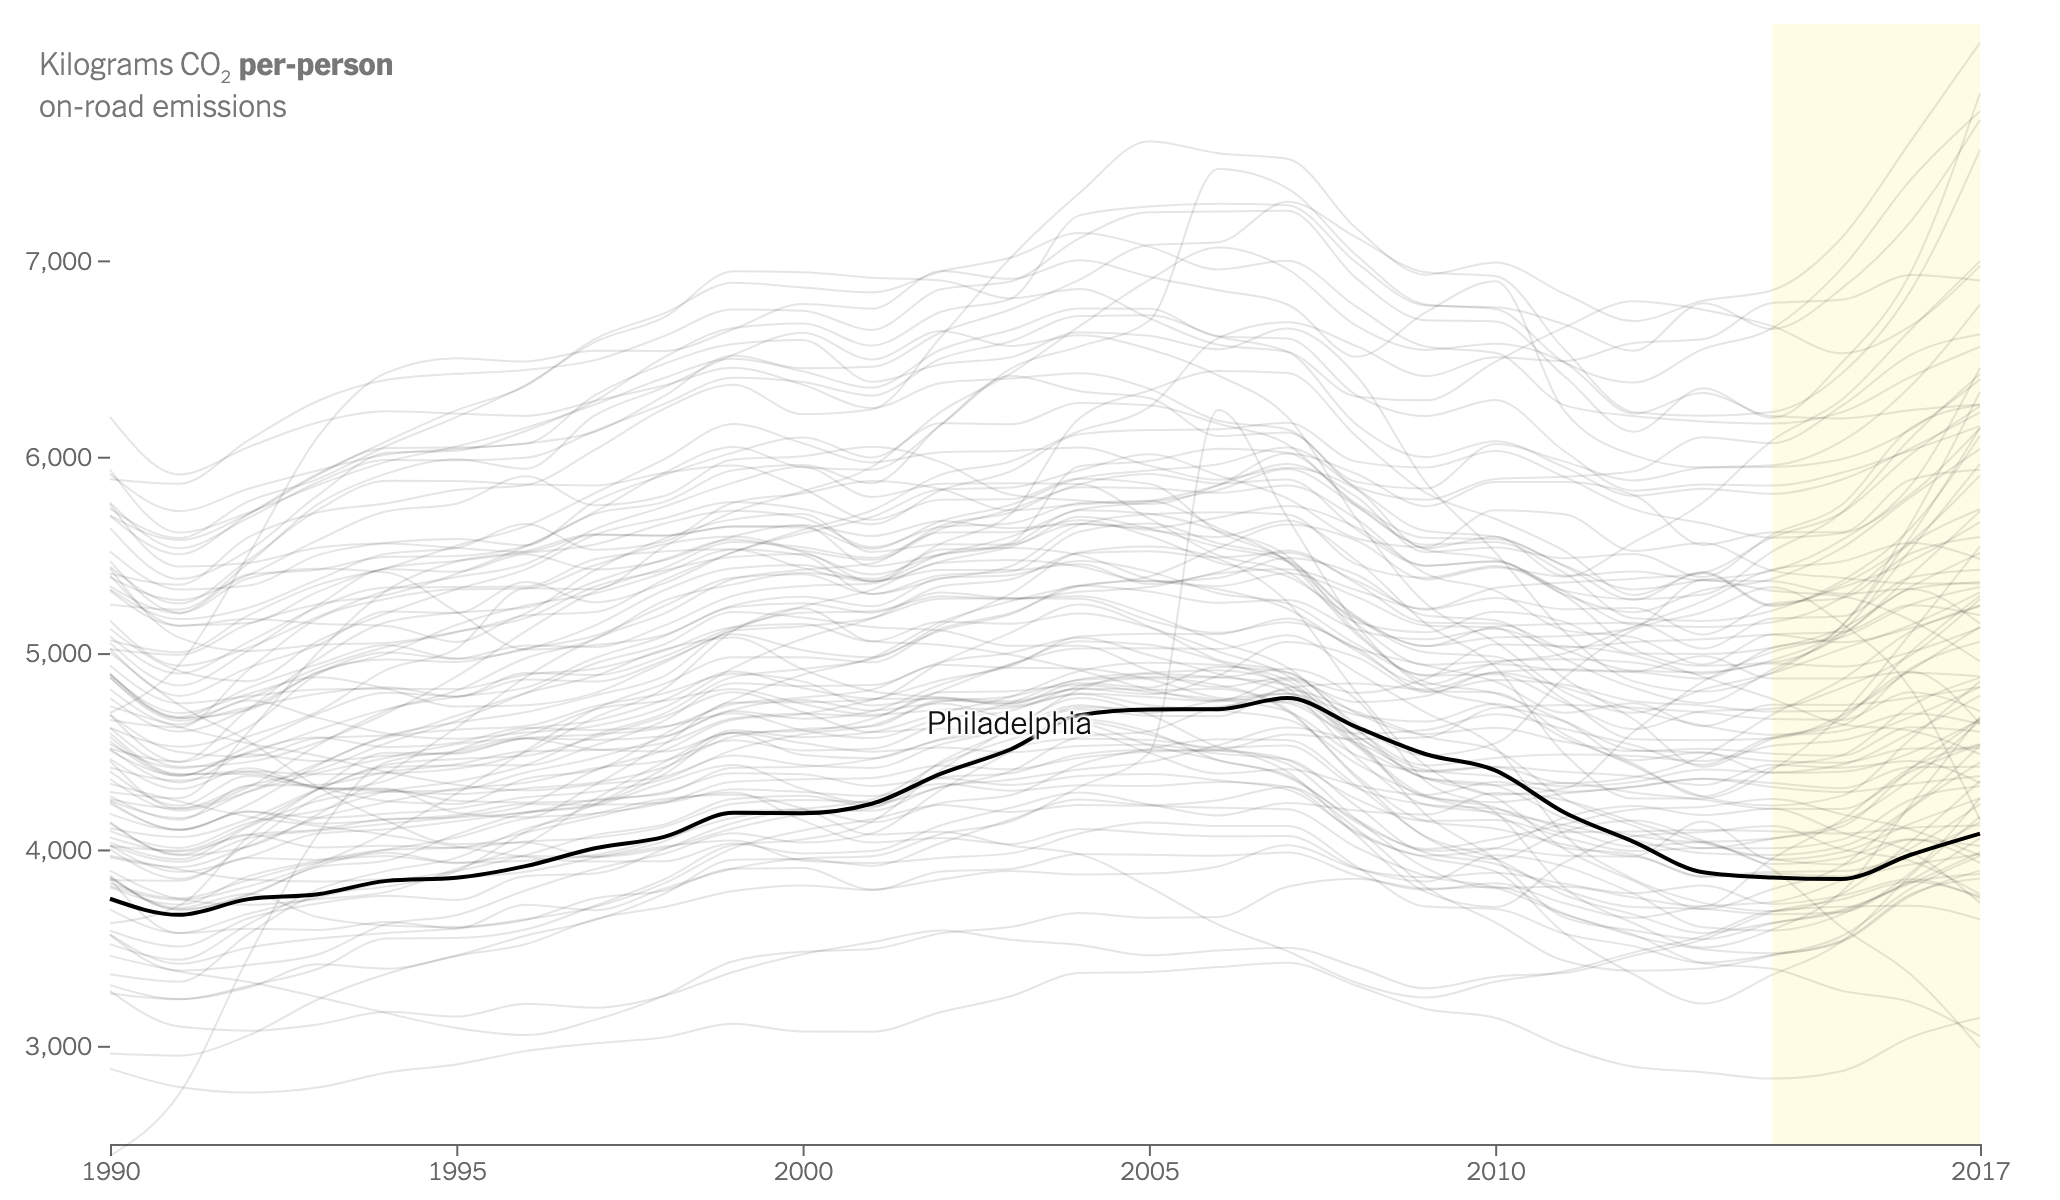
Finally, we have a larger line chart that plots each city’s emissions. As with the map, the key thing here is the aggregate vs. per capita numbers. When one continues to scroll through, the lines all change.

Lots of people means lots of emissions.
There's driving in the Philadelphia area, but it's not as bad as it could be.
There’s driving in the Philadelphia area, but it’s not as bad as it could be.

Very quickly one can see how large cities like New York have large aggregate emissions because millions of people live there. But then at a per capita level, the less dense, more sprawl-y cities tend to shoot up the list as they are generally more car dependent.

Credit for the piece goes to Nadja Popovich and Denise Lu.

Different Paths to Density

Yesterday we looked at the expansion of city footprints by sprawl, in modern years largely thanks to the automobile. Today, I want to go back to another article I’ve been saving for a wee bit. This one comes from the Economist, though it dates only back to the beginning of October.

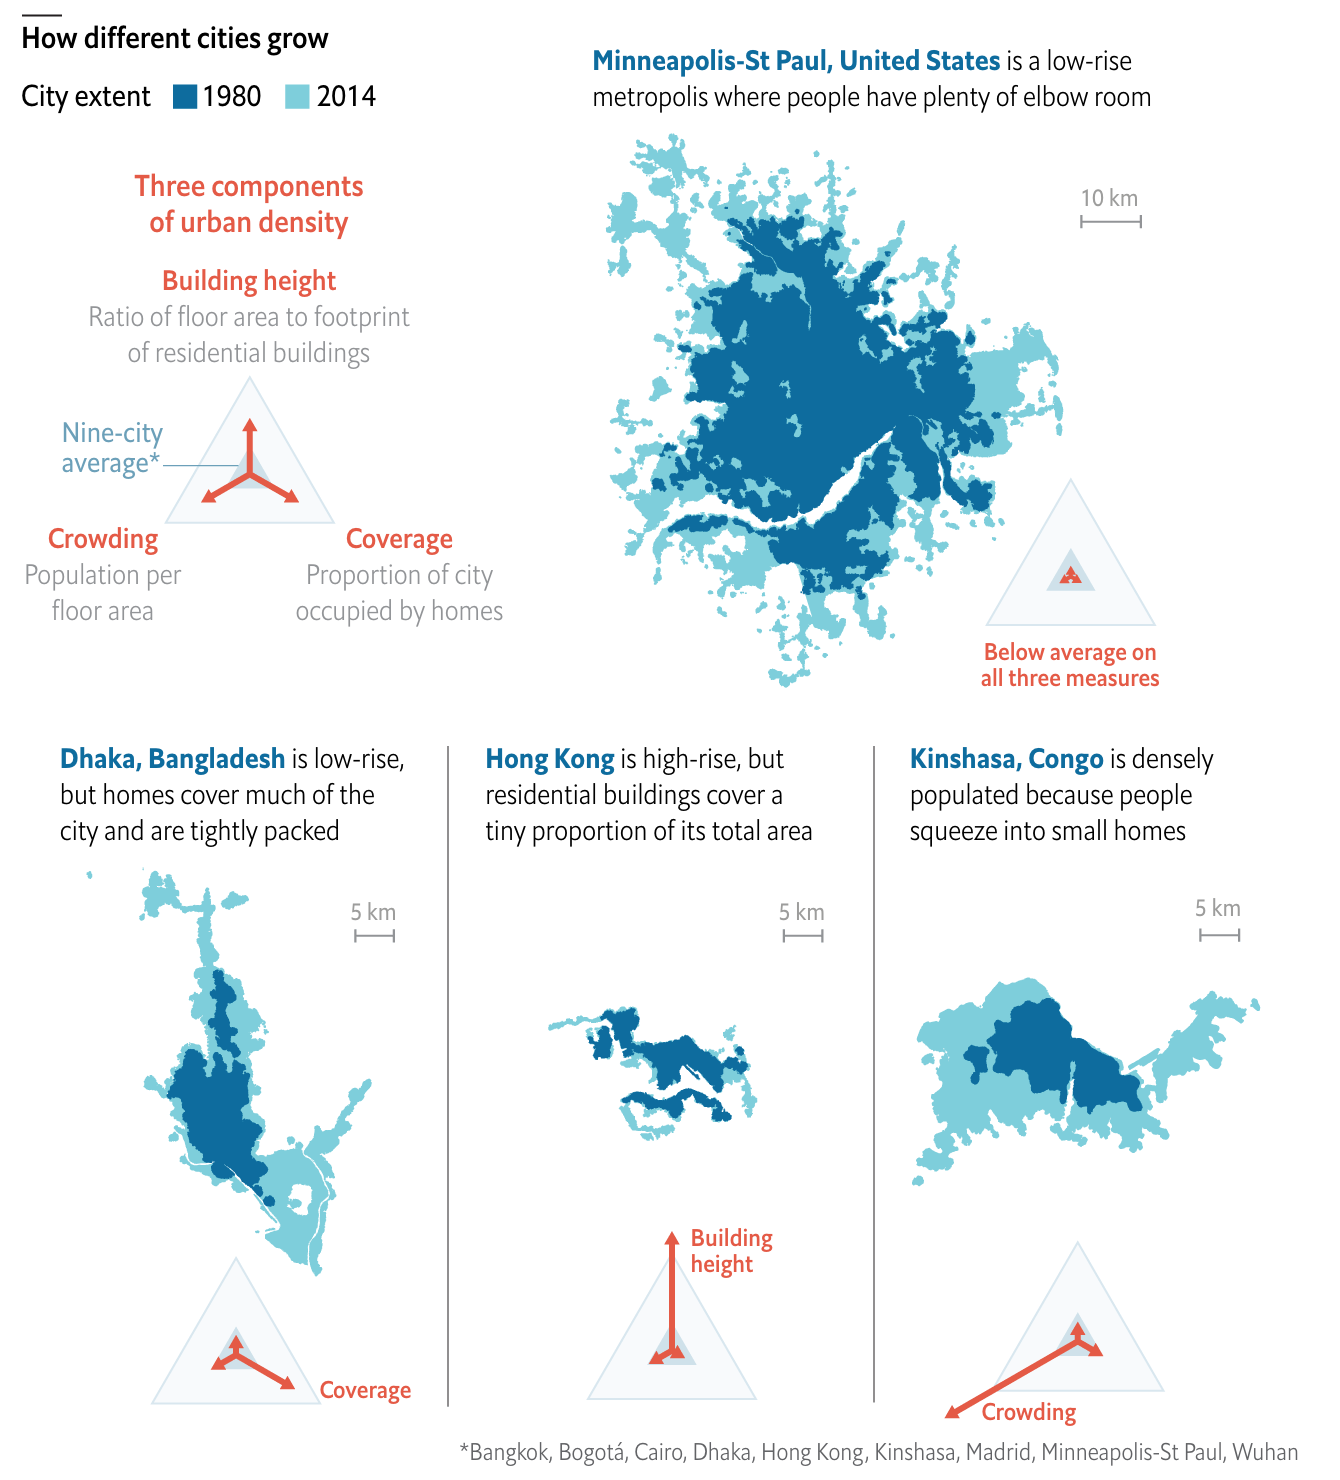
This article looks at the different ways a city can achieve density. Usually one things of soaring skyscrapers, but there are other paths. For those interested, the article is a short read and I won’t cover it here. But for the sake of the graphic below, there are three basic paths: coverage, height, and crowding. Or to put in other terms, how much of the city is covered by homes, how tall those homes go, and how many people fit into each home.

Reticulating splines

I really like this graphic. It does a great job of using small multiples to compare and contrast three cities that exemplify the different paths. Notably, it keeps each city footprint at the same scale, making it easier to see things such as why Hong Kong builds skyward. Because it has little land. (It is, after all, an island and the tip of a peninsula.)

One area where I wish the graphic had kept to the small multiples is its display of Minneapolis. There, the scale shifts (note the lines for 5 km below vs. Minneapolis’ 10 km). I think I understand why, because the sprawling city would not have fit within the confines of the graphic, but that would have also hammered home the point of sprawl.

I should also point out that the article begins with a graphic I chose not to screenshot, but that I also really enjoy. It uses small multiples to compare cities density over time, running population on the x-axis and people per hectare on the y-. It is not a perfect graphic (it uses I think unnecessary arrowheads at the end of the line), but scatter plots over time are, I think, an underused graphic to show how two variables (ideally related) have moved in tandem over time.

Overall, this is a strong piece from the Economist.

Credit for the piece goes to the Economist graphics department.

Mapping the Growth of Cities

This is an older piece from back in August, but I was waiting for a time when I would have some related articles to post alongside it. To start off the series of posts, we start with this piece from CityLab. As my titles implies, it looks at the growth of cities, but not in terms of people or technology but in terms of area/land.

The basic premise is that people look for a 30-minute commute and have done so throughout history. To make that point, the authors look at how transport technology evolved to enable people to live and work at further distances from each other, expanding the urban core.

The designer then chose to overlay the city limits of several cities largely defined by these technologies atop each other.

From small, compact, and dense to large, sprawling, and fluffy.

Conceptually the graphic works really well. The screenshot is of an animated. gif leading into the article that step-by-step reveals each city. However, throughout the article, each de facto section is introduced by a city outline graphic.

The graphic does a really nice job of showing how as technology allowed us to move faster, people chose to be further removed from the city core. Of course there are often multiple factors in why people may move out of the core, but transport certainly facilitates it.

Credit for the piece goes to David Montgomery.

I Have an App for That Too

Well, everyone, we made it to Friday. So let’s all reflect on how many things we did on our mobile phones this week. xkcd did. And it’s fairly accurate. Though personally, I would only add that I did not quite use my mobile for a TV remote. Unless you count Chromecasting. In that case I did that too.

What about boarding passes?

If I have to offer a critique, it’s that it makes smart use of a stacked bar chart. I normally do not care for them, but it works well if you are only stacking two different series in opposition to each other.

Credit for the piece goes to Randall Munroe.

How Worldly Is the World Series?

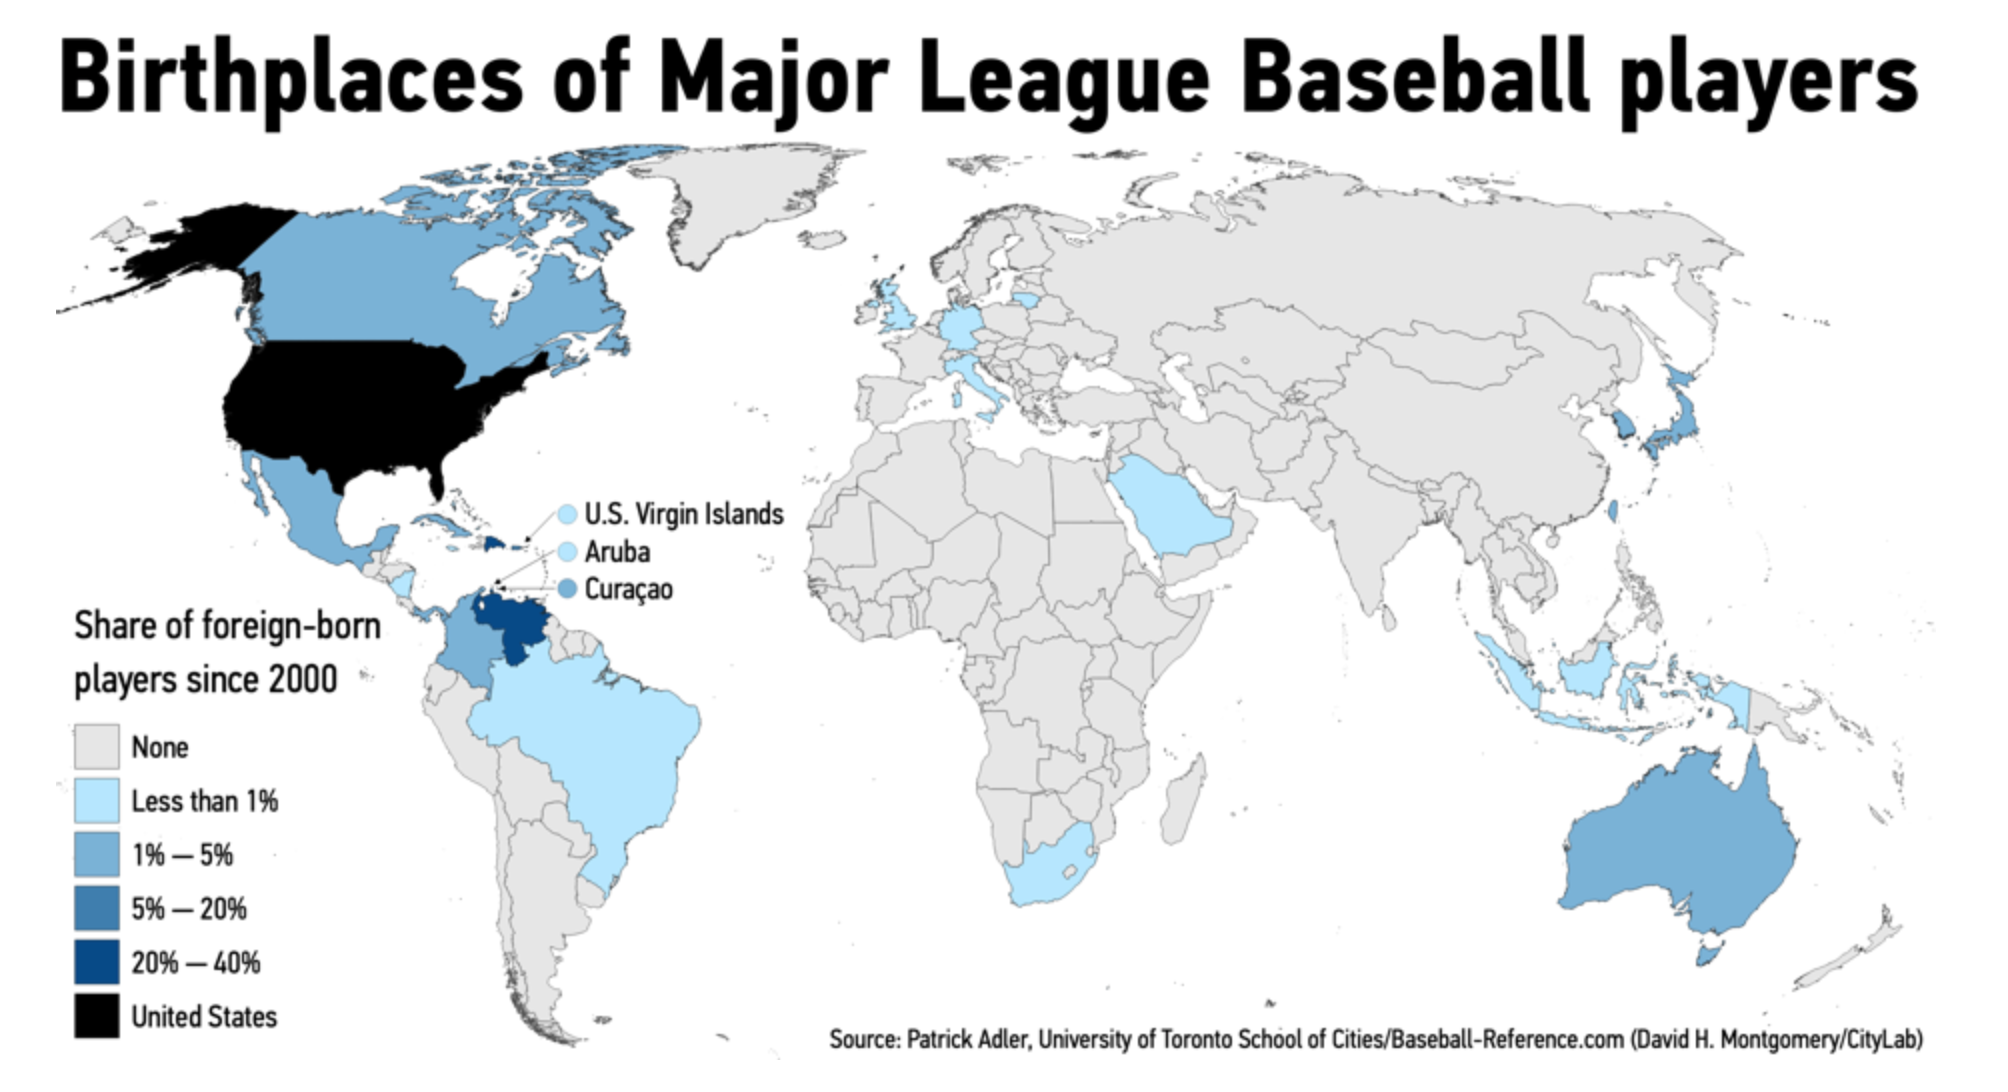
The World Series began Tuesday night. But, as many people reading this blog will know, baseball is not exactly a global sport. But is it really? CityLab looked at the origin of Major League Baseball players and it turns out that almost 30% of the players today are from outside the United States. They have a number of charts and graphics that explore the places of birth of ball players. But one of the things I learned is just how many players hail from the Dominican Republic—since 2000, 12% of all players.

There are quite a few players from countries around the Caribbean.

The choropleth here is an interesting choice. It’s a default choice, so I understand it. But when so many countries that are being highlighted are small islands in the Caribbean, a geographically accurate map might not be the ideal choice. Really, this map highlights from just how few countries MLB ball players originate.

Fortunately the other graphics work really well. We get bar charts about which cities provide MLB rosters. But the one I really enjoy is where they account for the overall size of cities and see which cities, for every 100,000 people, provide the most ballplayers.

One of the other things I want to pick on, however, is the inclusion of Puerto Rico. In the dataset, the designers included it as a foreign country. When, you know, it’s part of the United States.

Credit for the piece goes to David H. Montgomery.

Pub Trivia Scores—The Ryan’s Wedding Version

So another Wednesday, another pub trivia night. But two weekends ago, I attended the wedding of a good mate of mine down in Austin, Texas. And at his rehearsal/welcome dinner, he and his now wife had a trivia game. How well did their guests know them?

Turns out my friends and I, not so much. And I can prove it, because I documented our score after every round in my sketchbook.

Somewhere towards the middle we just started picking the most ridiculous answers.

Credit for this one is mine.

Canadian Election Results

Yesterday Canada went to the polls for the 43rd time. Their prime minister, Justin Trudeau, has had a bad run of it the last year or so. He’s had some frivolous scandals with wearing questionable fashion choices to some more serious scandals about how he chose to colour his face in his youth to arguably the most serious scandal where an investigation concluded improperly attempted to influence a criminal investigation for political gain. (Sound familiar, American readers?) Consequently, there was some chatter about whether he would lose to the Conservatives.

But nope, Trudeau held on.

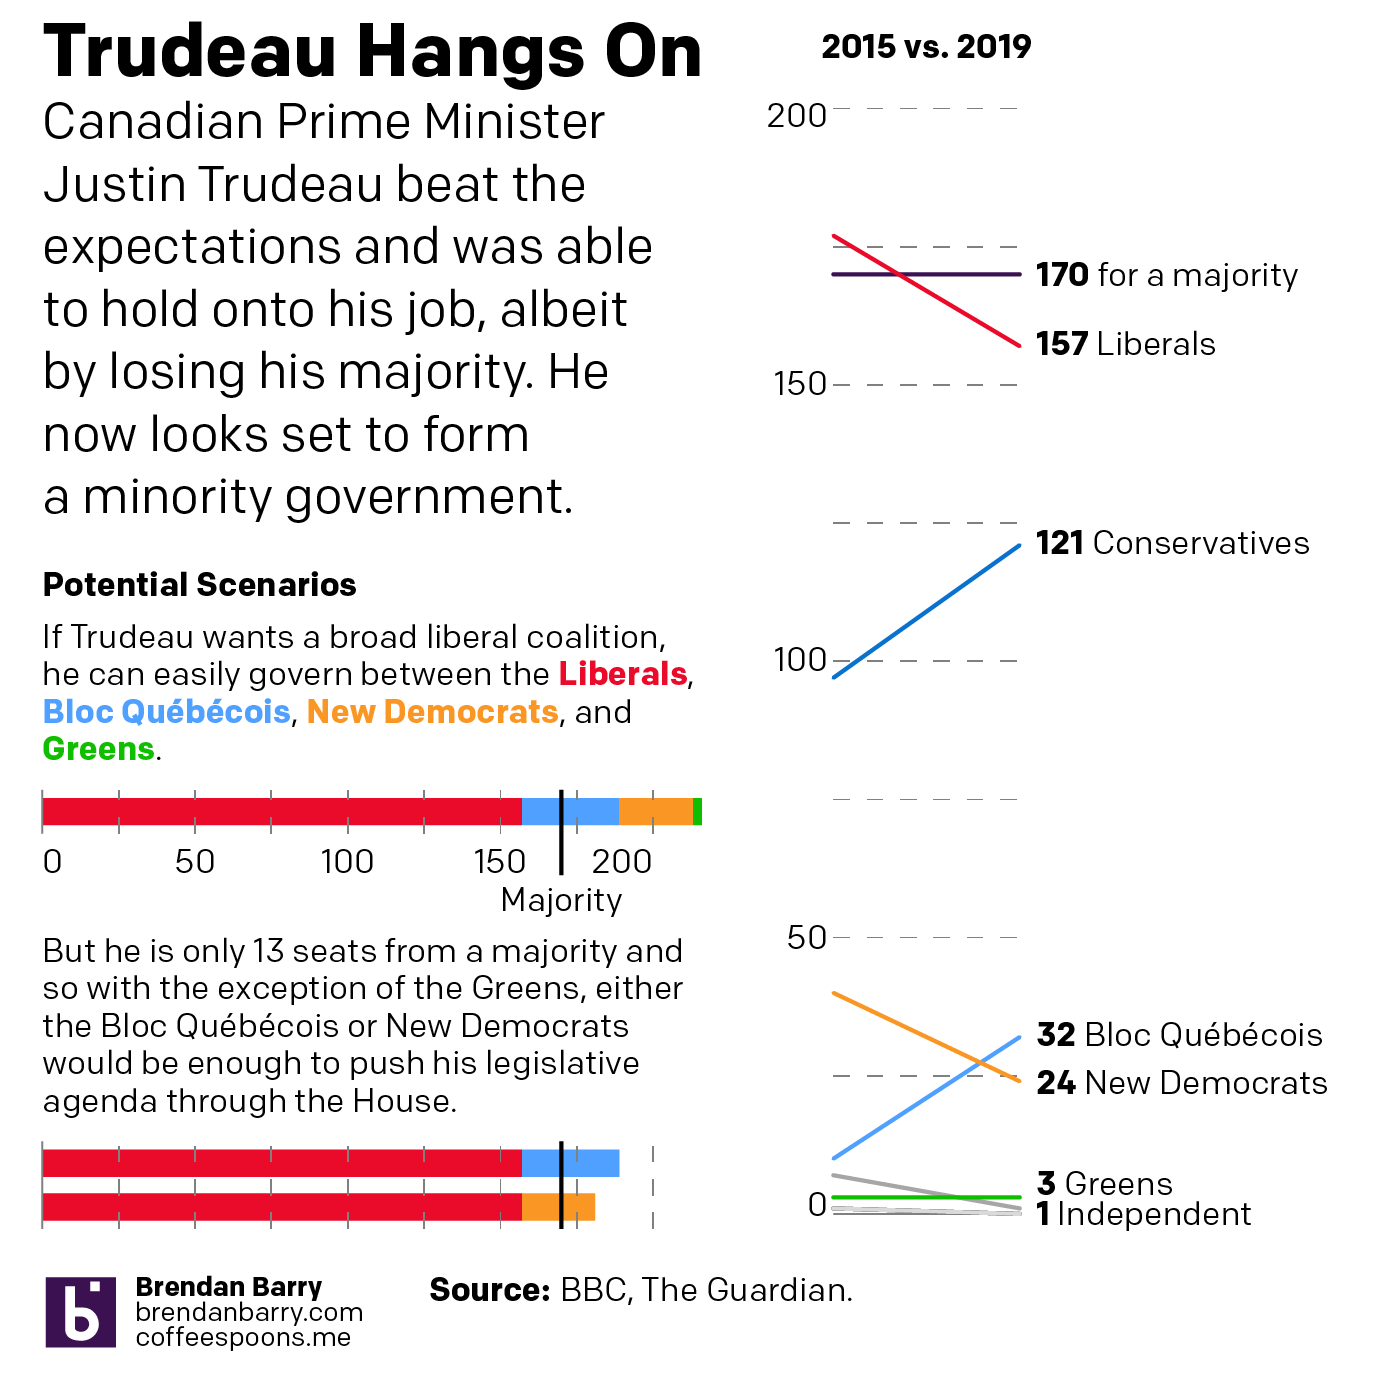
So this morning I charted some of the results. It was a bad night for Trudeau, but not nearly as bad as it could have been. He remains in power, albeit head of a minority government.

That's a steep drop in seats, but it could have been worse
That’s a steep drop in seats, but it could have been worse

Credit for the piece goes to me.
Where Is That Pesky Mason–Dixon Line?

It’s no big secret that genealogy and family history are two of my big interests and hobbies. Consequently, on rainy days I sometimes like to enjoy an episode or two of Who Do You Think You Are (I prefer the UK version, but the American one will do too) or Finding Your Roots. So I decided to watch one last night about Megan Mullally of Will & Grace fame. Long story short, her family has a connection to Philadelphia (only one block away from where I presently live) and so I paid a bit of attention to the map.

Now, DRM prevented me from taking a straight screenshot, so this is a photo of a screen—my apologies. But there is something to point out.

Mason and Dixon would be disappointed

The borders are wrong. So I made a quick annotation pointing out the highlights as it relates to Pennsylvania.

So many mistakes…
So many mistakes…

Credit for the piece goes to the Who Do You Think You Are graphics department.

The annotations are mine, though as for their geographic accuracy, they are approximate. I mean after all, I’m using Photoshop to put lines on a photograph of a laptop screen.

Leaf Peeping

Autumn arrived this week in Philadelphia. And with the cooler weather came blustery winds blowing yellowing leaves from city trees. The yellows and reds of trees beneath blue skies makes for some great photography. But what is really going on? Thankfully, the Washington Post published an article exploring where and why the leaves change colour (or don’t).

The star of the piece is the large map of the United States that shows the dominant colours of forests.

All the colours
All the colours

Little illustrations and annotations dot the map showing how particular trees (whose leaf shapes are shown) turn particular colours. The text in the piece elaborates on that and explains what is going on with pigments in the leaves. It adds to that how weather can impact the colour change.

Later on in the piece, a select set of photos for specific locations show at a more micro-level, how and where leaf colours change.

Overall, a solid piece for those of you who enjoy leaf peeping to read before this weekend.

Credit for the piece goes to Lauren Tierney and Joe Fox.

Brexit Deal 2.0

I’ve been trying to work on a Syrian changing alliances graphic, but the Brexit news today scuppered that. Instead, we take a look at Boris’ deal, which differs from May’s in that it chucks out the notion of territorial integrity, creating a border in the Irish Sea where goods will have to be inspected. My old Brexit trilemma graphic shows the new deal’s fundamental choices.

Shifting priorities
Shifting priorities

But how does this exiting the customs union and single market work? Well, the whole of the UK is leaving the customs union, but on the single market, there Northern Ireland remains in, aligned to the EU, whereas the rest of the UK is leaving. Ports will screen for some goods to ensure compliance with UK officials ensuring EU standards.

There are still questions about how this will all shake out

The BBC graphic above is pretty straightforward, showing the new border as a dotted line. But the border is there. There is still quite a bit we don’t know. And most important of those questions is can Boris get his deal through Parliament? Remember, he tossed 20 MPs out of the party. And there are signals that the DUP, a conservative Northern Irish party that provides the crucial backing votes to the Tories to ensure the Tory majority (before, again, Boris kicked out 20 of his own MPs), will vote against the deal because it separates them from the rest of the UK.

Credit for the trilemma is mine.

Credit for the BBC graphic goes to the BBC graphics department.