The last two days we looked at densification in cities and how the physical size of cities grew in response to the development of transport technologies, most notably the automobile. Today we look at a New York Times article showing the growth of automobile emissions and the problem they pose for combating the greenhouse gas side of climate change.
The article is well worth a read. It shows just how problematic the auto-centric American culture is to the goal of combating climate change. The key paragraph for me occurs towards the end of the article:
Meaningfully lowering emissions from driving requires both technological and behavioral change, said Deb Niemeier, a professor of civil and environmental engineering at the University of Maryland. Fundamentally, you need to make vehicles pollute less, make people drive less, or both, she said.
Of course the key to that is probably in the range of both.
The star of the piece is the map showing the carbon dioxide emissions on the roads from passenger and freight traffic. Spoiler: not good.
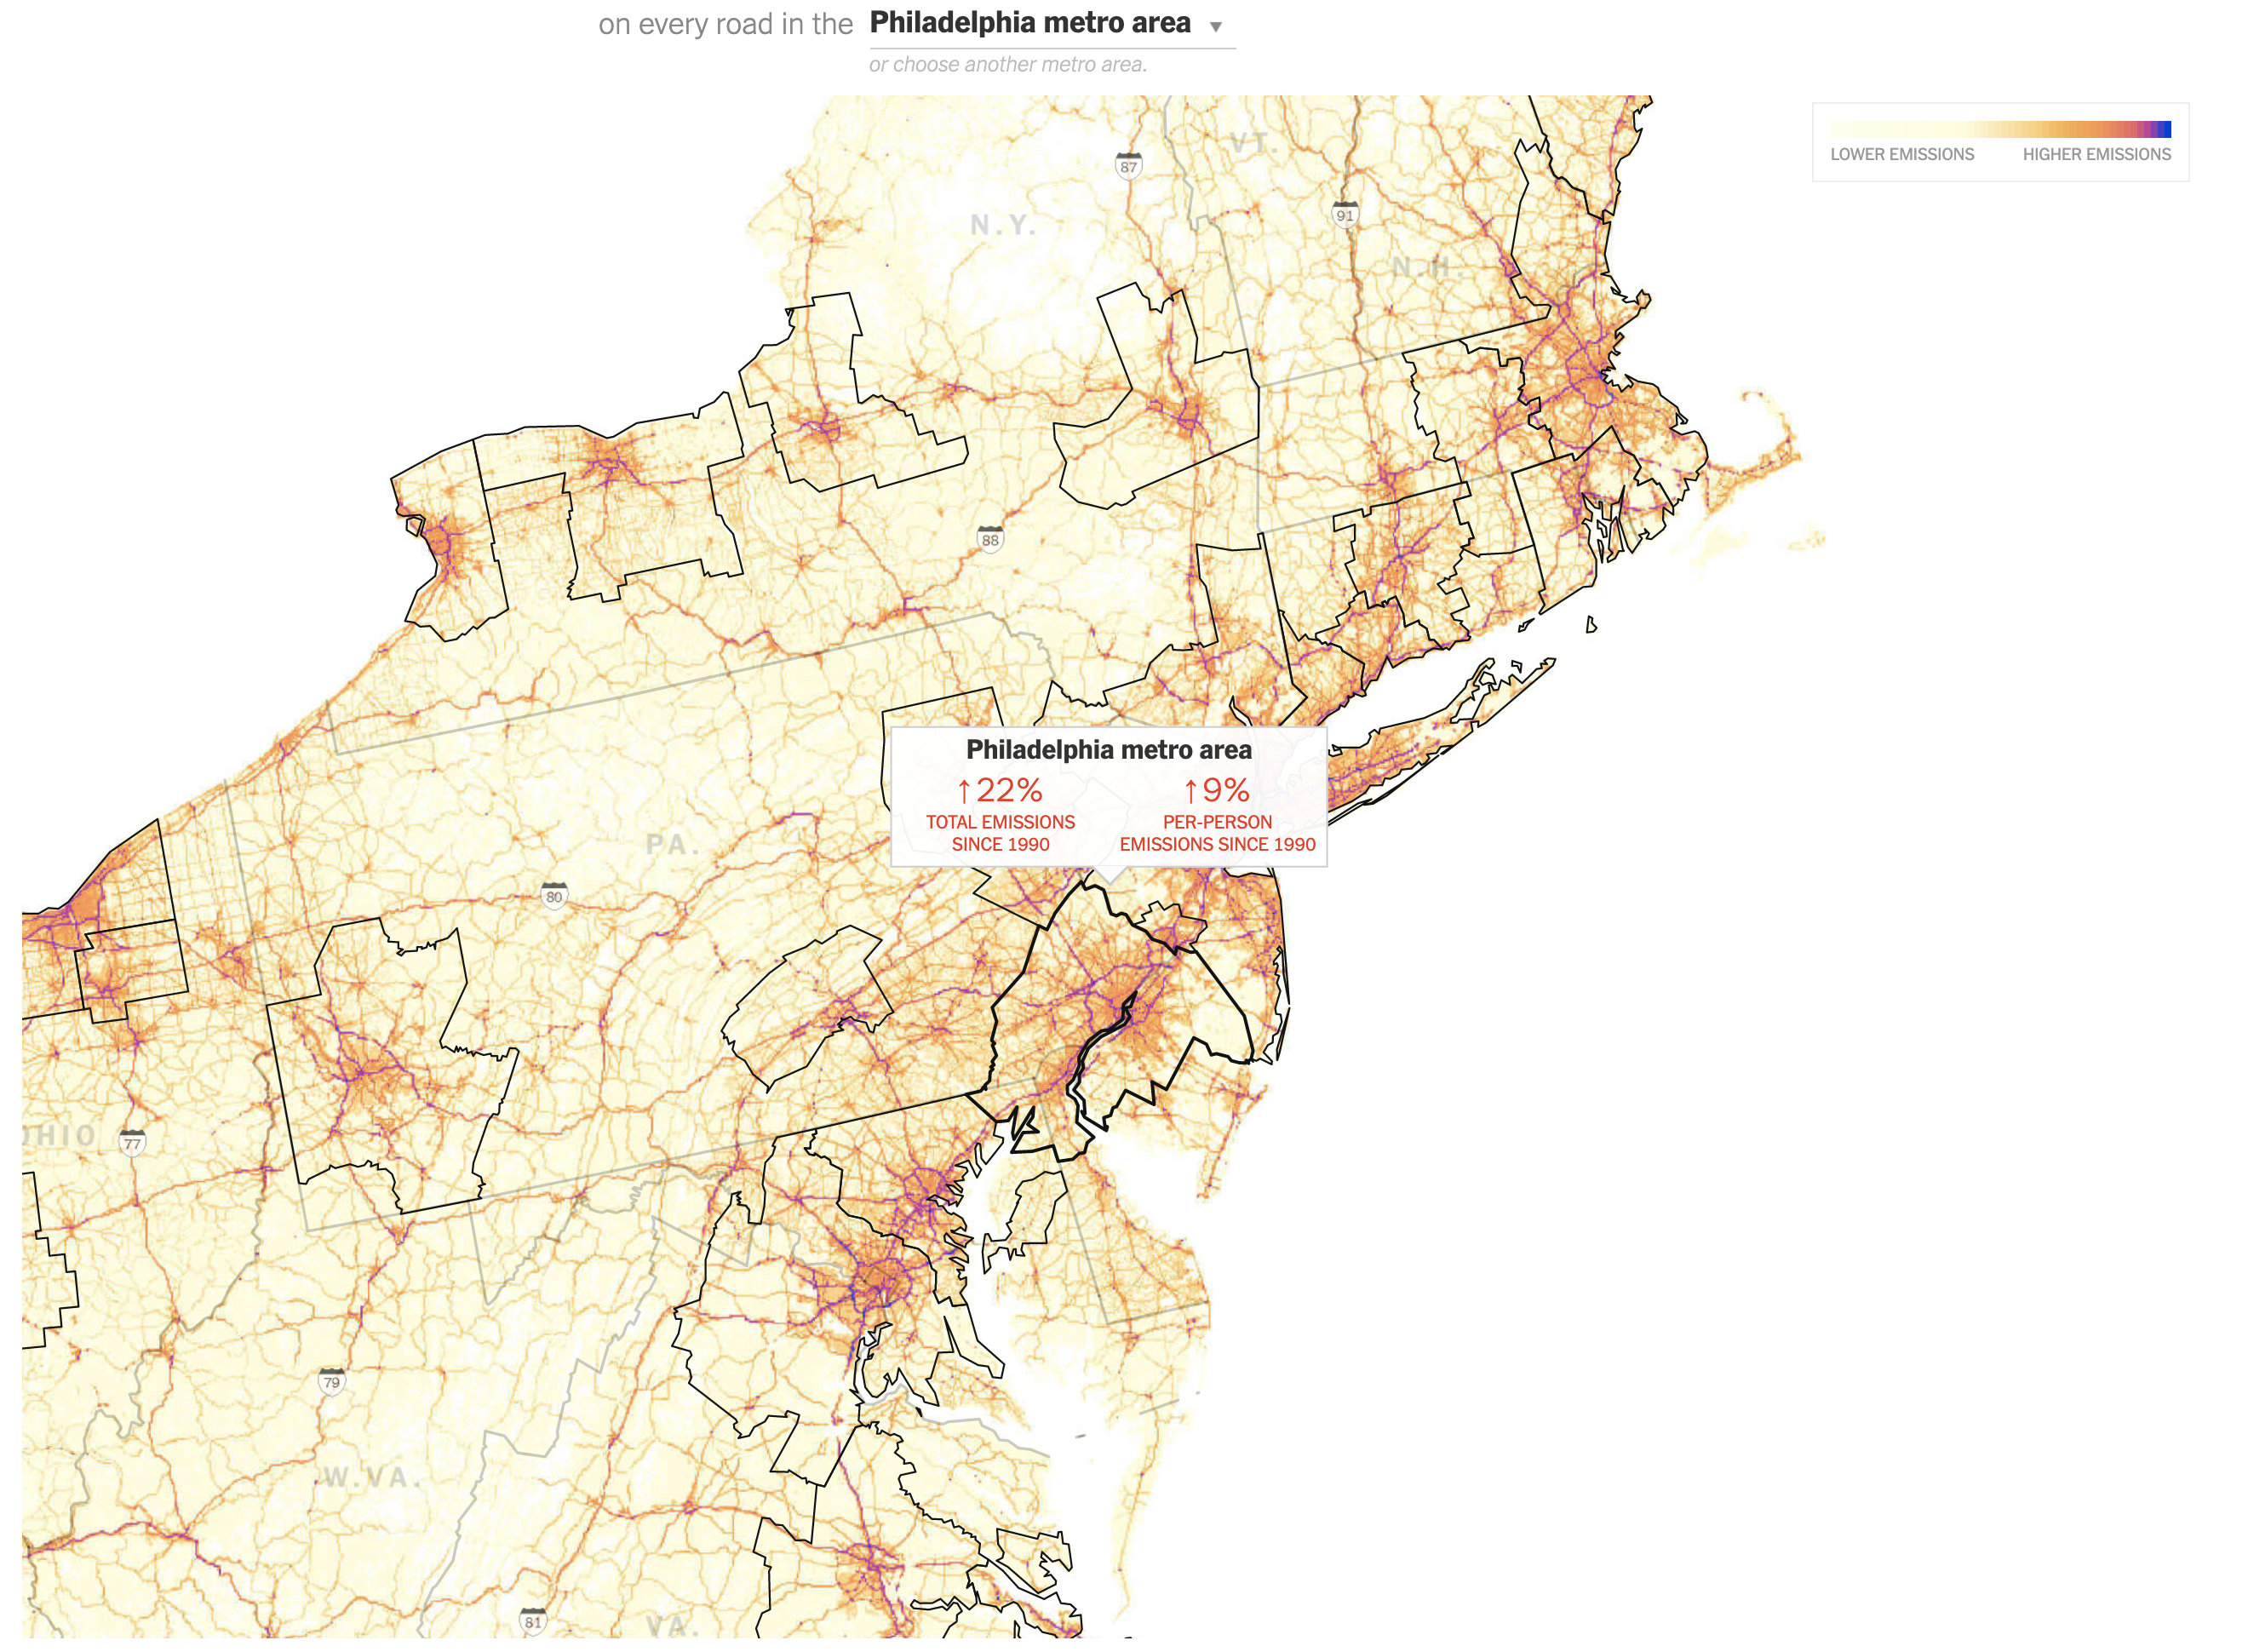
Each MSA is outlined in black and is selectable. The designers chose well by setting the state borders in a light grey to differentiate them from when the MSA crosses state lines, as the Philadelphia one does, encompassing parts of Pennsylvania, New Jersey, Delaware, and Maryland. A slight opacity appears when the user mouses over the MSA. Additionally a little box remains up once the MSA is selected to show the region’s key datapoints: the aggregate increase and the per capita increase. Again, for Philly, not good. But it could be worse. Phoenix, which surpassed Philadelphia proper in population, has seen its total emissions grow 291%, its per capita growth at 86%. My only gripe is that I wish I could see the entire US map in one view.
The piece also includes some nice charts showing how automobile emissions compare to other sources. Yet another spoiler: not good.
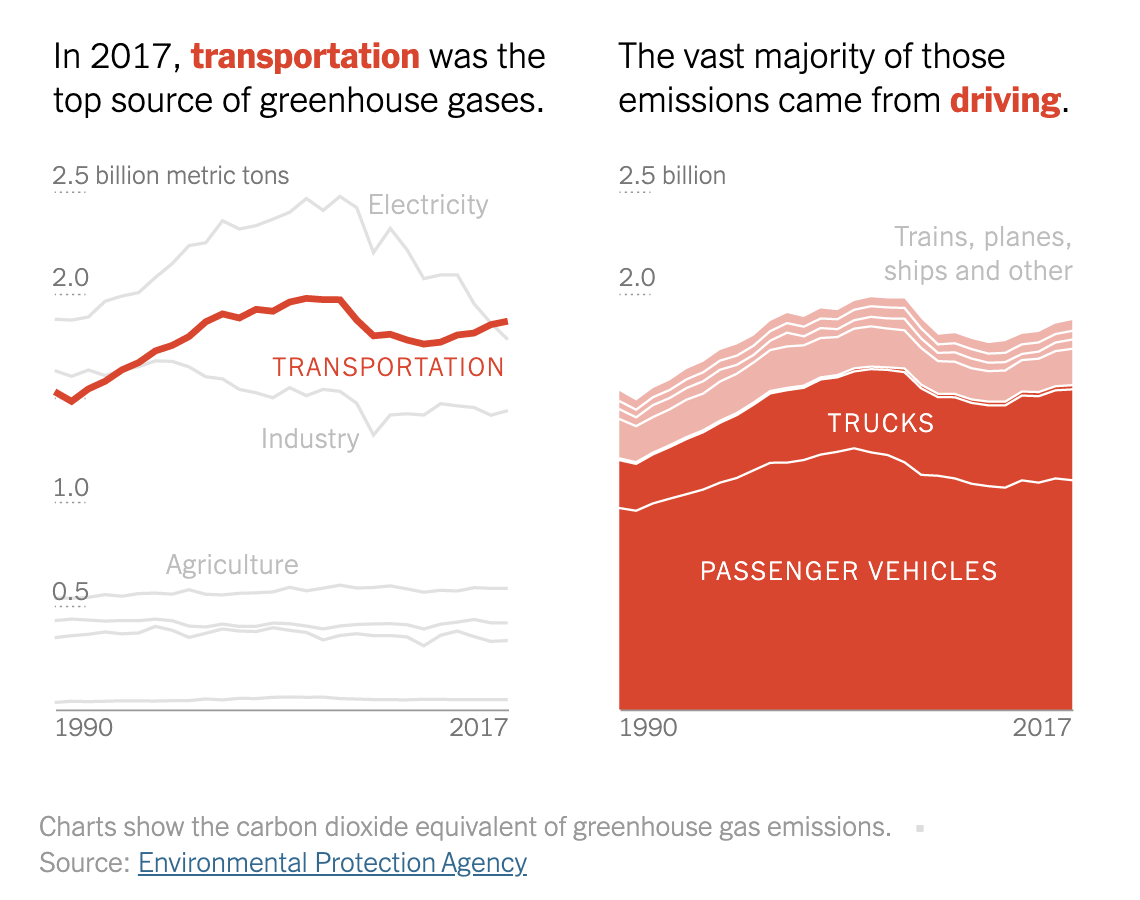
Since 1990, automobile emissions have surpassed both industry emissions and more recently electrical generation emissions (think shuttered coal plants). Here what I would have really enjoyed is for the share of auto emissions to be treated like that share of total emissions. That is, the line chart does a great job showing how auto emissions have surpassed all other sources. But the stacked chart does not do as great a job. The user can sort of see how passenger vehicles have plateaued, but have yet to decline whereas lorries have increased in recent years. (I would suspect due to increased deliveries of online-ordered goods, but that is pure speculation.) But a line chart would show that a little bit more clearly.
Finally, we have a larger line chart that plots each city’s emissions. As with the map, the key thing here is the aggregate vs. per capita numbers. When one continues to scroll through, the lines all change.
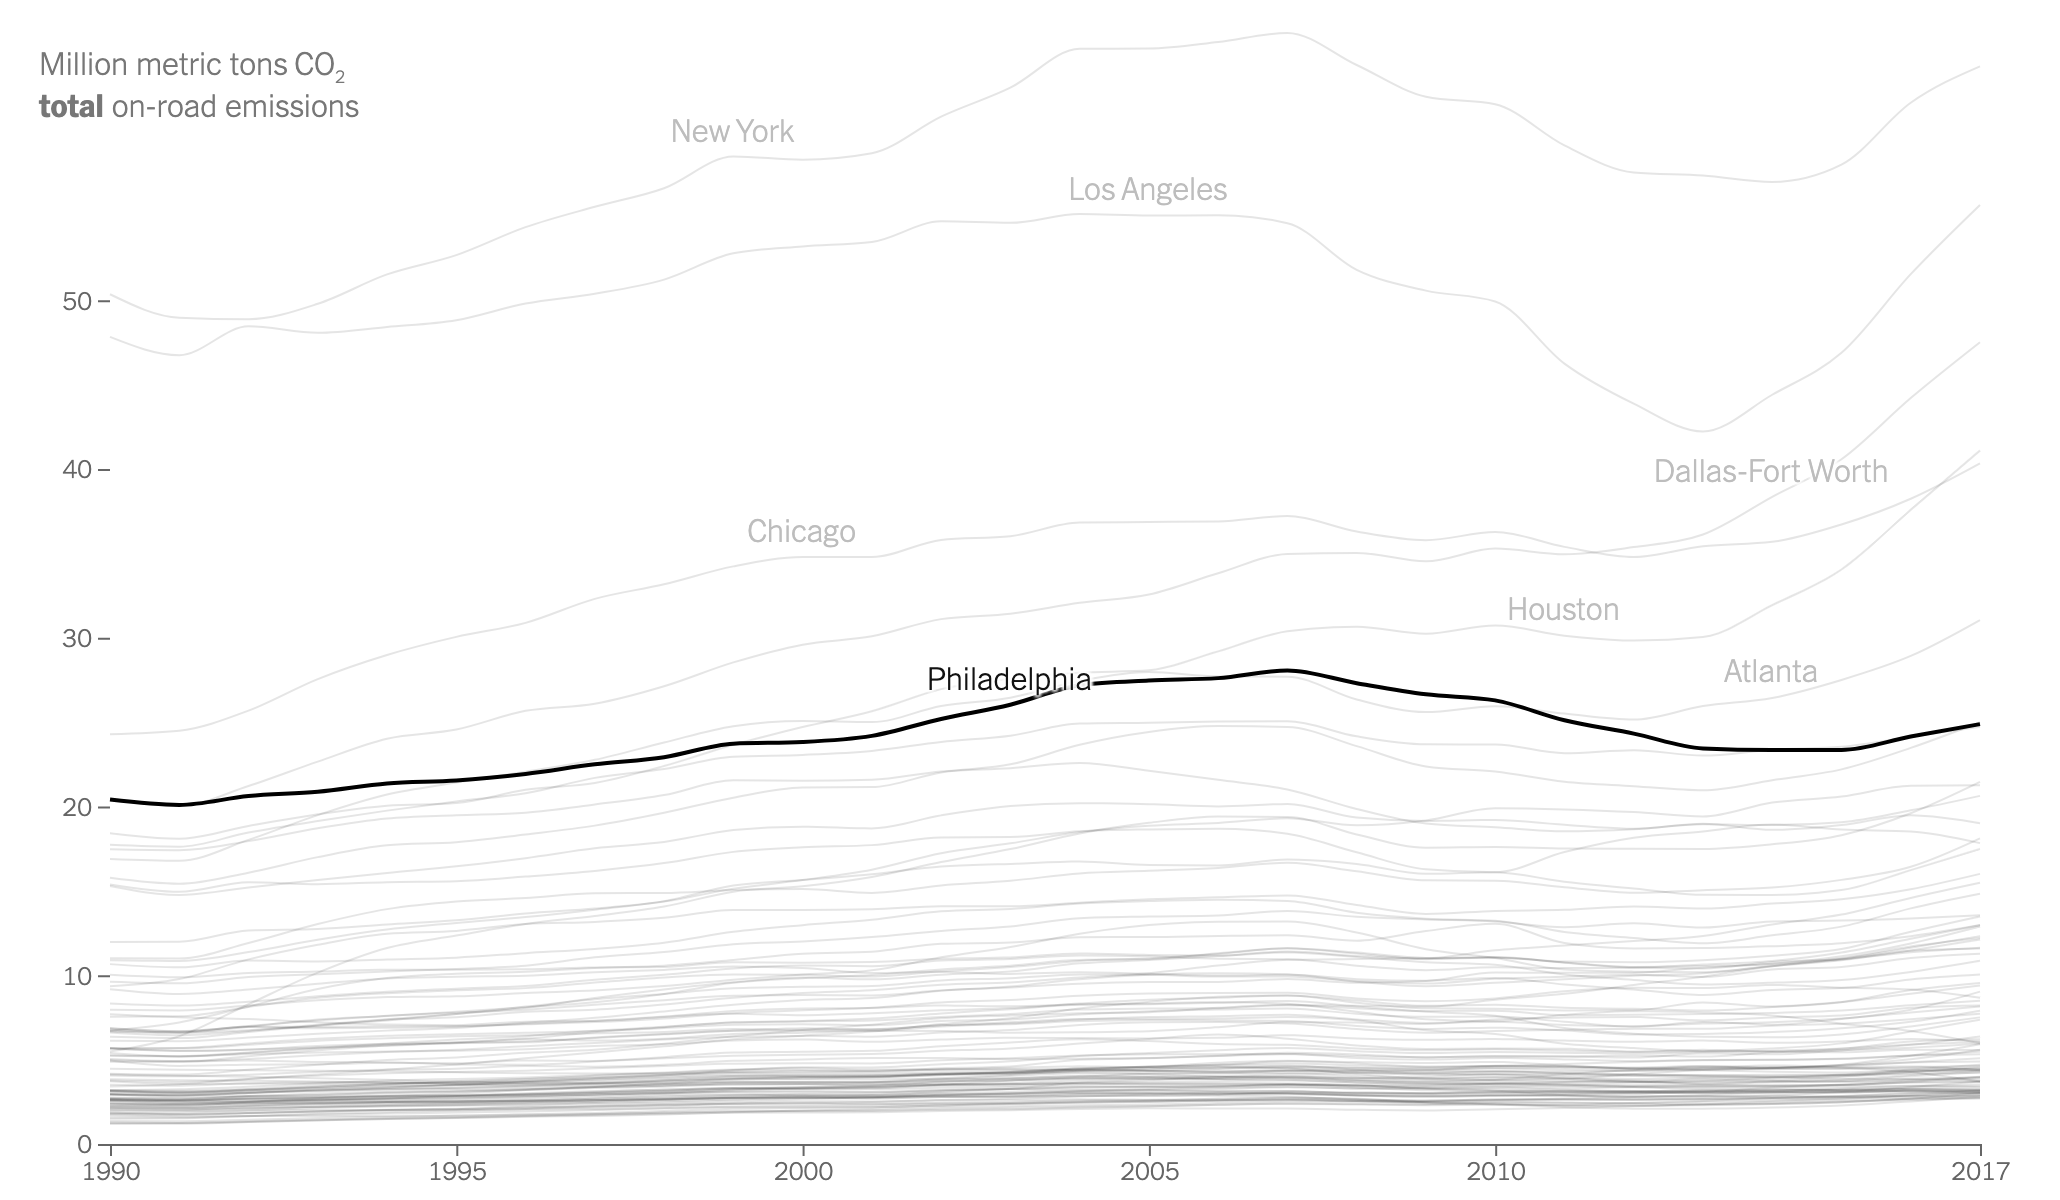
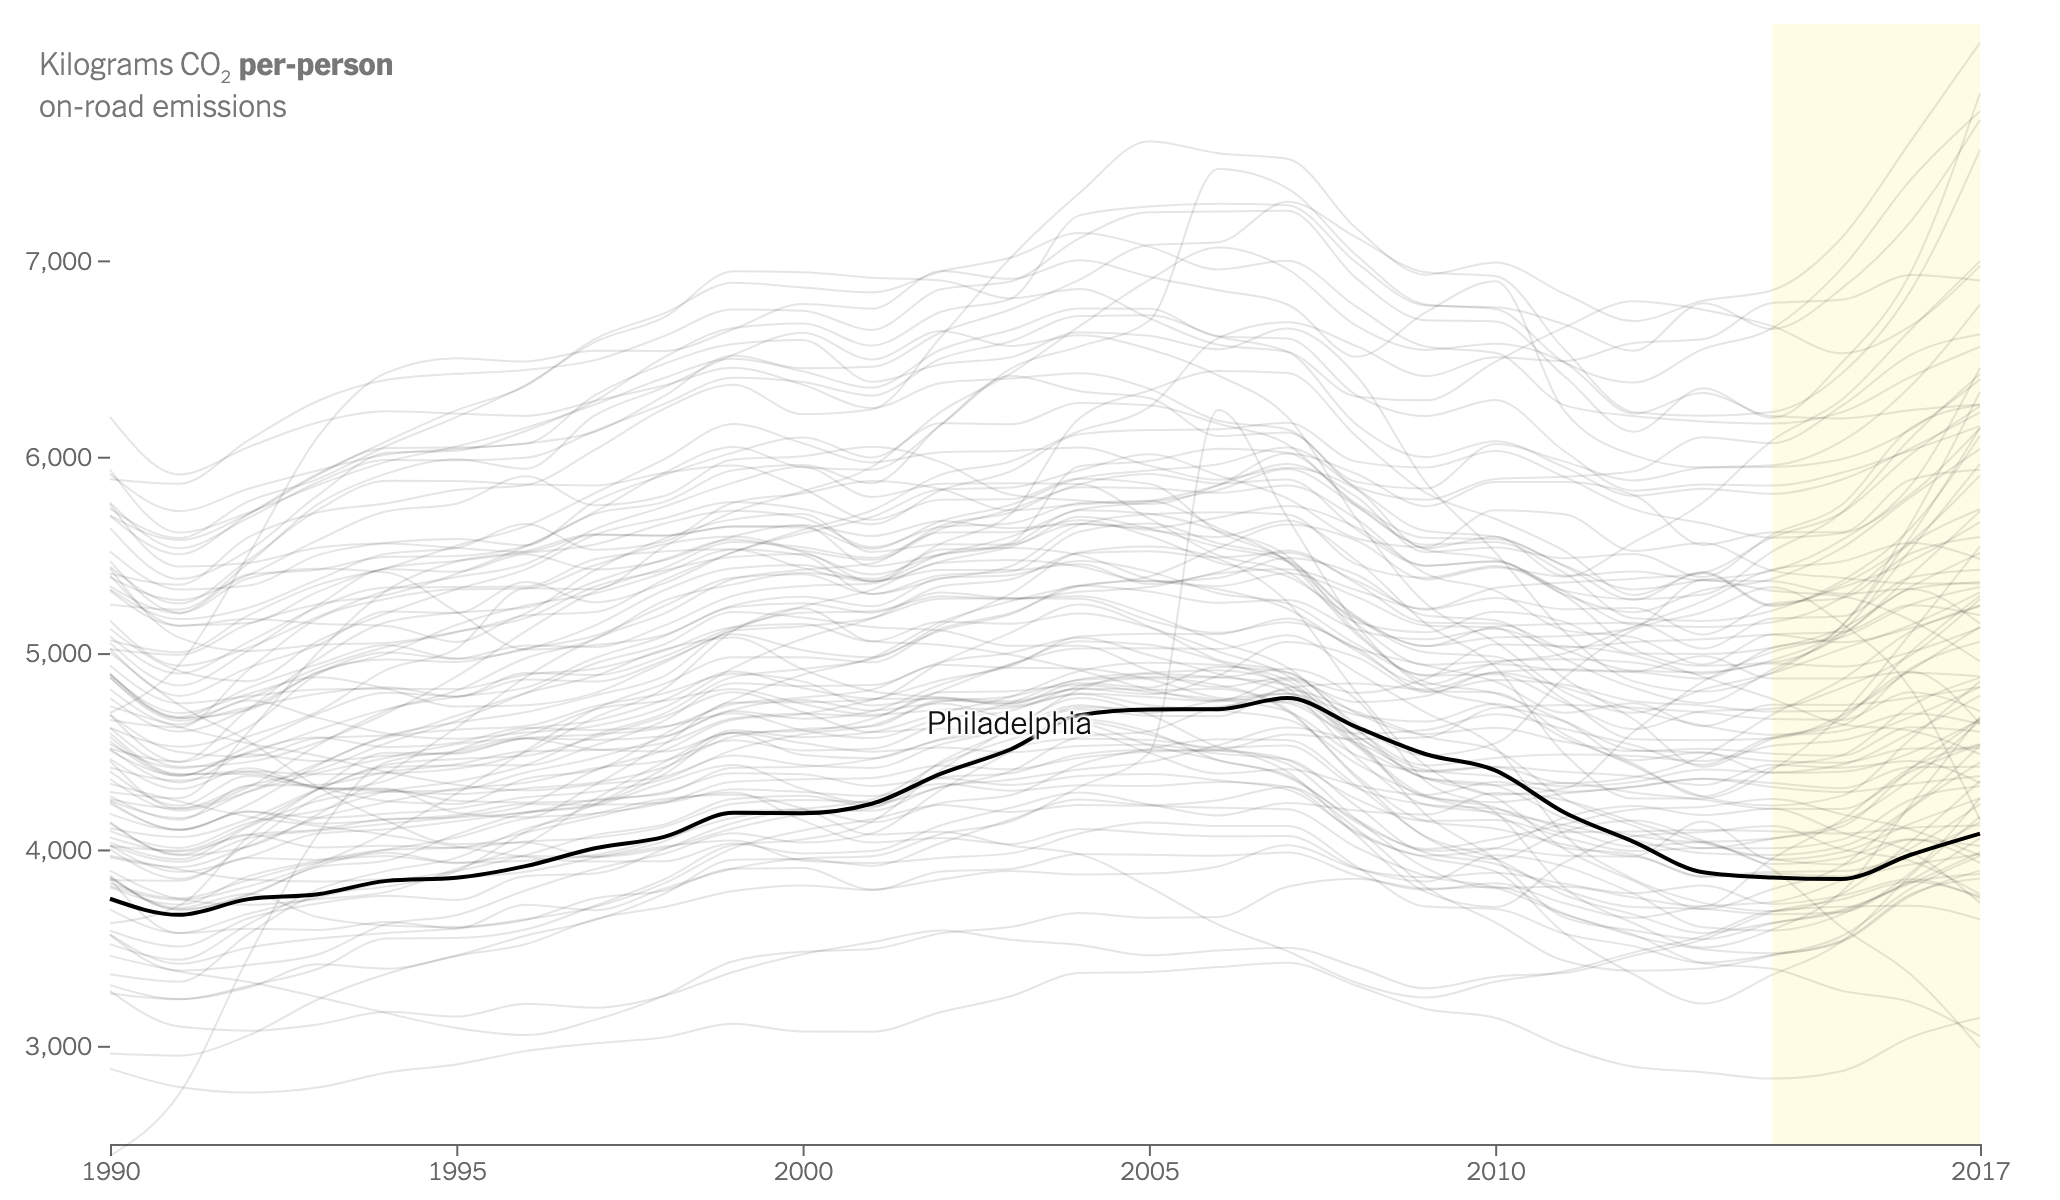
Very quickly one can see how large cities like New York have large aggregate emissions because millions of people live there. But then at a per capita level, the less dense, more sprawl-y cities tend to shoot up the list as they are generally more car dependent.
Credit for the piece goes to Nadja Popovich and Denise Lu.
Leave a Reply
You must be logged in to post a comment.