Election Day

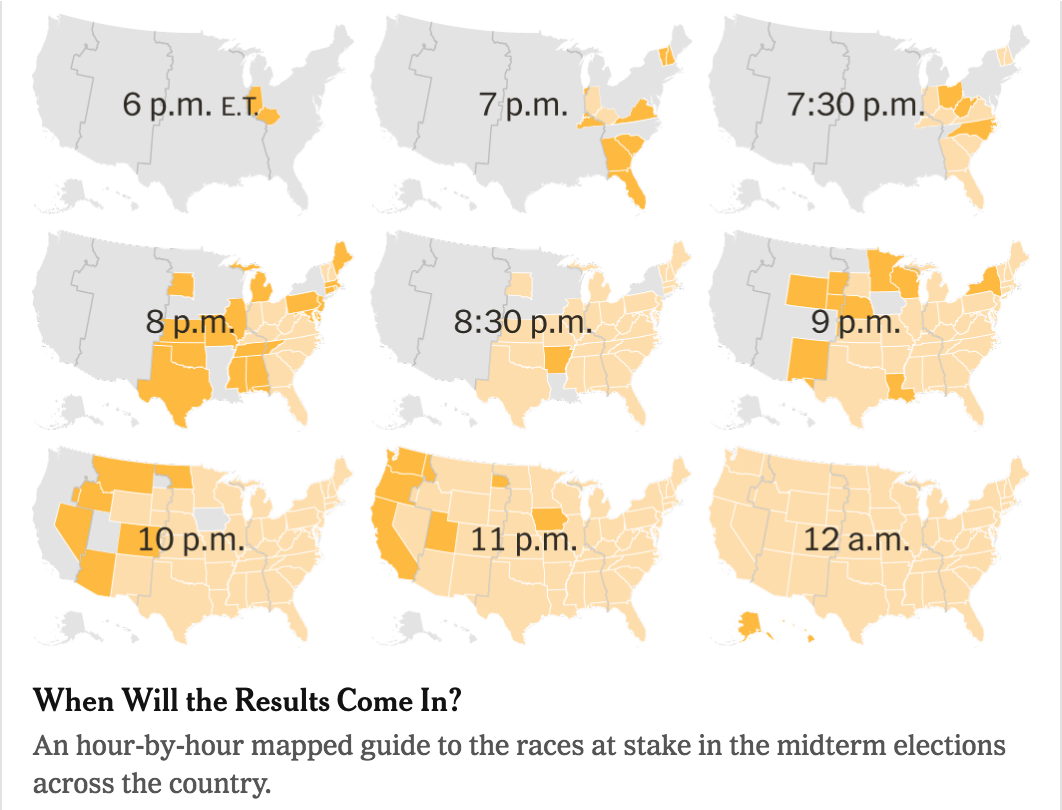
The 2018 midterm elections are finally here. Thankfully for political nerds like myself, the New York Times homepage had a link to a guide of when what polls close (as early as 18.00 Eastern).
I'm not saying you can't keep voting. You just can't keep voting here.
I’m not saying you can’t keep voting. You just can’t keep voting here.

It makes use of small multiples to show when states close and then afterwards which states have closed and which remain open. It also features a really nice bar chart that looks at when we can expect results. Spoiler: it could very well be a late night.

But what I really wanted to look at was some of the modelling and forecasts. Let’s start with FiveThirtyEight, because back in 2016 they were one of the only outlets forecasting that Donald Trump had a shot—although they still forecast Hillary Clinton to win. They have a lot of tools to look at and for a number of different races: the Senate, the House, and state governorships. (To add further interest, each comes in three flavours: a lite model, the classic, and the deluxe. Super simply, it involves the number of variables and inputs going into the model.)
The Deluxe House model

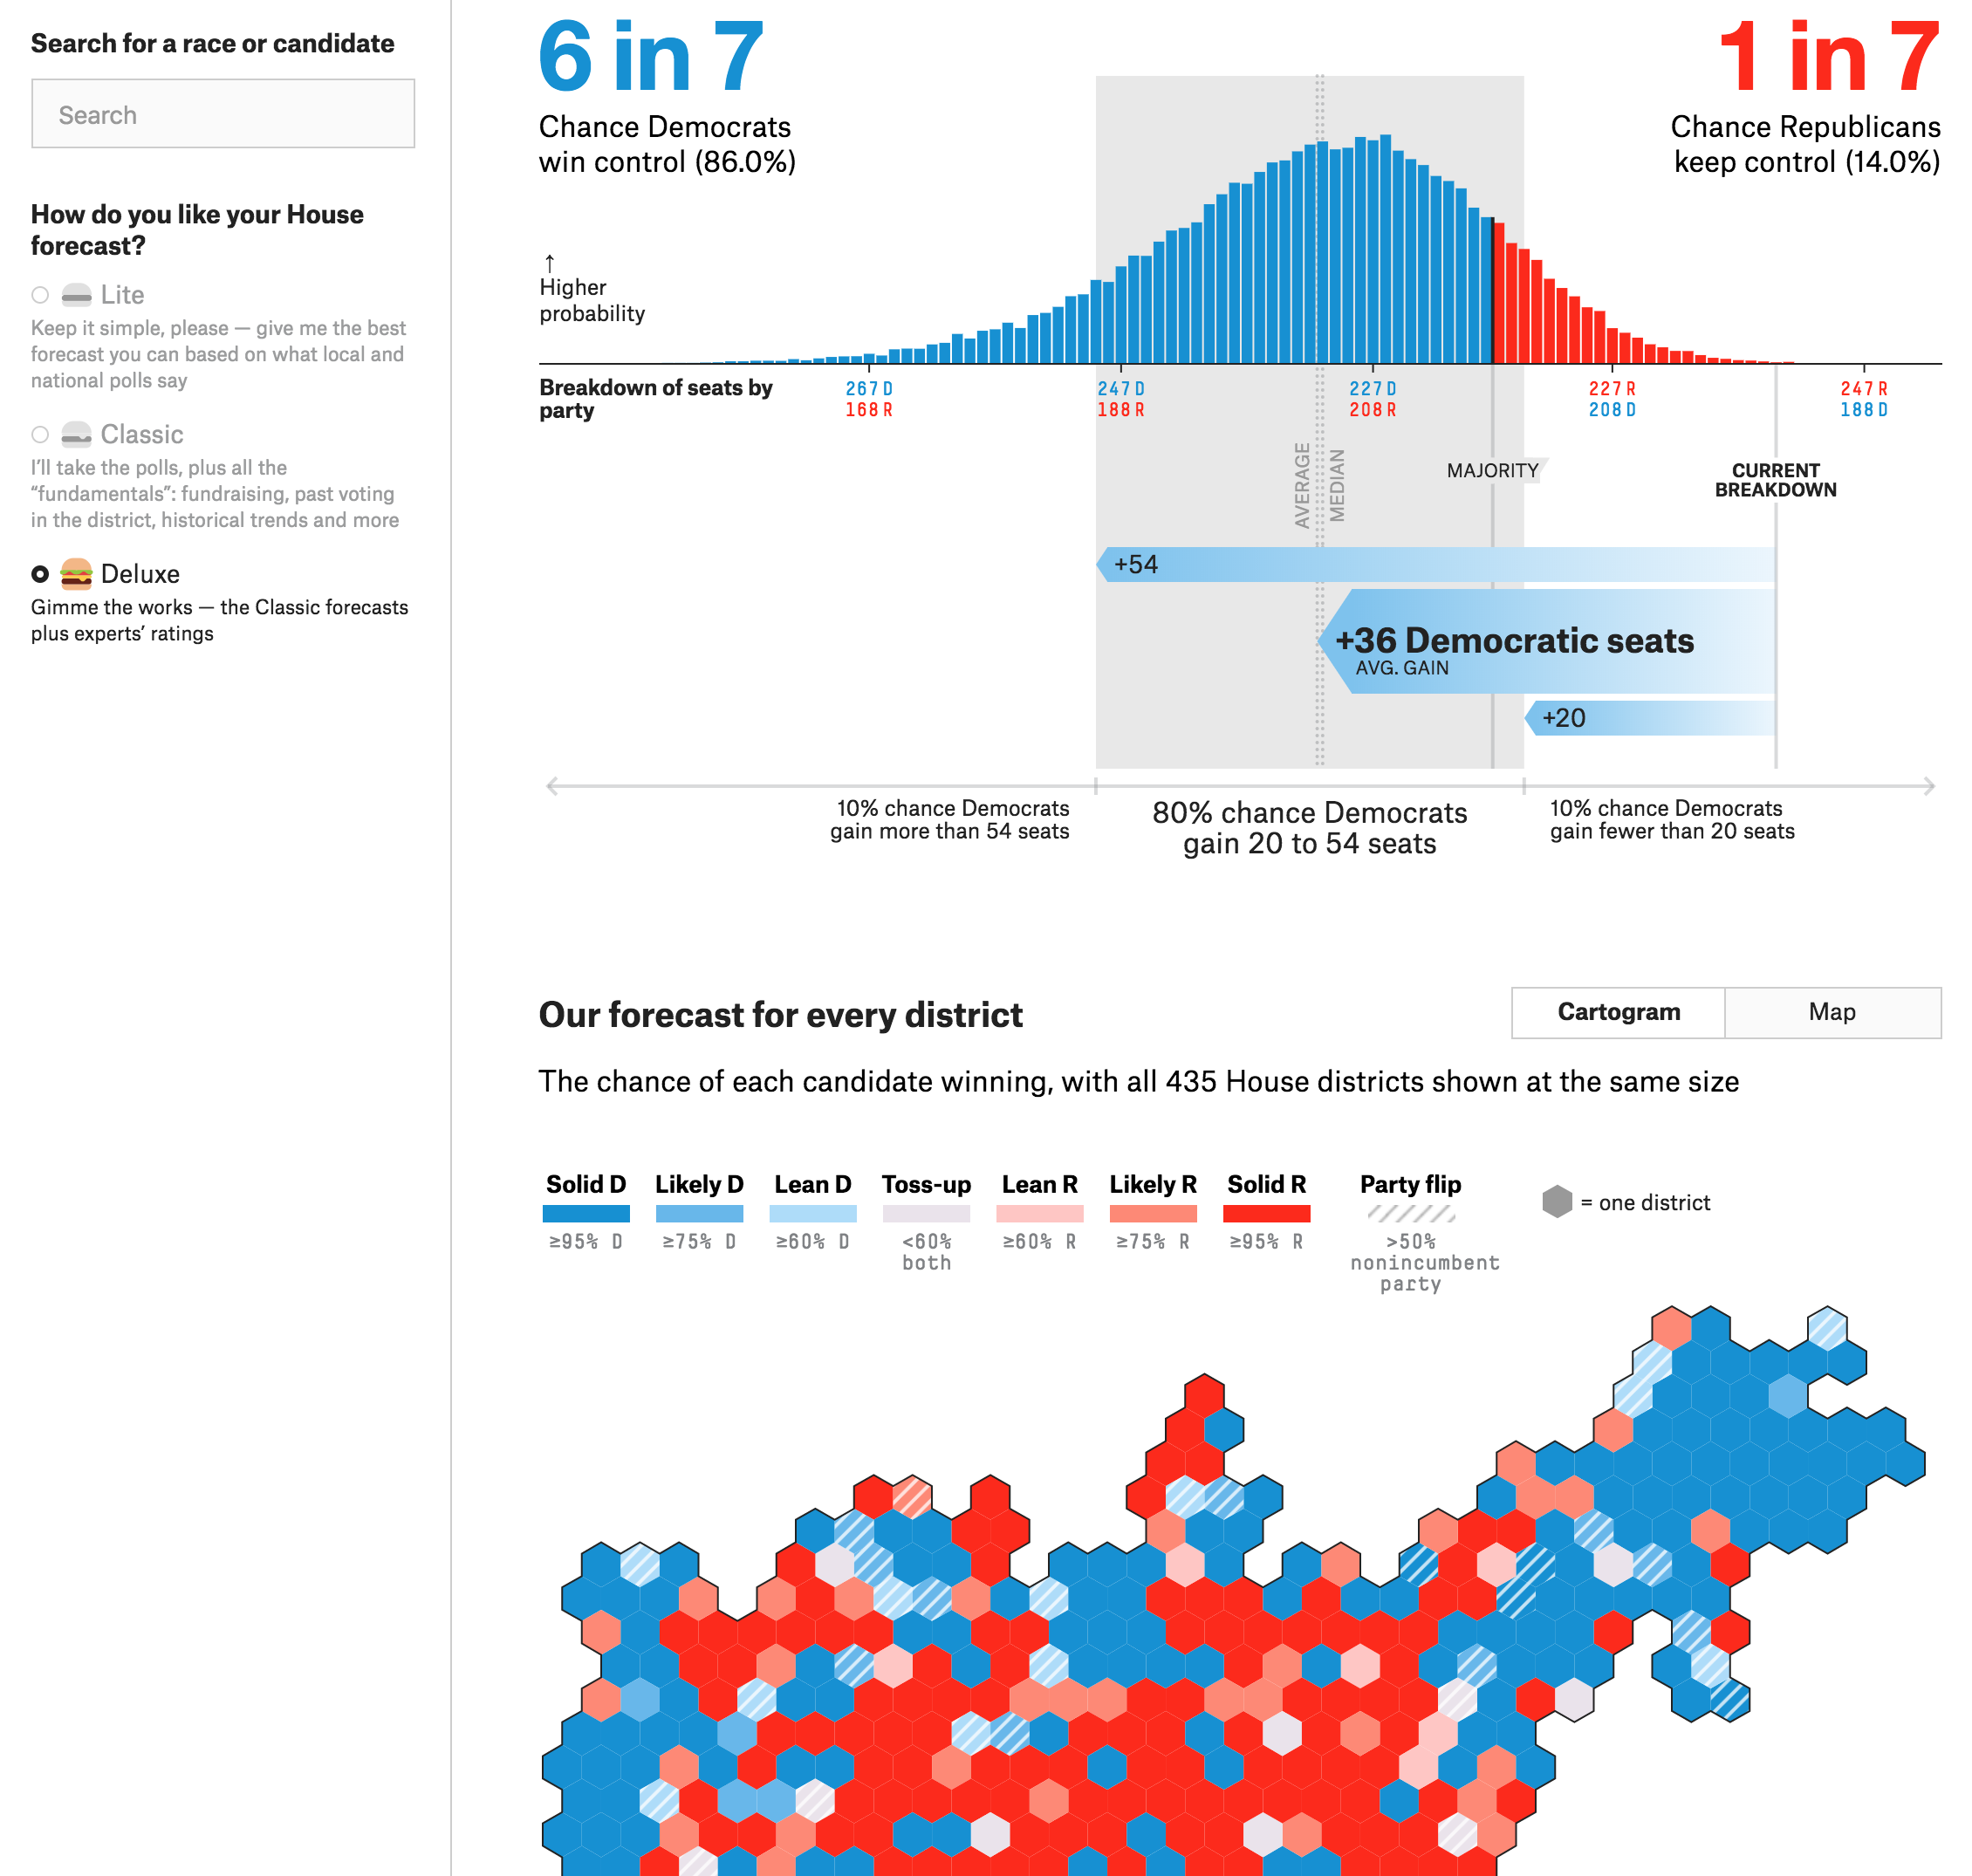
The above looks at the House race. The first thing I want to point out is the control on the left, outside the main content column. Here is where you can control which model you want to view. For the whimsical, it uses different burger illustrations. As a design decision, it’s an appropriate iconographic choice given the overall tone of the site. It is not something I would have been able to get away with in either place I have worked.

But the good stuff is to the right. The chart at the top shows the percentage of likelihood of a particular outcome. Because there are so many seats—435 are up for vote—every additional seat is between almost 0 and 3%. But taken in total, the 80% confidence band puts the likely Democratic vote tally at what those arrows at the bottom show. In this model that means picking up between 20 and 54 seats with a model median of 36. You will note that this 80% says 20 seats. The Democrats will need 23 to regain the majority. A working majority, however, will require quite a few more. This all goes to show just how hard it will be for the Democrats to gain a workable majority. (And I will spare you a review of the inherent difficulties faced by Democrats because of Republican gerrymandering after the 2010 election and census.) Keep in mind with FiveThirtyEight’s model that they had Trump with a 29% chance of victory on Election Day 2016. Probability and statistics say that just because something is unlikely, e.g. the Democrats gaining less than 20 seats (10% chance in this model), it does not mean it is impossible.

The cartogram below, however, is an interesting choice. Fundamentally I like it. As we established yesterday, geographically large rural districts dominate the traditional map. So here is a cartogram to make every district equal in size. This really lets us see all the urban and suburban districts. And, again, as we talked about yesterday, those suburban districts will be key to any hope of Democratic success. But with FiveThirtyEight’s design, compared to City Lab’s, I have one large quibble. Where are the states?

As a guy who loves geography, I can roughly place, for example, Kentucky. So once I do that I can find the Kentucky 6th, which will have a fascinating early closing race that could be a predictor of blue waviness. But where is Kentucky on the map? If you are not me, it might be difficult to tell. So compared to yesterday’s cartogram, the trade-off is that I can more easily see the data here, but in yesterday’s piece I could more readily find the district for which I wanted the data.

Over on the Senate side, where the Democrats face an even more uphill battle than in the House, the bar chart at the top is much clearer. You can see how each seat breakdown, because there are so fewer seats, has a higher percentage likelihood of success.
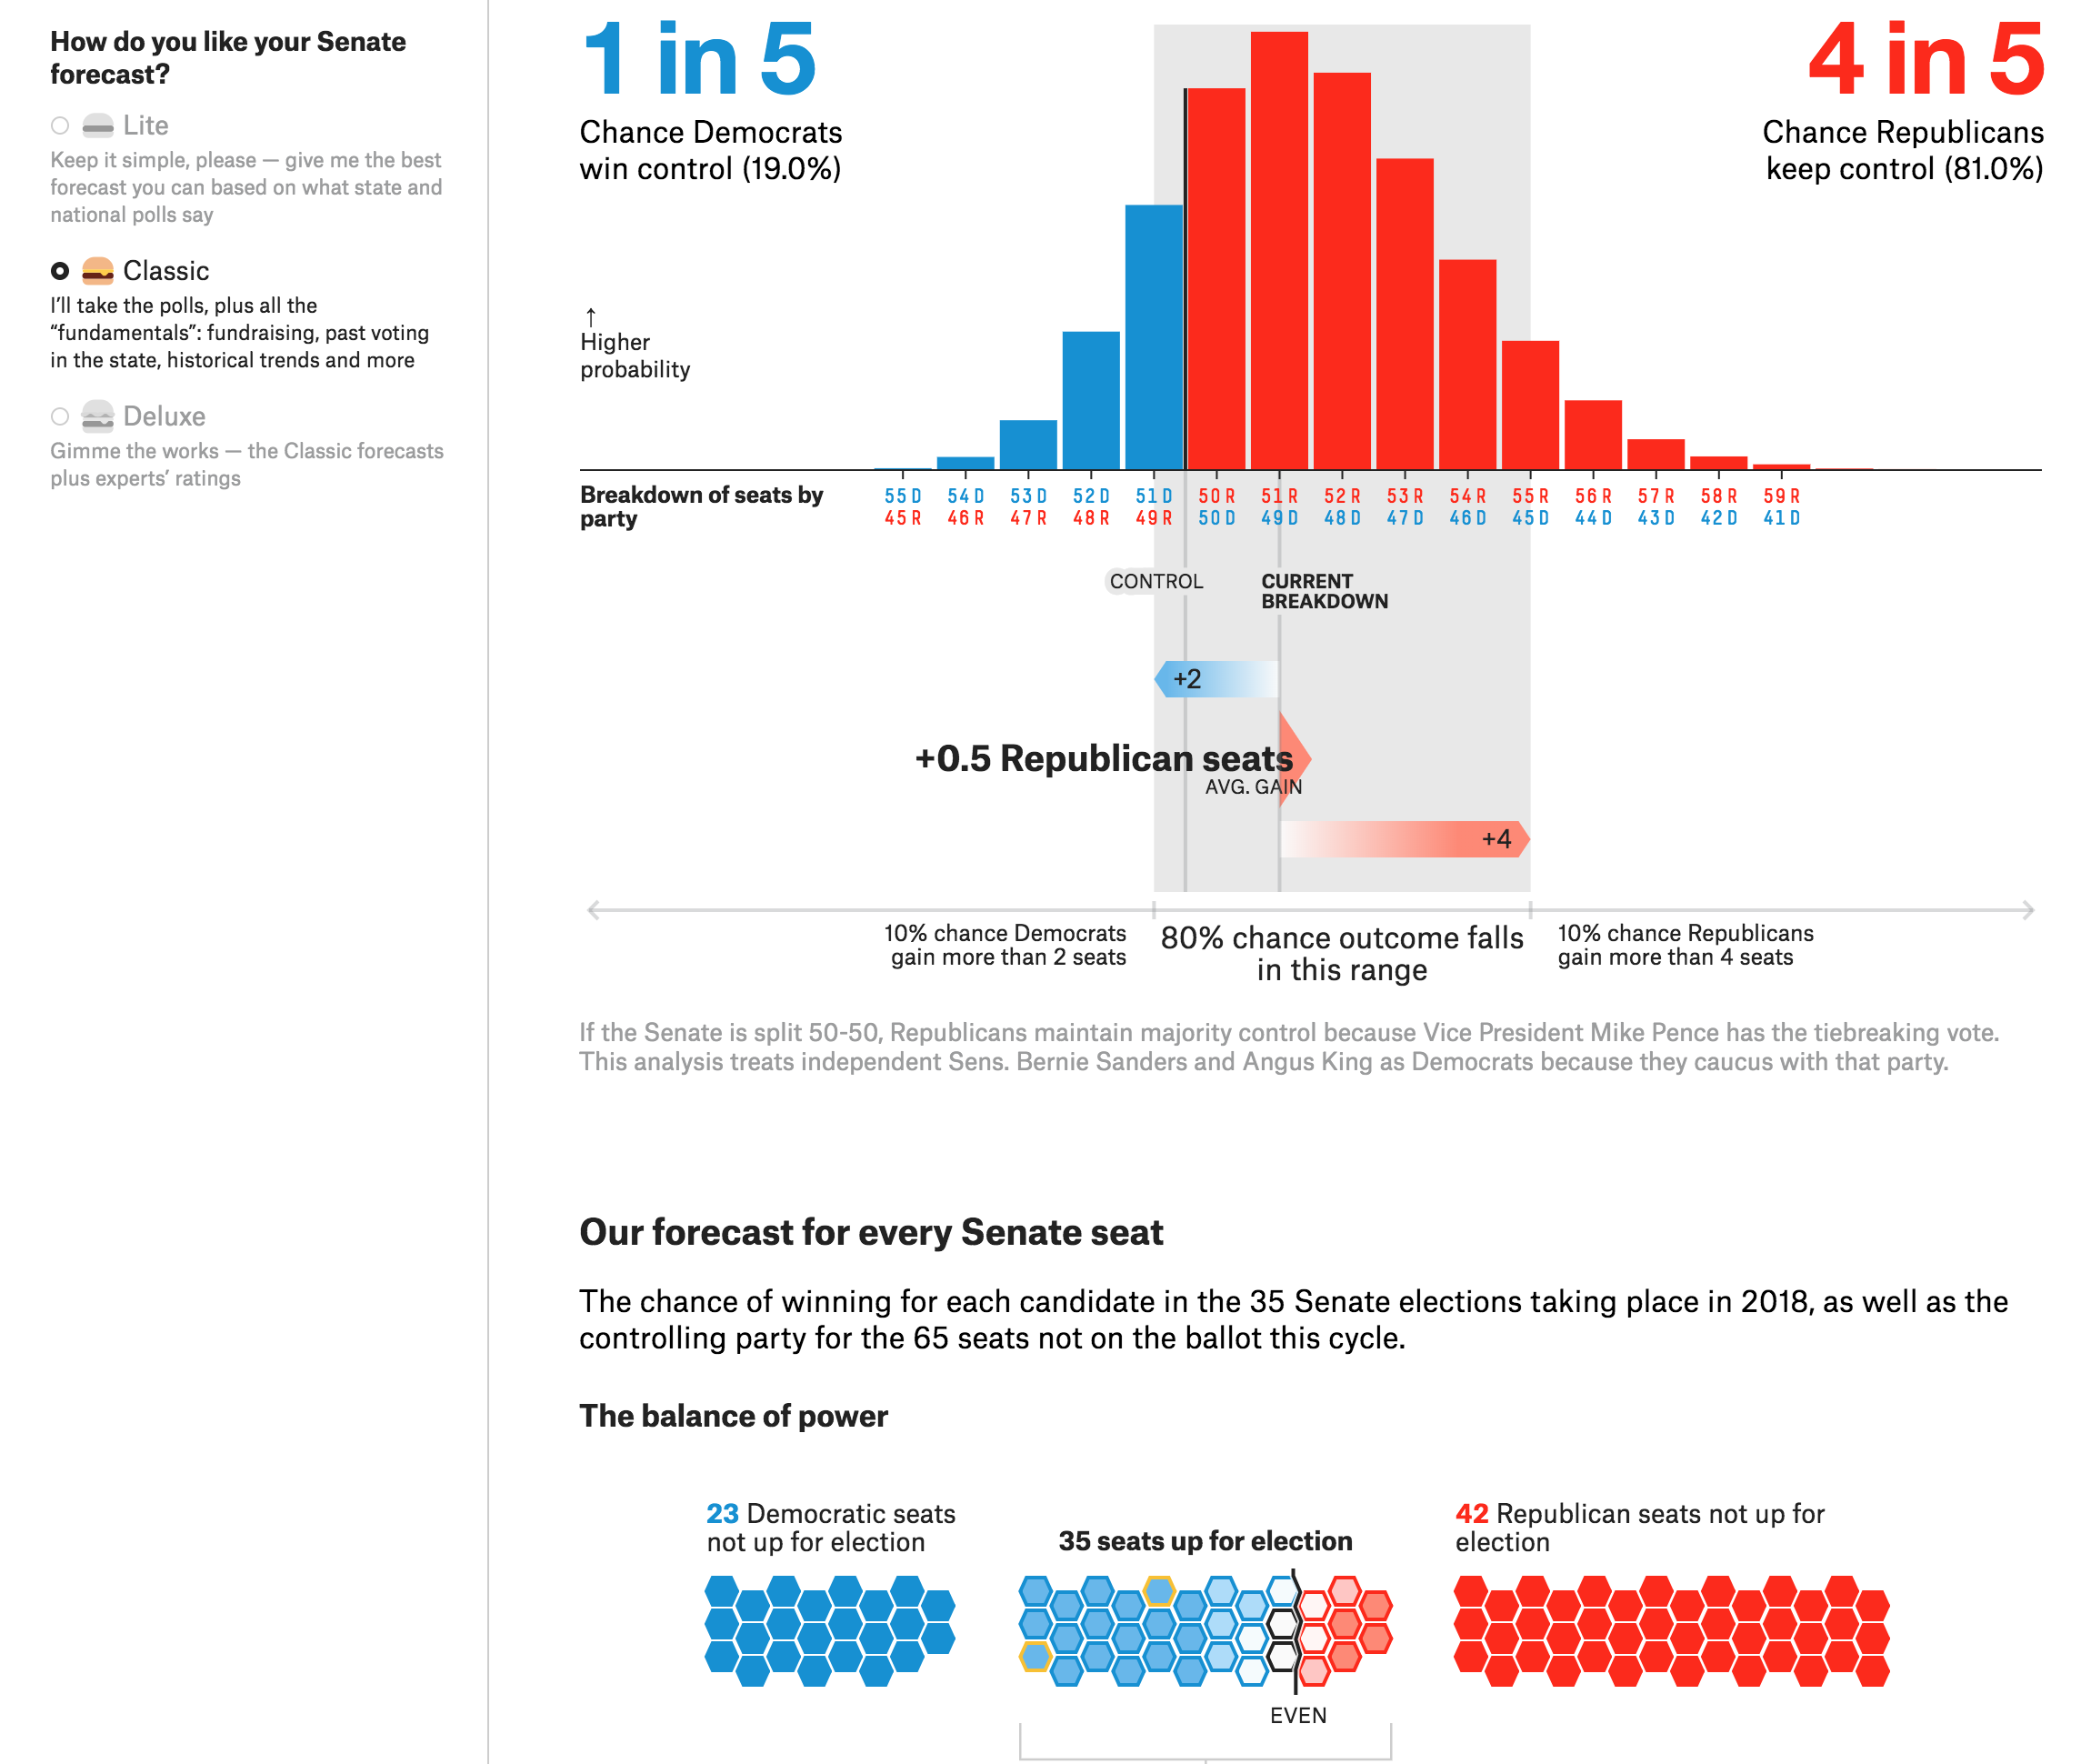
In the Senate, things don't look good for the Democrats
In the Senate, things don’t look good for the Democrats

The take away? Yeah, it looks like a bad night for the Democrats. The only question will be how bad does it go? A good night will basically be the vote split staying as it is today. A great night is that small chance—20%, again compared to Trump’s 29% in 2016—the Democrats narrowly flip the Senate.

Below the bar chart is a second graphic, a faux-cartogram with a hexagonal bar chart of sorts sitting above it. This shows the geographic distribution of the seats. And you can quickly understand why the Democrats will not do well. They are defending a lot more seats in competitive states than Republicans. And a lot of those seats are in states that Trump won decisively in 2016.
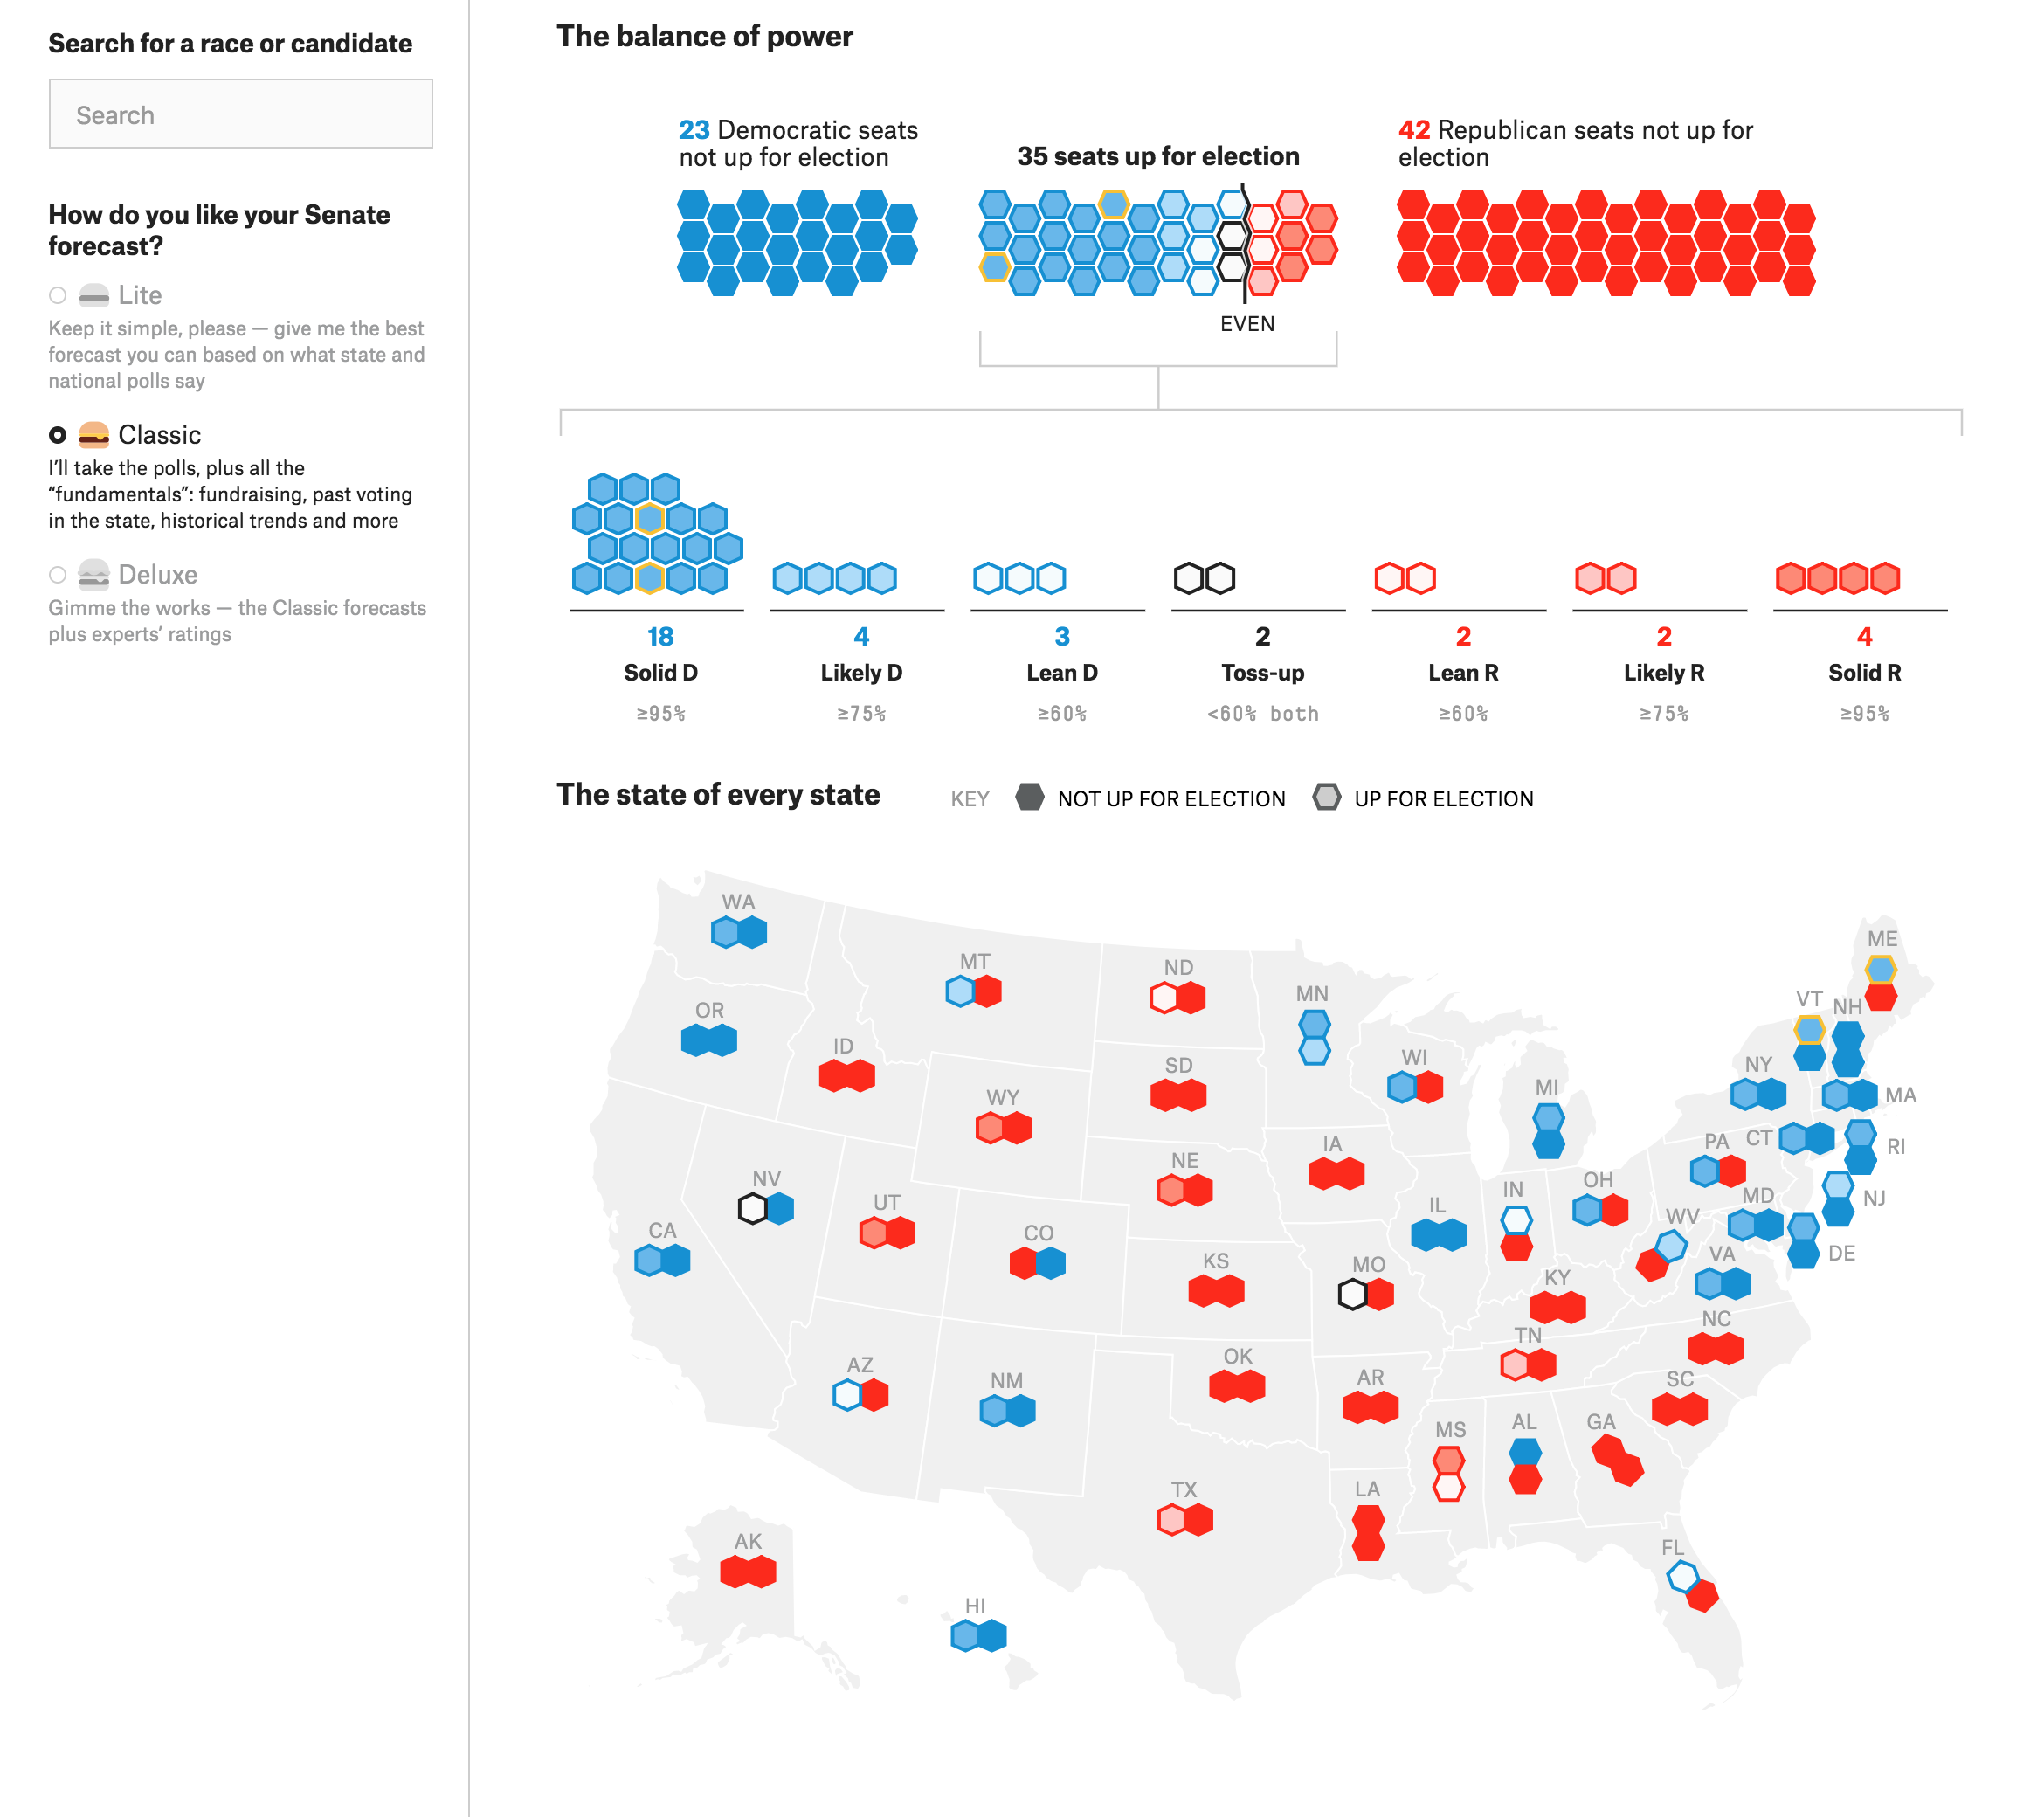
That's a lot of red states…
That’s a lot of red states…

I have some ideas about how this type of data could be displayed differently. But that will probably be a topic for another day. I do like, however, how those seats up for election are divided into their different categories.

Unfortunately my internet was down this morning and so I don’t have time to compare FiveThirtyEight to other sites. So let’s just wrap this up.

Overall, what this all means is that you need to go vote. Polls and modelling and guesswork is all for nought if nobody actually, you know, votes.

Credit for the poll closing time map goes to Astead W. Herndon and Jugal K. Patel.

Credit for the FiveThirtyEight goes to the FiveThirtyEight graphics department.

Where People Vote

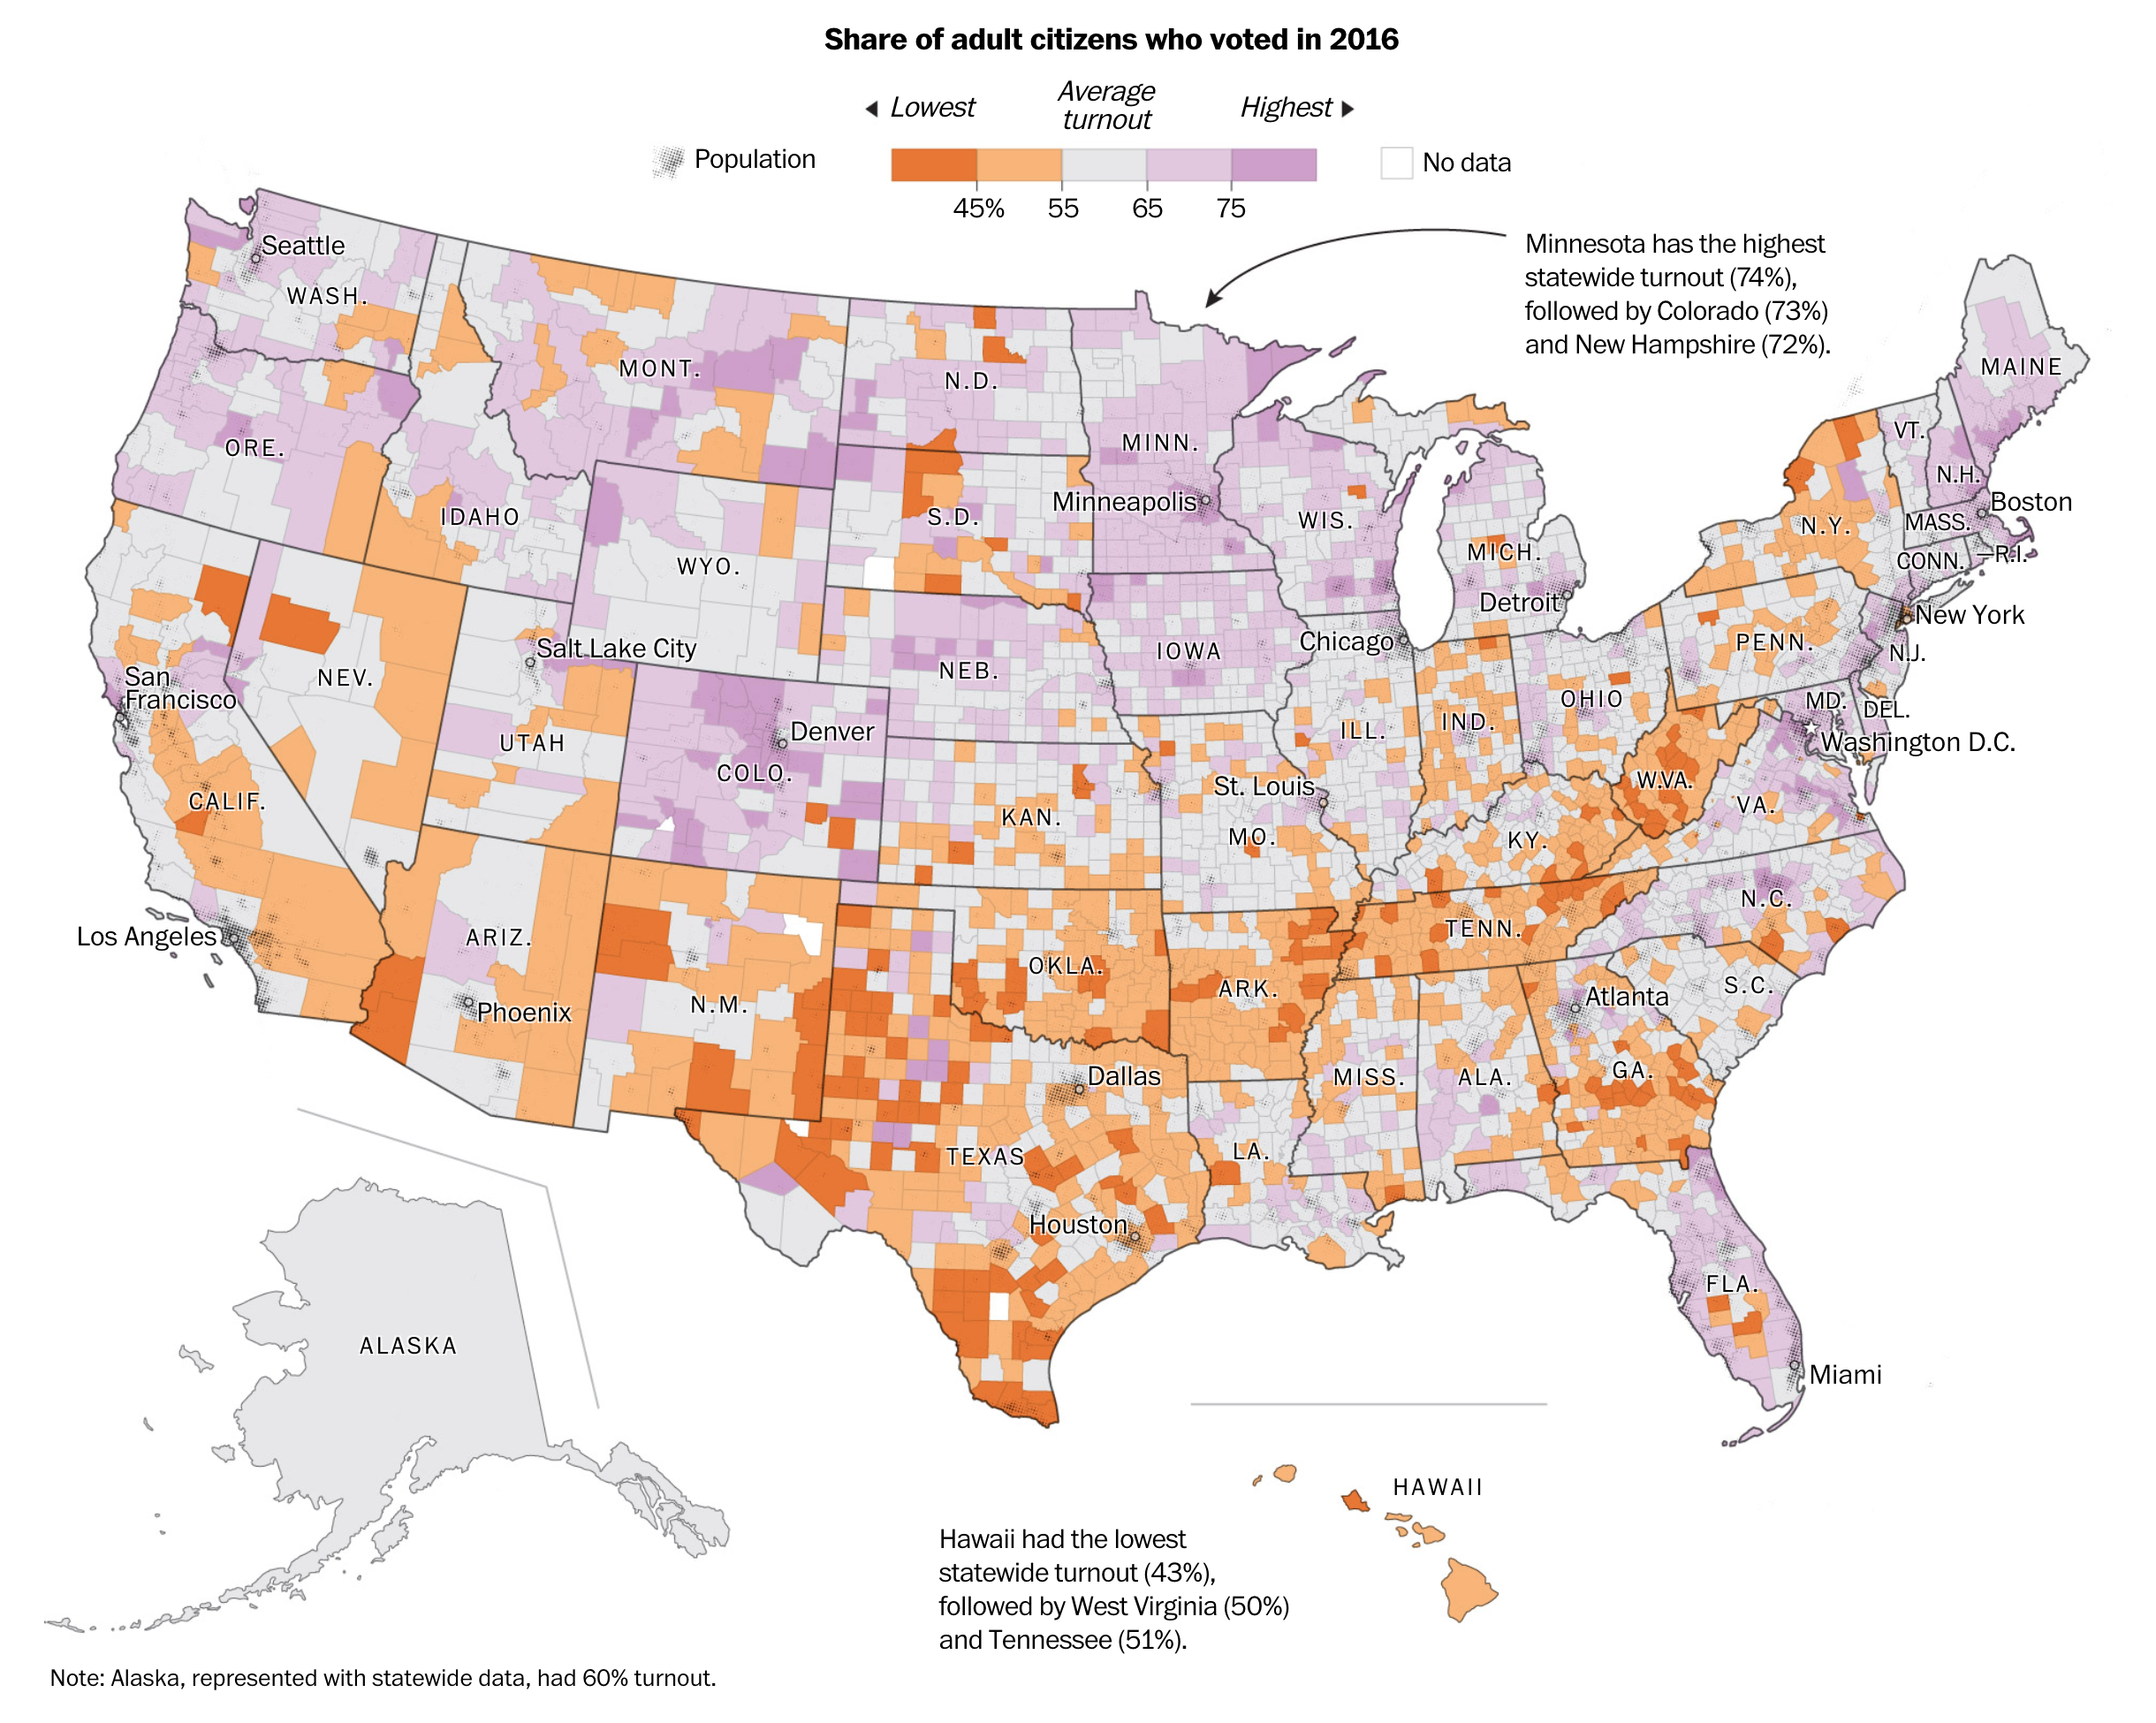
Voting is not compulsory in the United States. Consequently a big part of the strategy for winning is increasing your voters’ turnout and decreasing that of your opponent. In other words, demotivate your opponent’s supporters whilst simultaneously motivating your own base. But what does that baseline turnout map look like? Well, thankfully the Washington Post created a nice article that explores who votes and who does not. And there are some clear geographic patterns.

A lot of people don't vote
A lot of people don’t vote

The piece uses this map as the building block for the article. It explores the difference between the big rural counties that dominate the map vs. the small urban counties where there can be hundreds of thousands of voters, a large number of whom do not vote. It uses the actual map to compare states that differ drastically. For example, look at the border between Tennessee and North Carolina. On the Tennessee side you have counties with low turnout abutting North Carolinian counties with high turnout.

And towards the end of the piece, the article reuses a stripped down version of the map. It overlays congressional districts that will likely be competitive and then has the counties within that feature low turnout highlighted.

Overall the piece uses just this one map to walk the reader through the geography of voting. It’s really well done.

Credit for the piece goes to Ted Mellnik, Lauren Tierney and Kevin Uhrmacher.

Pages of Polls and Forecasts

We are now one week away from the midterm elections here in the United States. Surprisingly, we are going to be looking at election-y things over the course of the next week or so. But before we delve into that, I wanted to focus on the homepage for FiveThirtyEight, the below screenshot is from my laptop.

The homepage as of 30 October

The reason I wanted to call attention to it is that right-most column of content. The site does a great job of succinctly providing the latest forecasts and polling number on the two main midterm results, federal representation in the House and Senate, along with polling numbers for President Trump.

Starting from the bottom, the polling numbers chart works really well. It clearly and effectively shows the latest approval/disapproval numbers and their longer term trend whilst providing a link to a page of deeper data. It’s very effective.

Moving up we have the House forecasts. These are tricker to see because so many of the more urban and suburban districts are inherently small geographically ergo very difficult to see in a small map. But the map does the job of at least providing some data along with the key takeaway of the odds of the Democrats flipping or Republicans retaining the House. Again, not surprisingly, it offers a link into the data.

The Senate map is the one where I have the most difficulty. Now when we get to the actual page—hopefully later this week—the map shown makes perfect sense because it exists in a large space. That space is needed to show two hexagons that represent each state’s two senators. But, similar to the problem with the House districts, the Northeast is so geographically cramped that it is difficult to show the senators from Maine through Maryland clearly. I wonder if some of the other visualisations on their Senate forecast page would have been a better choice. However, they do at least provide those odds at the top of the graphic.

Credit for the piece goes to the FiveThirtyEight design department.

First Florence, Now Michael

You may recall a few weeks ago there was a hurricane named Florence that slammed into the Carolina before stalling and dumping voluminous amounts of rain that inundated inland communities in addition to the damage by the storm surge in the coastal communities. At the time I wrote about a New York Times piece that explored housing density in coastal areas, specifically around the Florence impact area.

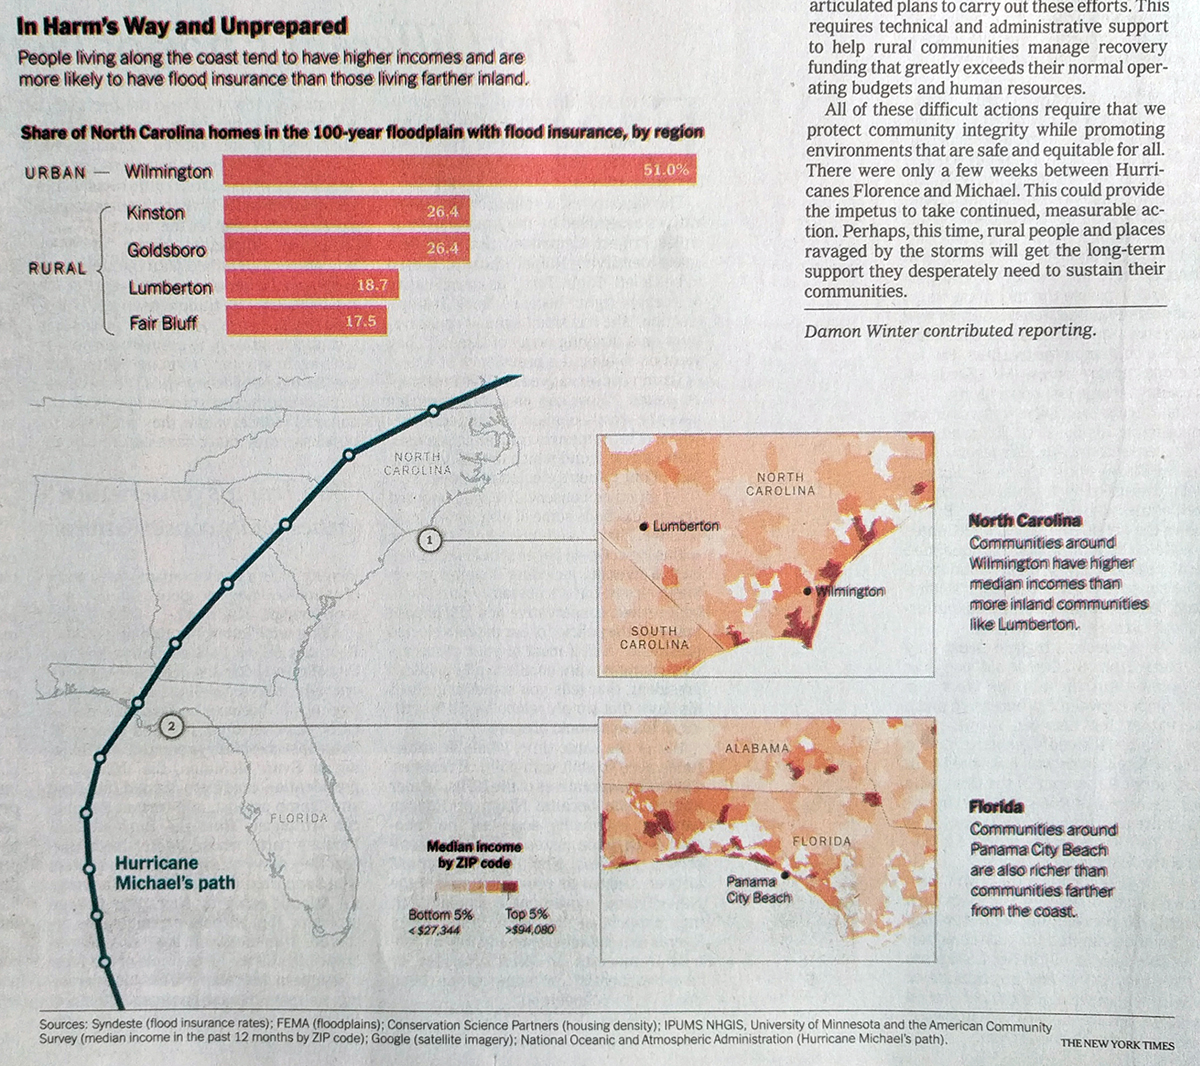
Well today the New York Times has a print graphic about something similar. It uses the same colours and styles, but swaps in a different data set and then uses a small multiple setup to include the Florida Panhandle. Of course the Florida Panhandle was just struck by Hurricane Michael, a Category 4 storm when it made landfall.

Of course that track for Michael also brought significant rainfall to the areas recovering from Florence for a double whammy

This one instead looks at median income per zip code to highlight the disparity between those living directly on the coast and those inland. In these two most recent landfall areas, the reader can clearly see that the zip codes along the coast have far greater incomes and, by proxy, wealth than those just a few zip codes further inland.

The problem is that rebuilding lives, communities, and infrastructure not only takes time, but also money. And with lower incomes, some of the hardest hit areas over the past several weeks could have a very difficult time recovering.

Regardless, the recoveries on the continental mainlands of the Carolinas and Florida will likely be far quicker and more comprehensive than they have been thus far for Puerto Rico.

The only downside with this graphic is the registration shift, which is why the graphic appears fuzzy as colours are ever so slightly offset whereas the single ink black text in the upper right looks clear and crisp.

Credit for the piece goes to the New York Times graphics department.

Europe is More than the Big States

First, I want to start with a housekeeping note. Your author will be travelling for work and then a short autumn holiday. And so while I may be able to sneak a post or two in, I generally would not expect anything until next Friday, 12 October.

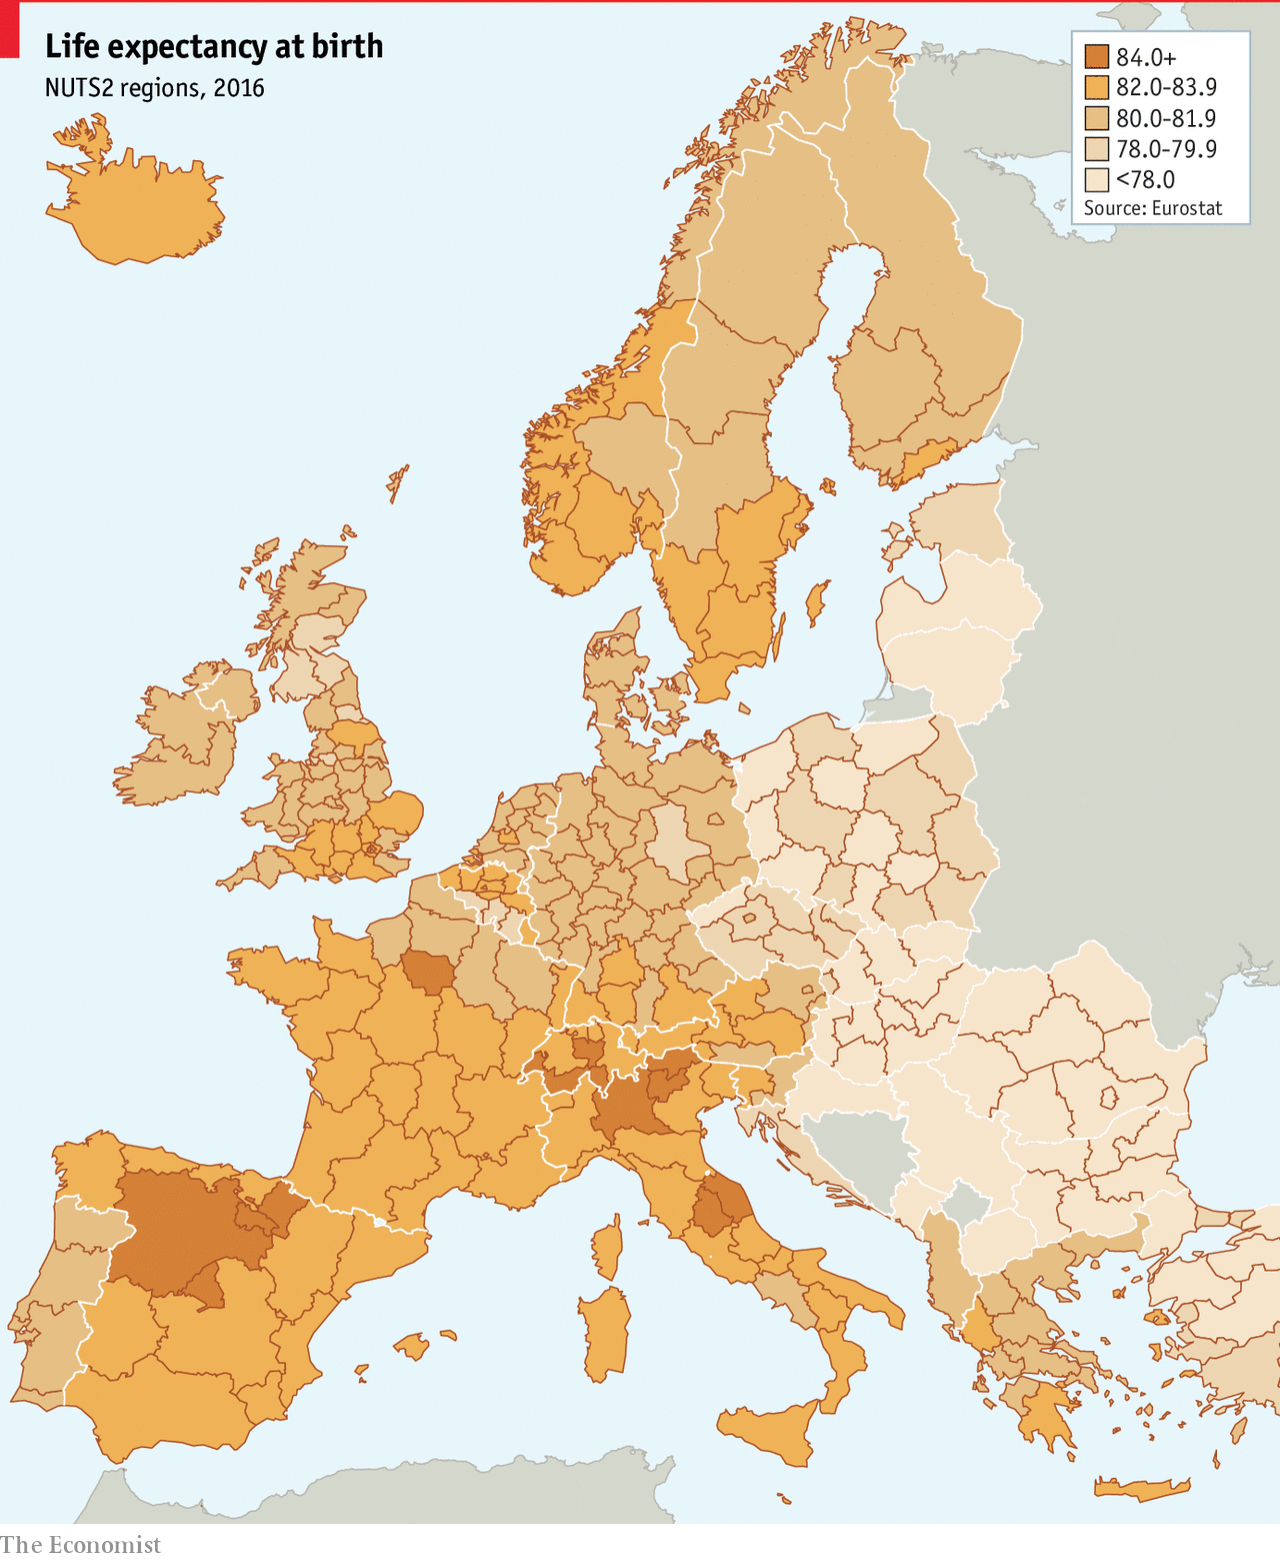
But let’s end this string of posts with a map. It is a choropleth, so in one sense there is nothing crazy going on here. The map comes from the Economist, which published an article on life expectancy throughout Europe and the big takeaway is that it is lower in the east than the west.

Apparently life is pretty good in northern Spain

The great part of the map, however, is that we get to see a more granular level of detail. Usually we just get a view of the European states, which presents them as an even tone of one shade or one colour. Here we can see the variety of life expectancy in the UK, France, and Belgium, and then still compare that to eastern Europe.

Of course creating a map like this demands data to drive it. Do data sets exist for the sub-national geographic units of EU or European states? Sometimes not. And in those cases, if you need a map, the European state choropleth is the choice you have to make. I just hope that we get to see more data sets like this with more granular data to present a more complex and patterned map.

Credit for the piece goes to the Economist Data Team.

T Minus 12 Weeks

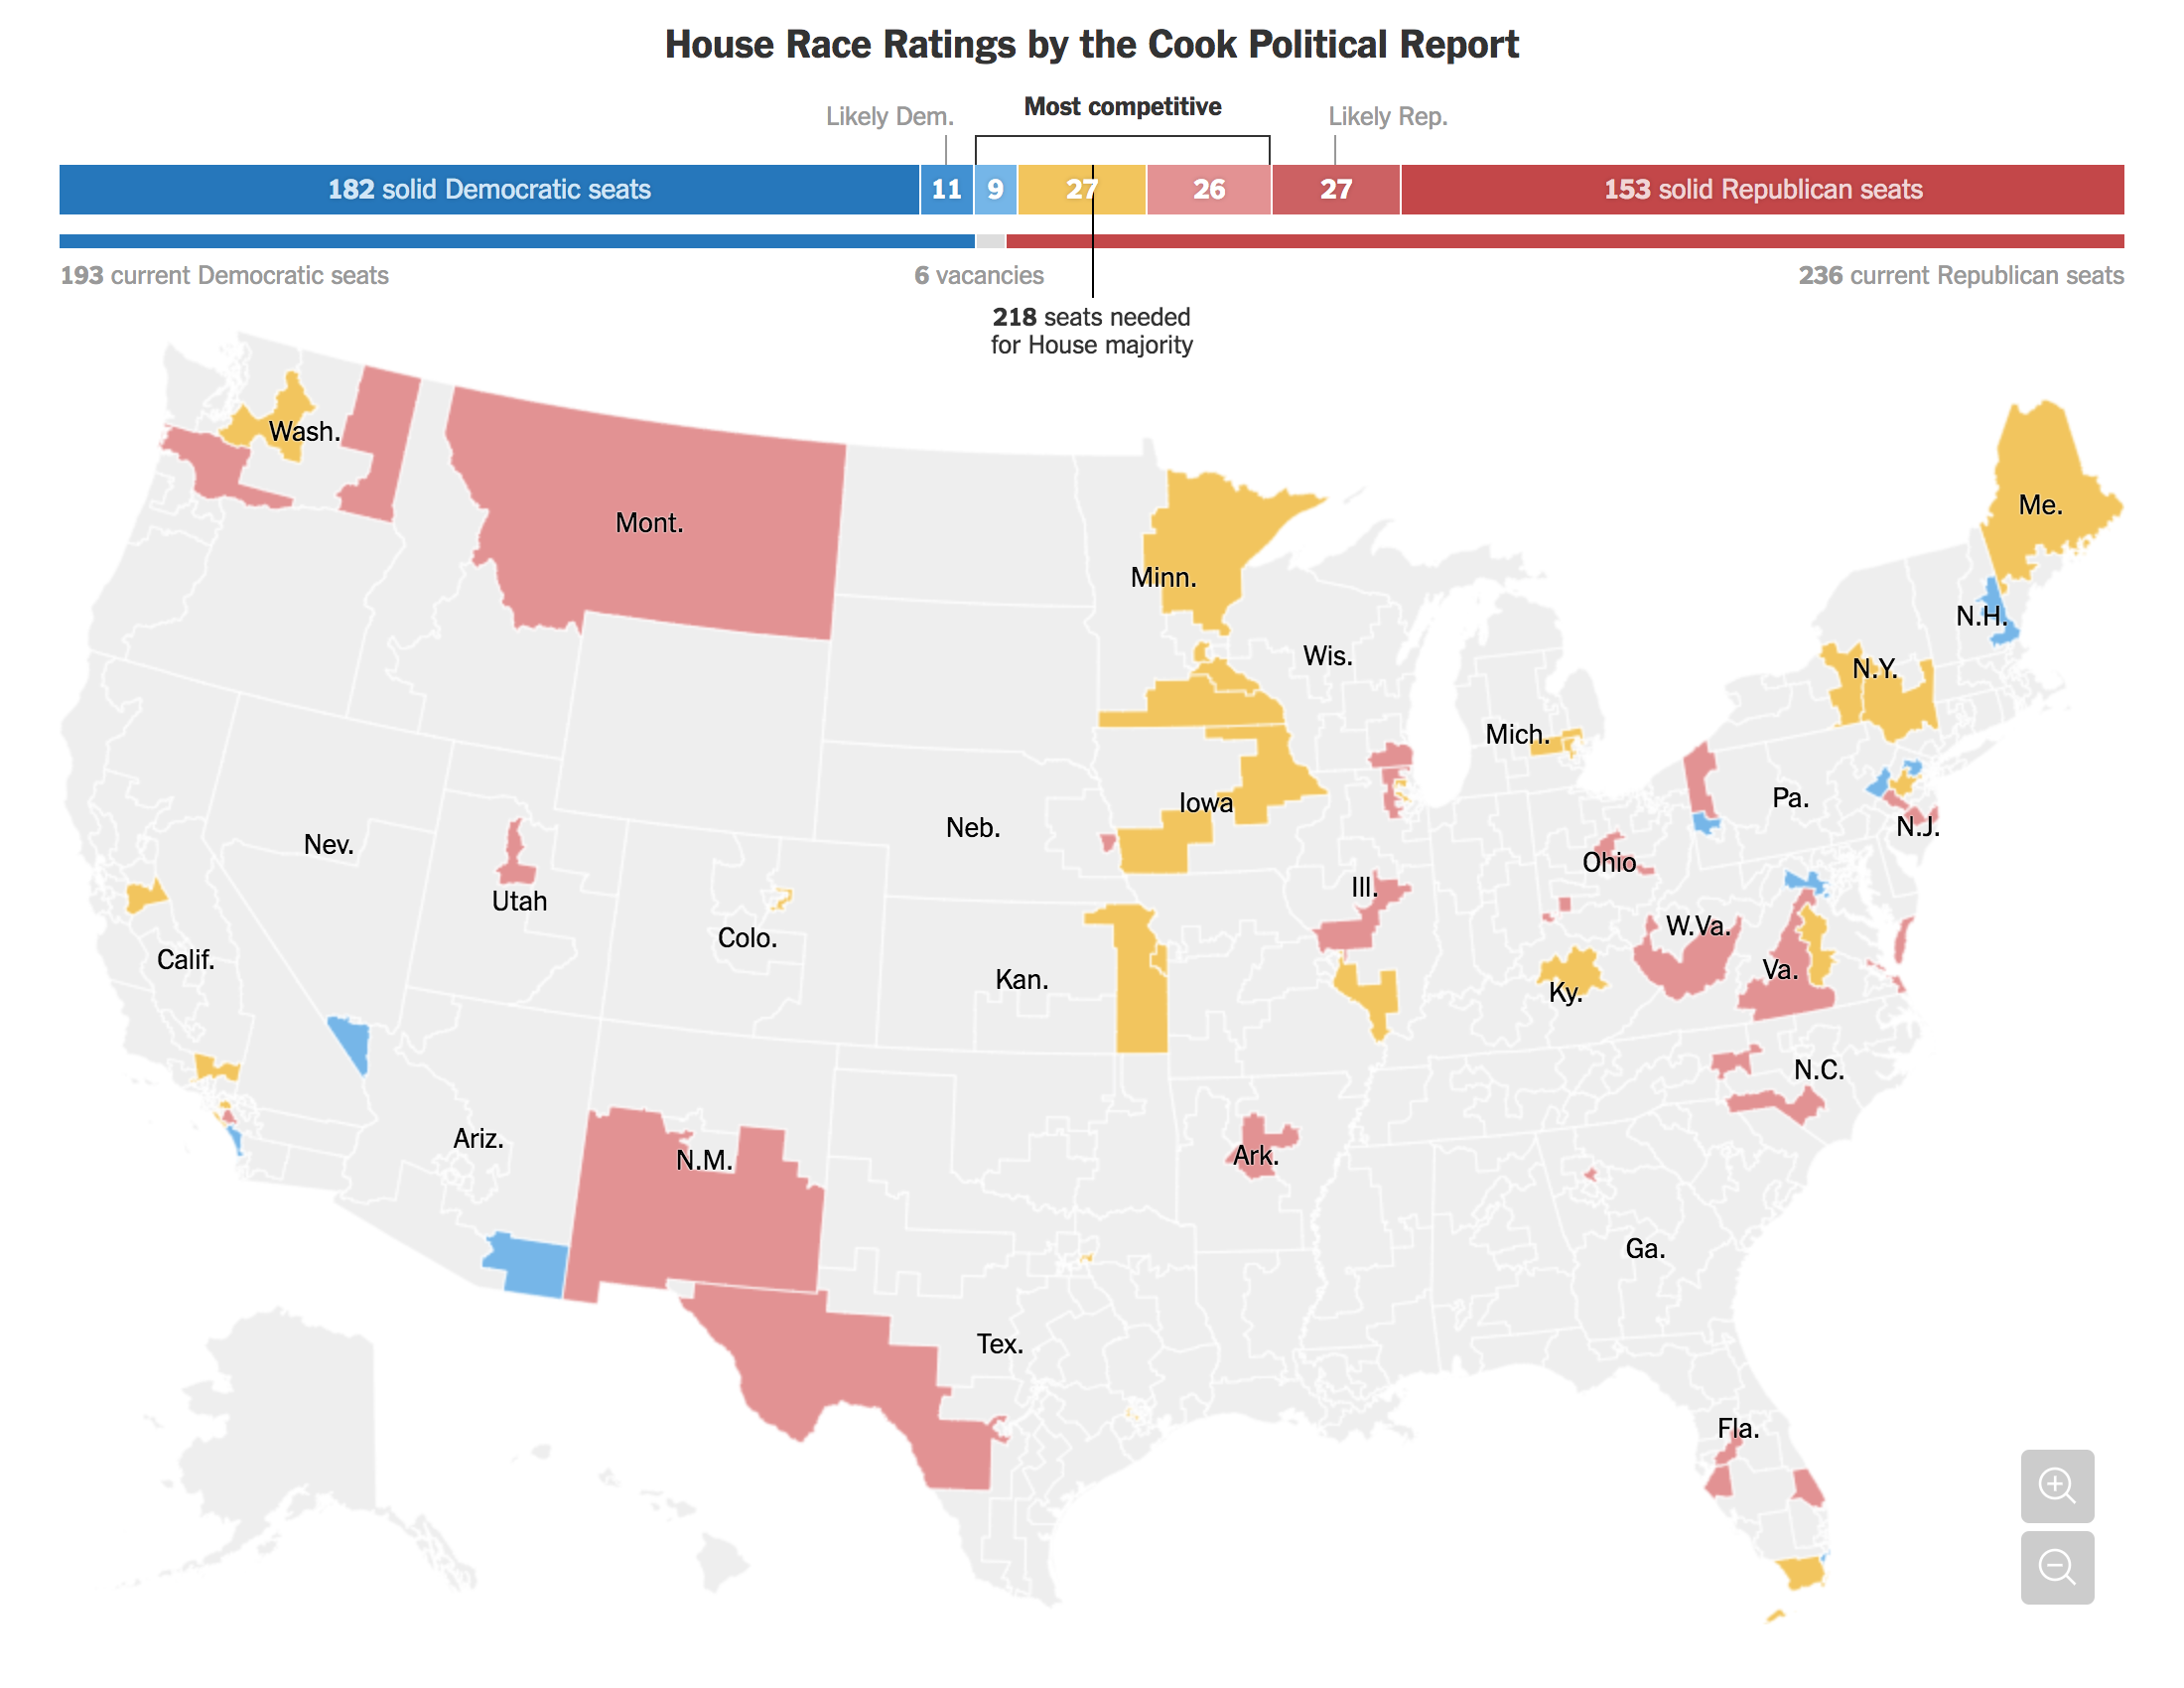
Today is Tuesday, 14 August. We are now 12 weeks away from the 2018 midterms. That is just three months away. Coverage will only intensify in the weeks to come, and you can be certain that if there are pieces worth noting, I will do that. But to mark the date I went with this choropleth map from the New York Times.

The nation will turns its eyes to you…in 12 weeks

Nothing too crazy here. Likelihood of results colour the districts. The darker the blue, the more solid the Democratic seat. The darker the red, the more solid the Republican one. But what this map does really well is it excludes the likely’s and the solids and sets them to a light, neutral grey. You can still hover over a district if you are curious about where it falls, but, in general those have been excluded from the consideration set because they are not the districts of the most national attention.

Secondly, note the state labels. States like Wyoming that have no competitive seats have no label. After all, why are we labelling things that have no impact on this story, again, the competitive races. Fewer labels means fewer distracting elements in the graphic.

Finally, the piece includes the ability to zoom into a region. After all, for those of us living in urban areas, our districts are geographically tiny compared to the at-large or state-wide seats like in Wyoming, the Dakotas, and Alaska. Otherwise, good luck trying to find the Illinois 5th or Pennsylvania 3rd.

Credit for the piece goes to Jasmine C. Lee.

The Decline of the Media

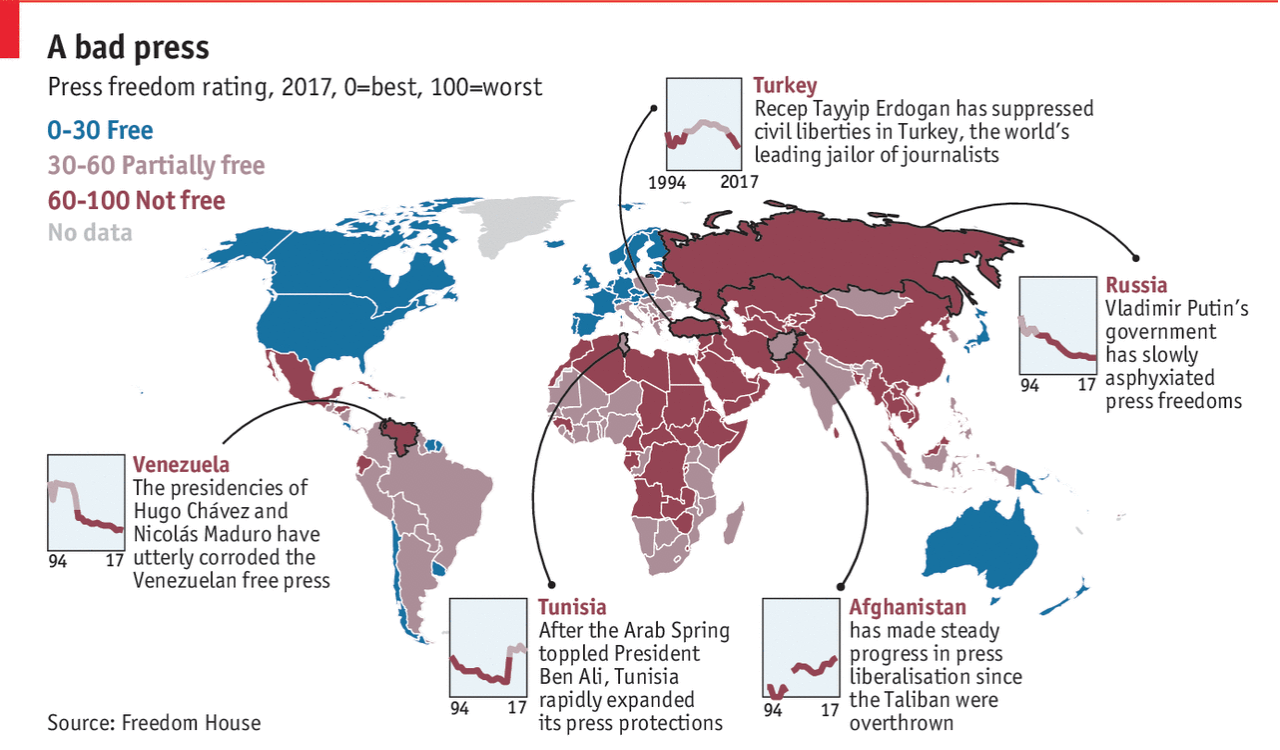
Everybody loves maps. Unfortunately this is not a map to love. The Economist looked at the global status of the free press and its decline around the world.

If only it were a larger map

The graphic is a neat little package of a map to anchor the narrative and a few callout countries with their general declines—or in Tunisia’s case the reversal thereof—highlighted. But I do have a few issues with the piece.

Do the lines need to be curved? Some certainly make sense, e.g. how do you get from the Turkey box to the outline of Turkey? But then for Afghanistan, a straight line through Balochistan, Pakistan would mean the line would not have to cover Pakistan, India, curve around Sri Lanka, and then finally reach the box.

In the little boxes, I also wonder if the lines need to be as thick as they are. Could a lighter stroke weight improve the legibility of the charts?

And to be super picky, I wonder if the stroke outlines of the countries are complete. My trained eye fails to register an outline of both the European part of Turkey and of the Russian oblast of Kaliningrad.

Credit for the piece goes to the Economist’s Data Team.

Chinese Urban Clusters

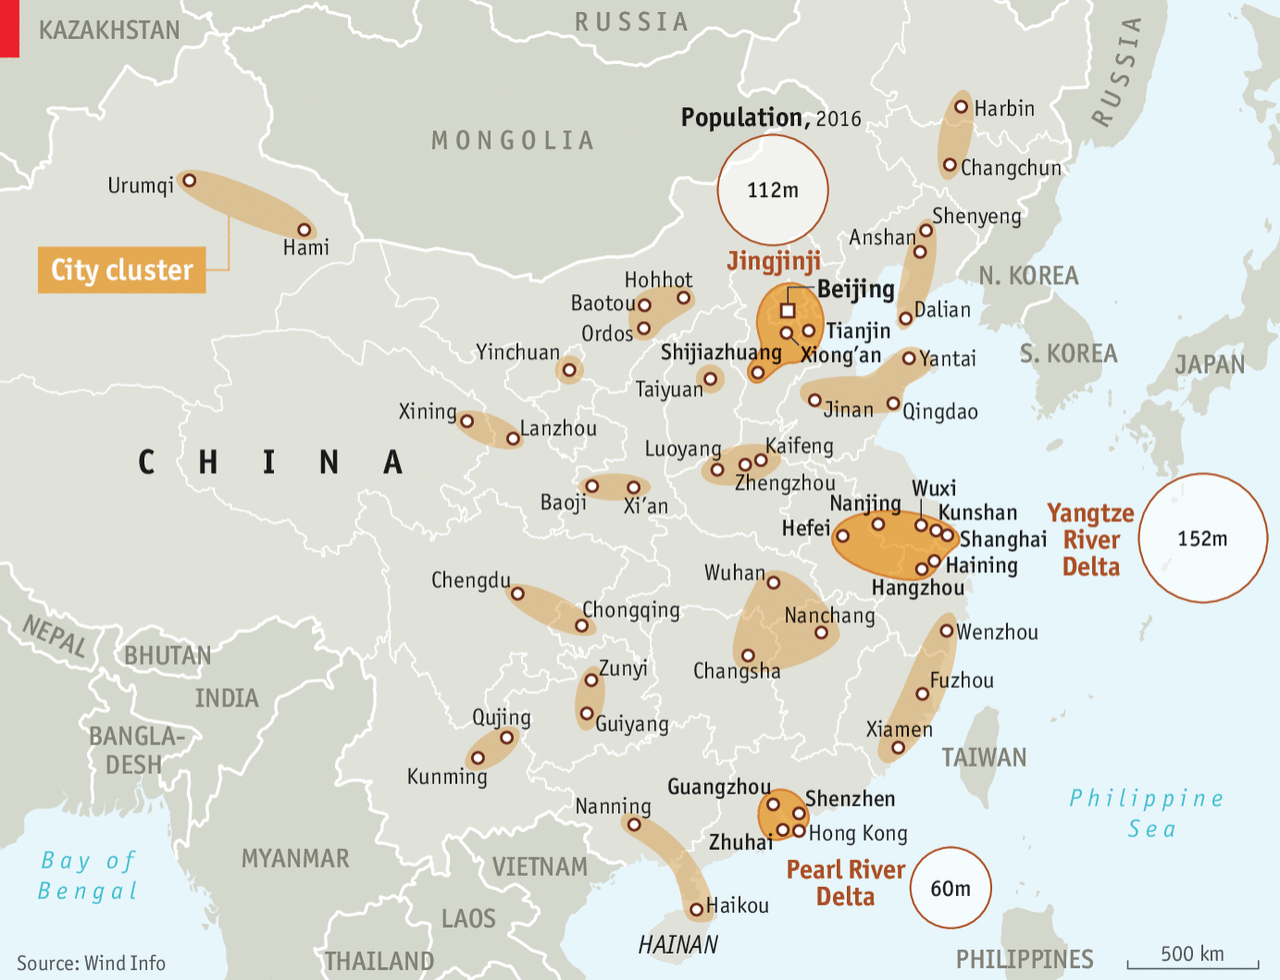
Yesterday the Economist posted a graphic about Chinese urban clusters, of which the Chinese government is planning to create 19 as part of a development strategy. In terms of design, though, I saw it and said, “I remember doing something like that several years ago”.

The Economist piece looks at just the geography of the Chinese clusters. It highlights three in particular it discusses within the article while providing population numbers for those clusters. Spoiler: they are large.

The Economist graphic does little else beyond labelling the cities and the highlighting of the three features clusters. But that is perfectly okay, because that was probably all the graphic was required to do. I am actually impressed that they were able to label every city on the map. As you will see, we quickly abandoned that design idea.

The Chinese government's new urban cluster plan
The Chinese government’s new urban cluster plan

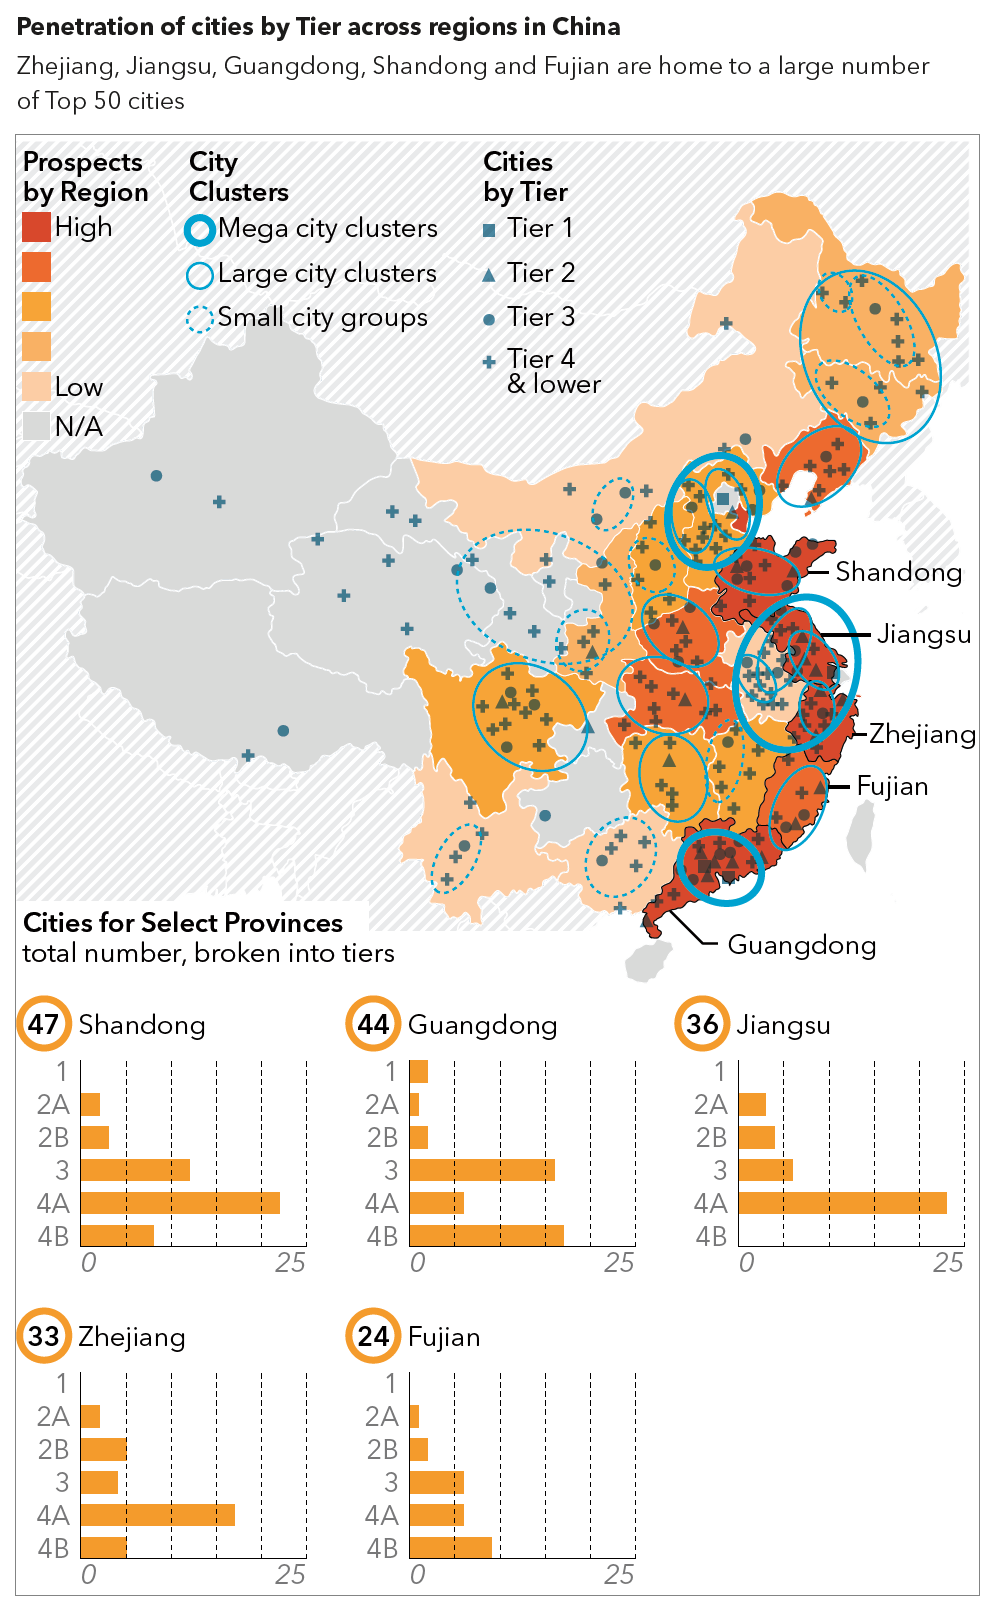
So back in 2015, using 2014 data, my team worked on a series of graphics for a Euromonitor International white paper on Chinese cities. The clusters that the analysts identified, however, were just that, ones identified by researchers. Since the Chinese government had not yet created this new plan.

We added some context to our cluster map

We also looked at more cities and added some vital context to the cluster map by working to identify the prospects of the various Chinese provinces. Don’t ask me what went into that metric, though, since I forget. The challenge, however, was identifying the four different tiers of Chinese city and then differentiating between the three different cluster types while overlaying that on a choropleth. Then we added a series of small multiples to show how now all provinces are alike despite having similar numbers of cities.

Credit for the Economist piece goes to the Economist Data Team.

Credit for the Euromonitor piece is mine. I would gladly give a shoutout to those that worked with me on that project…but it’s been so long I forget. But I’m almost certain both Lindsey Tom and Ciana Frenze helped out, if not on that graphic, on other parts of the project.

Primarily California

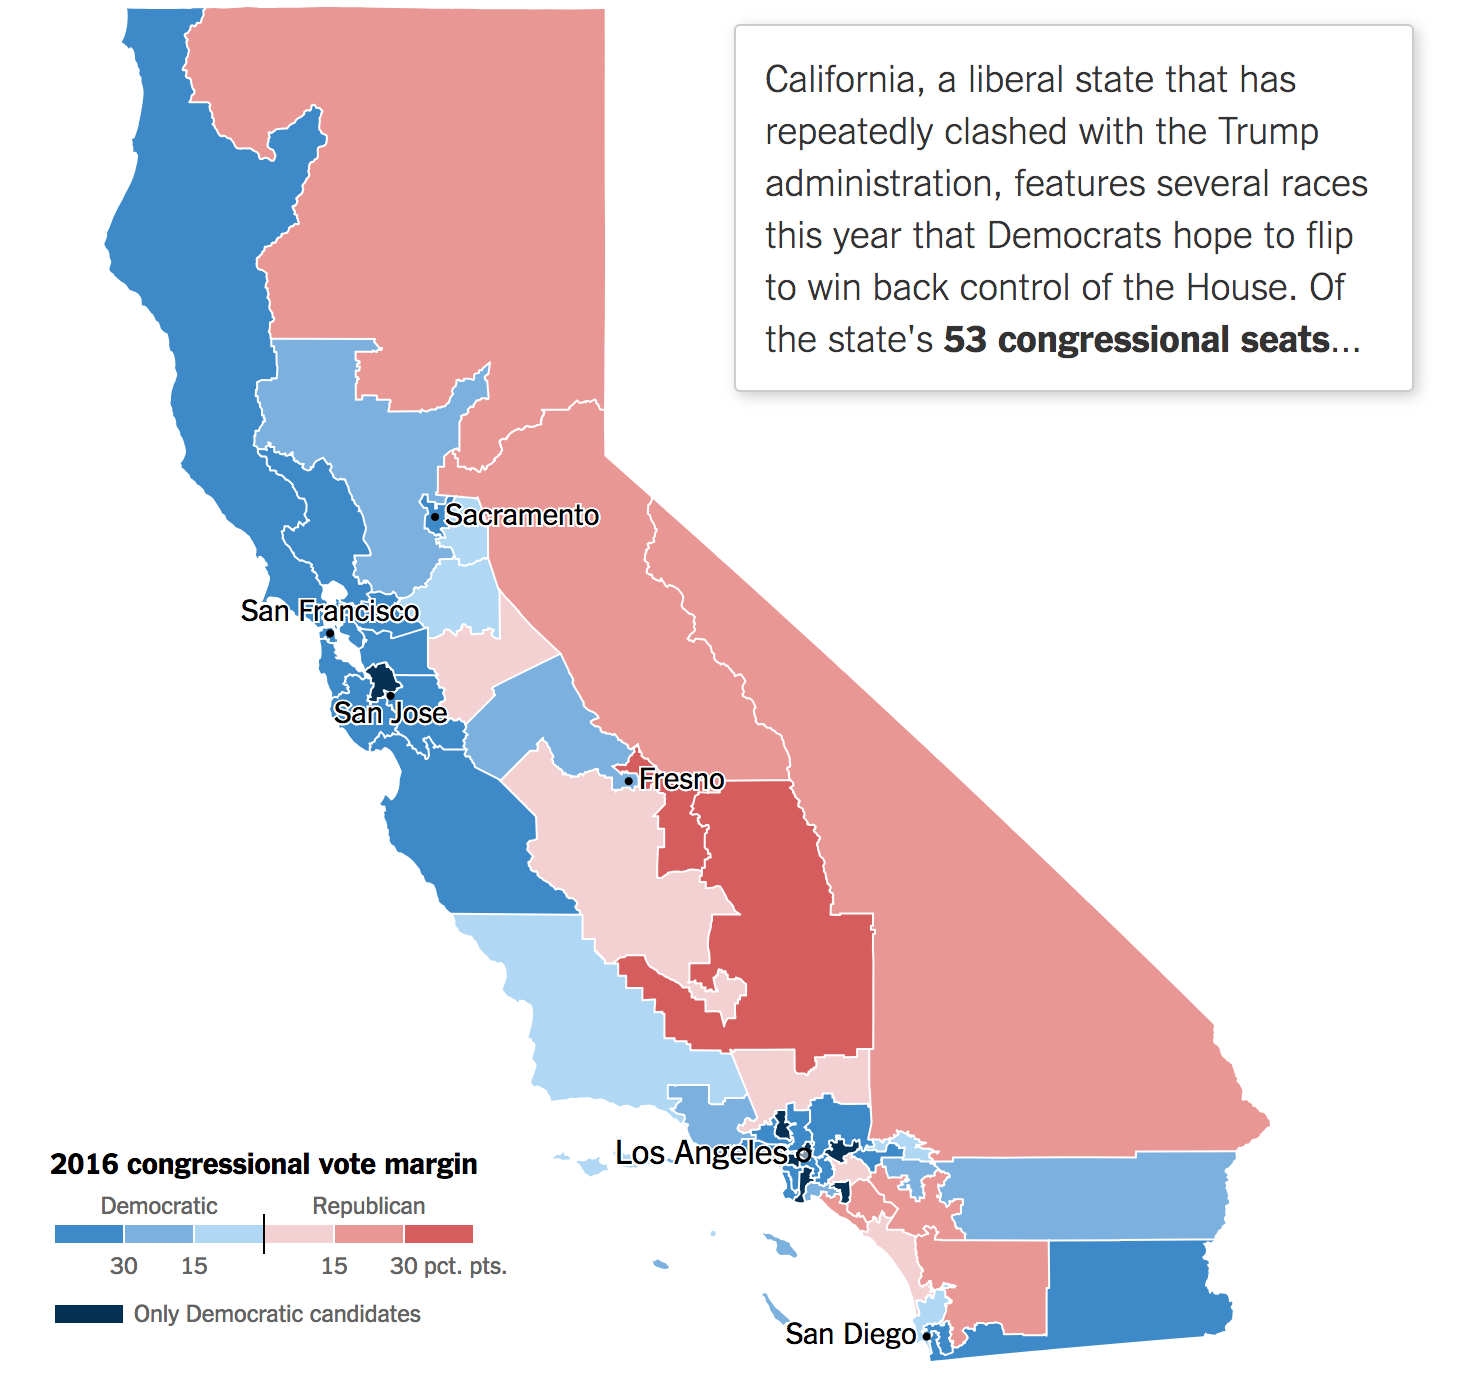
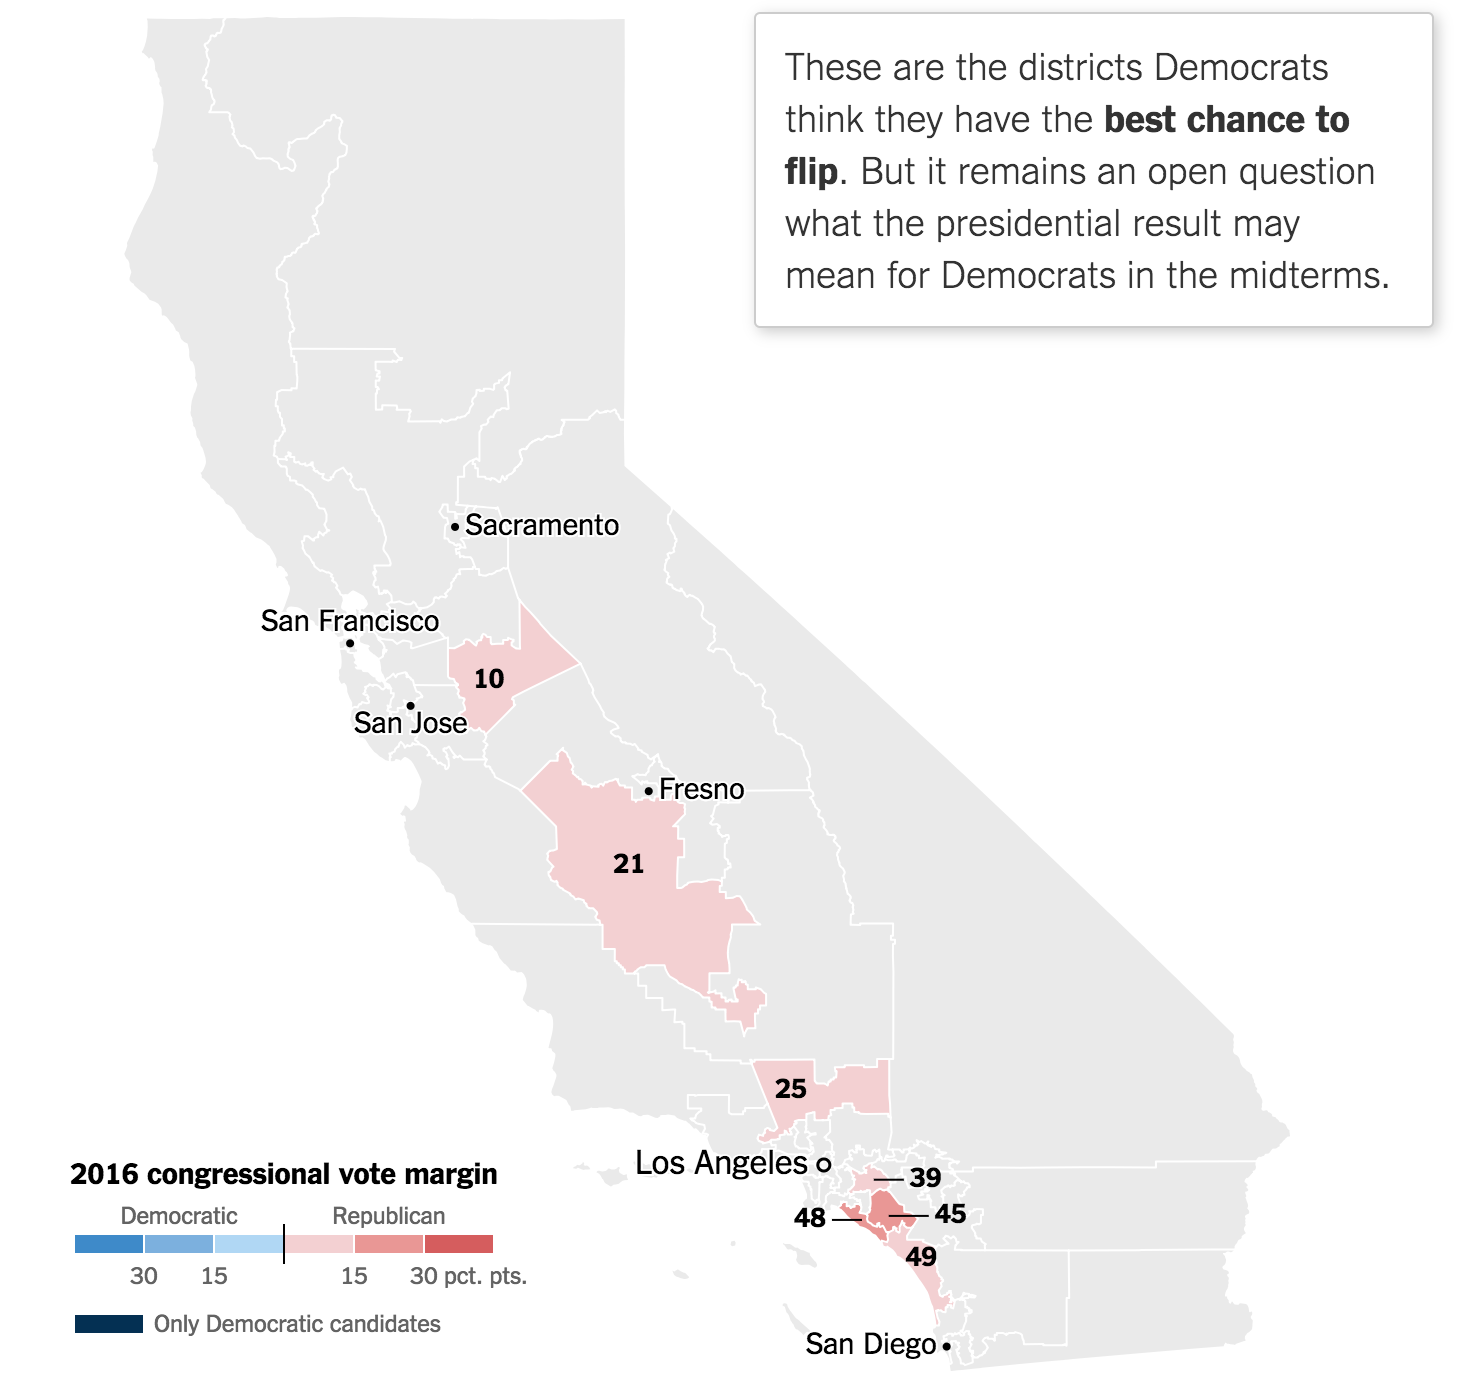
Today is primary day and everyone will be looking to the California results. Although probably not quite me, because Eastern vs. Pacific time means even I will likely be asleep tonight. But before we get to tonight, we have a nice primer from last Friday’s New York Times. It examines the California House of Representatives races that we should be following.

53 districts are a lot to follow in one night…

Like most election-related pieces, it starts with a map. But it uses some scrolling and progressive data disclosure. The map above, after a bit of scrolling, finally reveals the districts worth following and their 2016 vote margins.

Out of all 53, these are the districts the Times says to watch

From there the article moves onto a bit of an exploration of those few districts. You should read the full article—it’s a short read—for the full context on the California votes today. But it does make some nice of bar and line charts to plot the differences in presidential race vs. congressional race margins and the slow Democratic shift.

Credit for the piece goes to Jasmine C. Lee and Karen Yourish.

Turning the Midwest Red

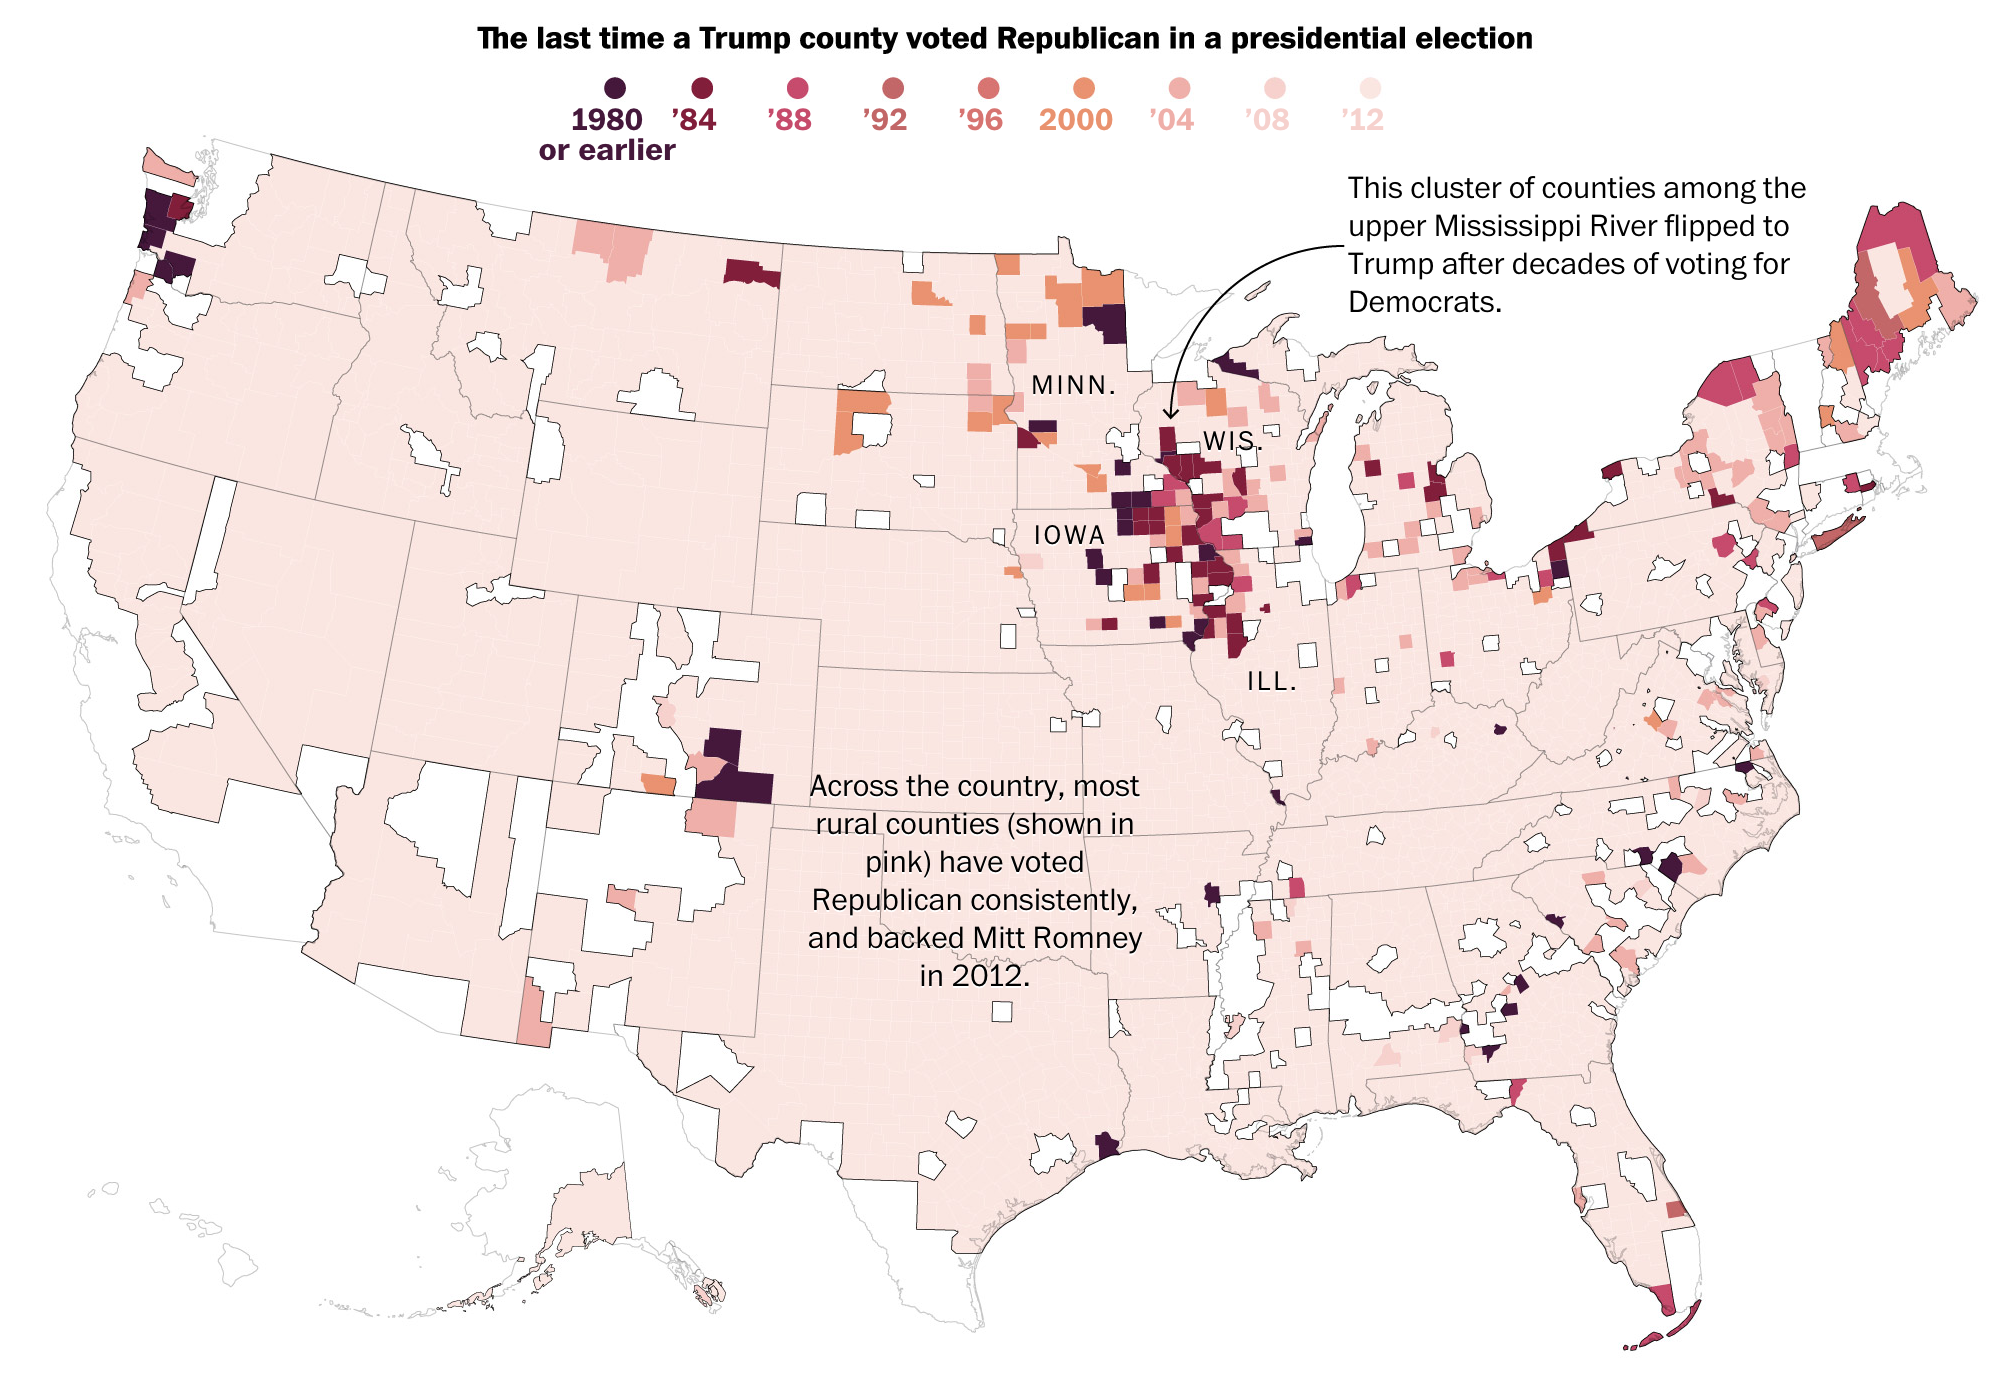
Continuing with election-y stuff, I want to share a fascinating map from the Washington Post. The article came out last week, and it is actually incredibly light in terms of data visualisation. By my count, there were only two maps. The article’s focus is on interviews with Trump voters in 2016 and how their opinions of the president have changed over the last year or so. If you want to read it, and you should as it is very well written, I will warn you that it is long. But, to the map.

I may have used an even lighter shade for 2012 counties…

What I loved about this map is how it flips the usual narrative a bit on its head. We talk about how much a candidate won a county in 2016, or even how much the vote shifted in 2016. And anecdotally we talk about “ancestral Democrats” flipping to Trump. But this map actually tries to chart that. It reveals the last time a county actually voted for a Republican presidential candidate—the darker the red, the further back in time one has to go.

Counties that vote Democratic are white, because why do we need them for this examination. Omitting them was a great design decision. Much of the country, as we know or can intuit, voted Republican in 2012 for Mitt Romney. But what about before then? You can see how the upper Midwest, along the Mississippi River, was a stronghold for Democrats with some counties going as far back as the 1980s or earlier. And then in 2016 they all flipped and that flipping was most significant there—of some additional interest to me are the counties in Maine, the Pacific Northwest, and along Lake Erie near Cleveland.

In short, this was just a brilliantly done map. And it sets the tone for the rest of the article, which is interviews with residents of those counties called out on the map.

Credit for the piece goes to Andrew Braford, Jake Crump, Jason Bernert and Matthew Callahan.