The Ebola Outbreak in the Congo

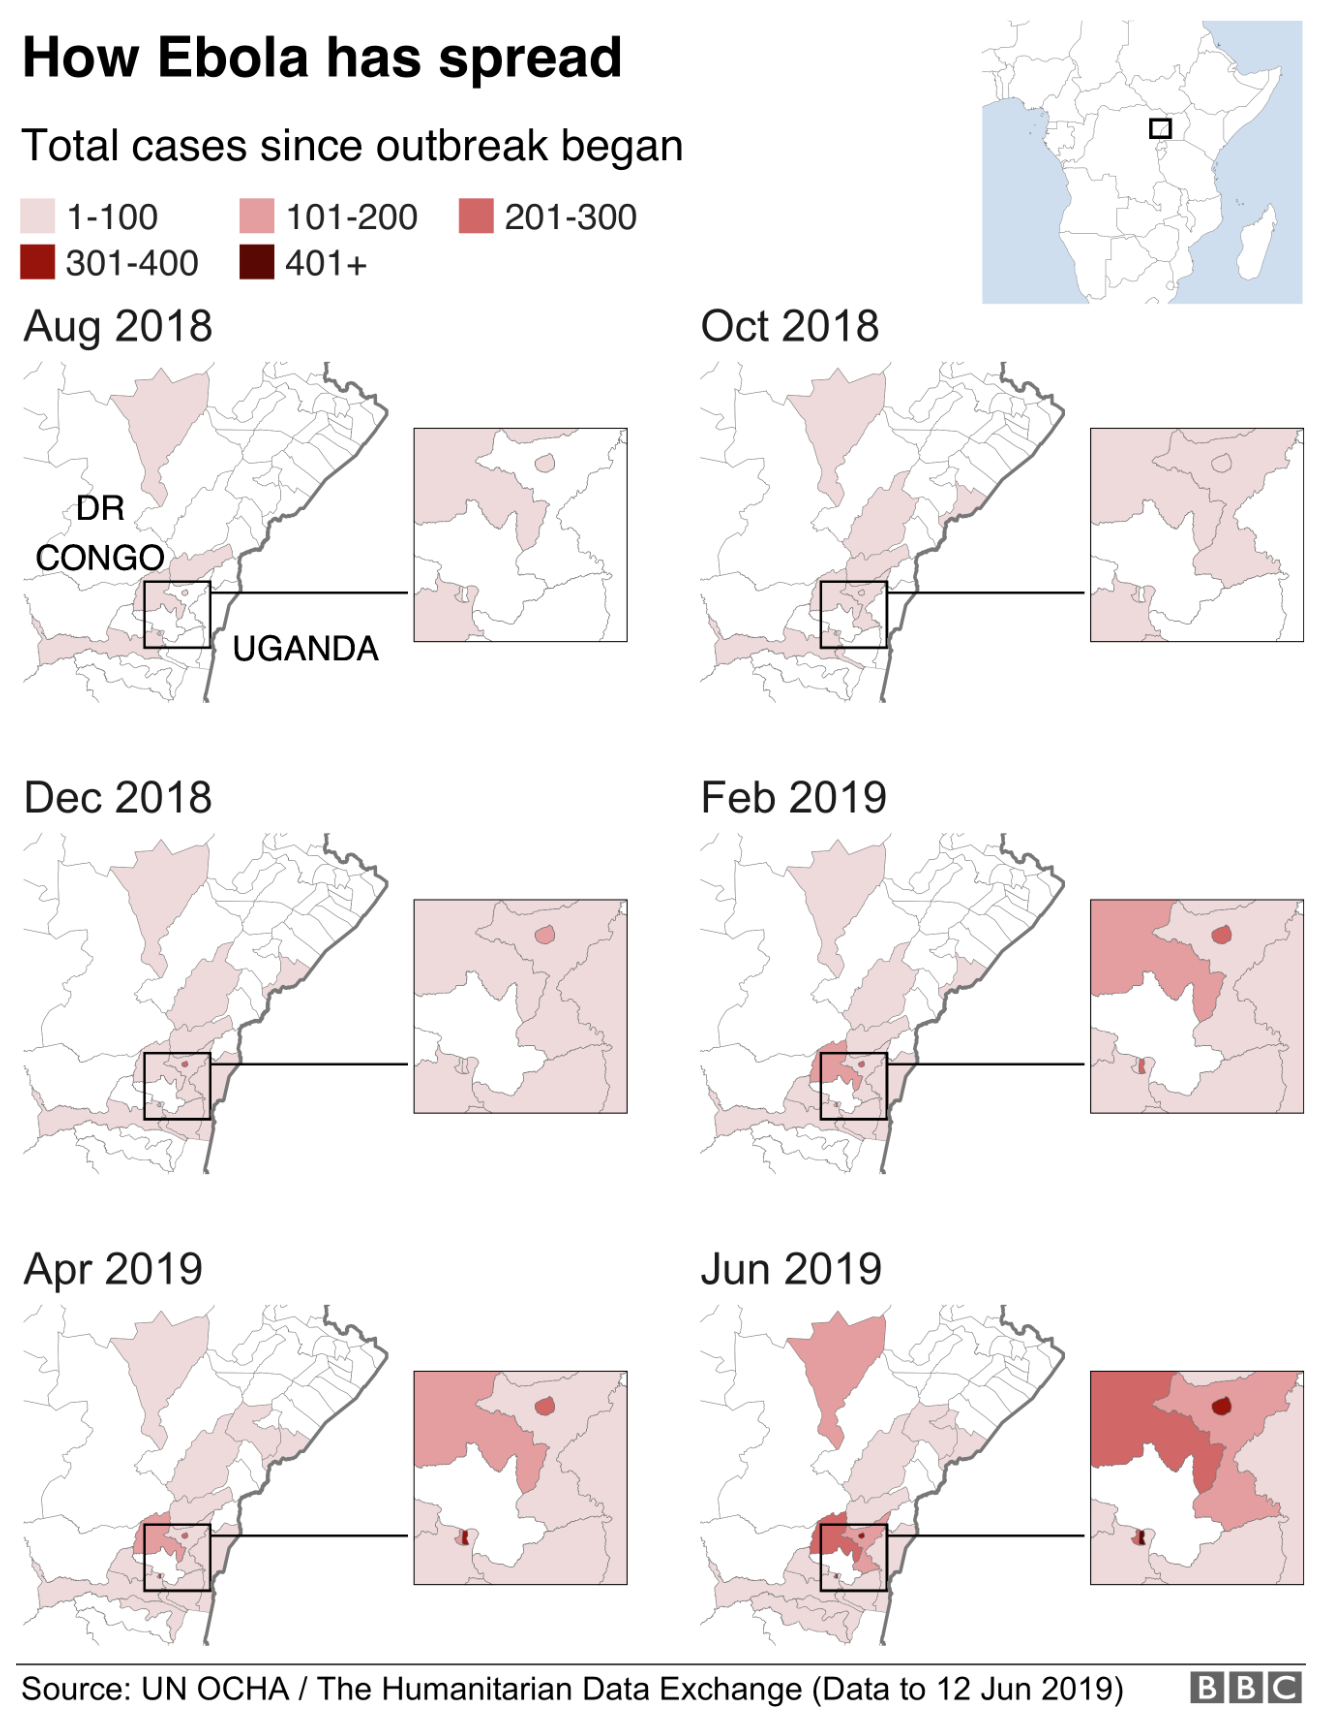
Ebola, which killed 11,000 people in West Africa in 2014 (which I covered in a couple of different posts), is back and this time ravaging the Congo region, specifically the Democratic Republic of the Congo (DRC). The BBC published an article looking at the outbreak, which at 1,400 deaths is still far short of the West Africa outbreak, but is still very significant.
That's looking like a tenuous border right now…
That’s looking like a tenuous border right now…

The piece uses a small multiples of choropleths for western Congo. The map is effective, using white as the background for the no case districts. However, I wonder, would be more telling if it were cases per month? That would allow the user to see to where the outbreak is spreading as well as getting a sense of if the outbreak is accelerating or decelerating.

The rest of the article features four other graphics. One is a line chart that also looks at cumulative cases and deaths. And again, that makes it more difficult to see if the outbreak is slowing or speeding up. Another is how the virus works and then two are about dealing with the virus in terms of suits and the containment camps. But those are graphics the BBC has previously produced, one of which is in the above links.

Credit for the piece goes to the BBC graphics department.

A Shrinking Illinois

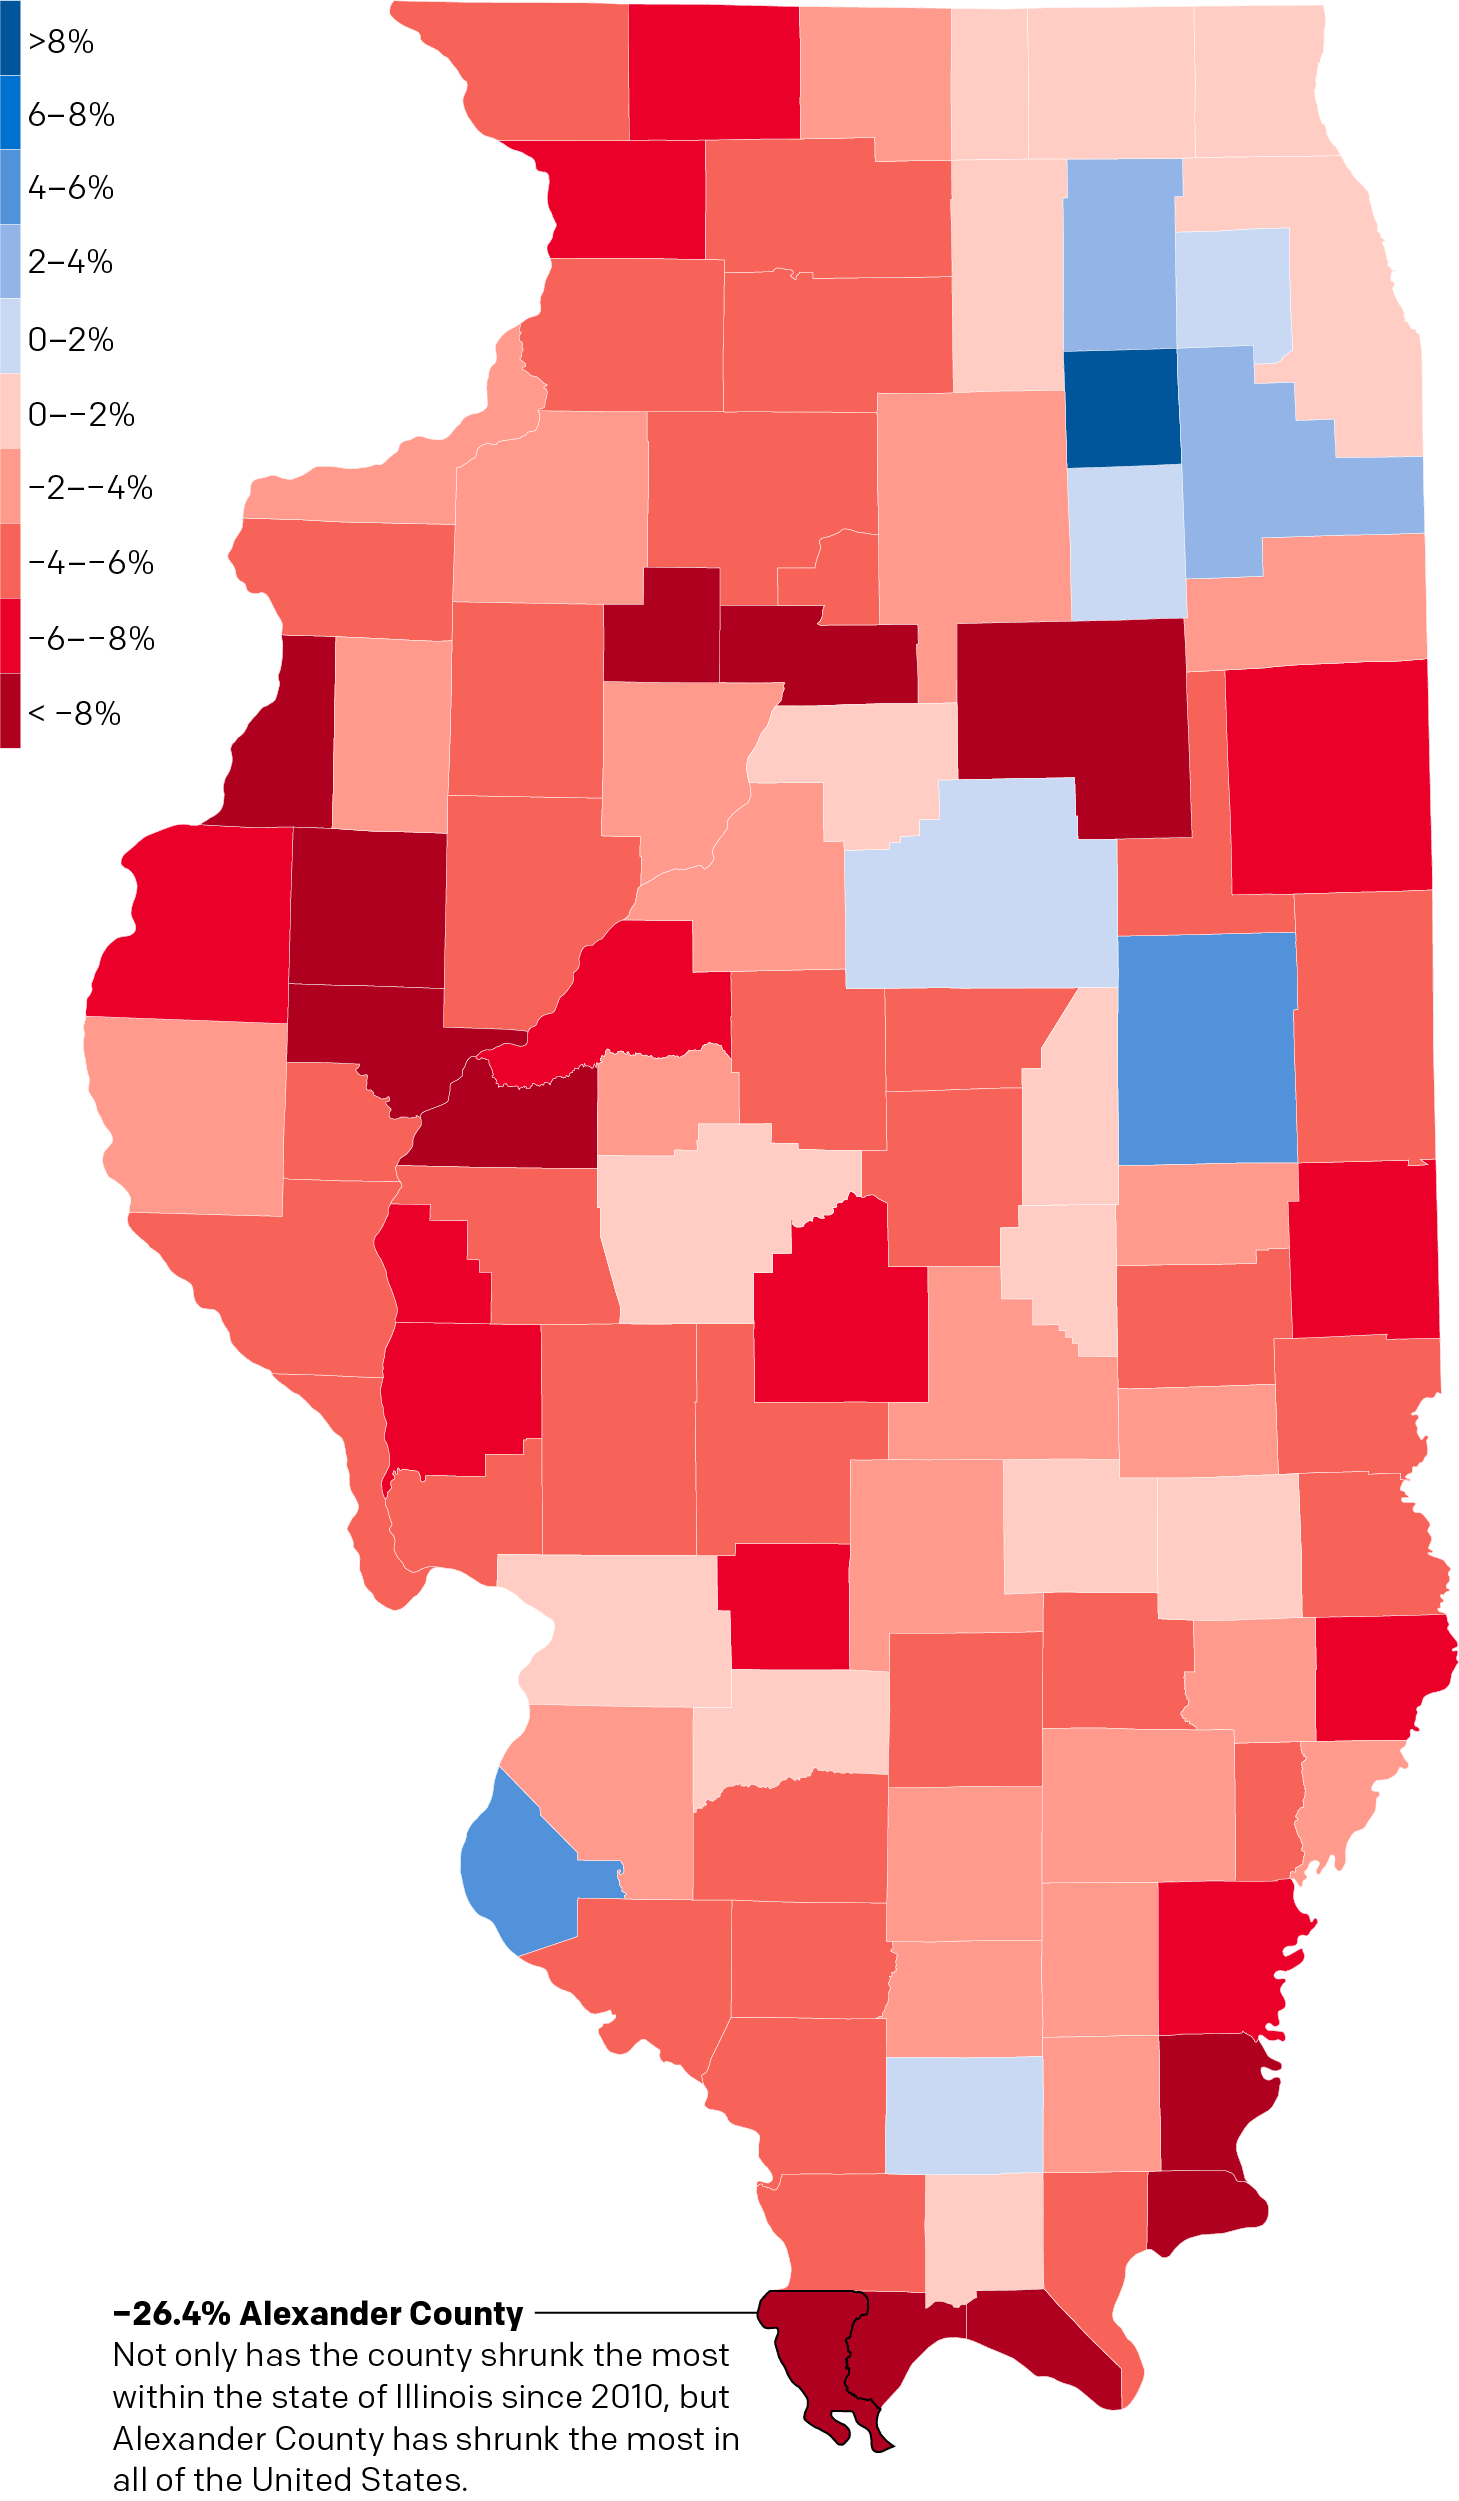
Last week we looked at the data on Pennsylvania from the US Census Bureau and found the Commonwealth’s population is shifting from west of the Appalachians to the southeast of the state. That got me thinking about Illinois, one of three states to have experienced a decline in population. Is there a similar geographic pattern evident in that state’s data? (Plus, I lived there for eight years, so I am curious how the state evolved over a similar time frame.)

A lot more red in this map…

Well, it turns out the pattern is not so self-evident in Illinois as it is in Pennsylvania. Instead, we see small clusters of light blues across a sea of red. In other words, the population decline is widespread, though not necessarily extreme. However, it is notable that in the far south of the state, Alexander County, home to the city of Cairo, has seen the greatest decline in population since 2010, not just in Illinois, but in the entire United States (in percentage terms).

Unlike Pennsylvania, where the state’s primary city of Philadelphia is growing (albeit slowly), in Illinois the primary city of Chicago has seen its population shrink over the last several years. However, the counties south and west of Cook County have grown. Kendall County, where parts of Aurora and Joliet are located along with growing towns like Oswego and Plano, grew at over 11%.

The state’s other growing counties fall across the state from north to south, east to west. In the south the county containing the eastern suburbs of Carbondale has grown modestly. But for real percentage growth, one should look west towards Monroe County, a southern suburb of St. Louis, Missouri located just across the Mississippi River.

Then in the centre of the state we see growth in McLean and Champaign Counties. The former is home to Bloomington and Normal. While Champaign is home to the eponymous city as well as its neighbour, Urbana.

All in all, the pattern that emerges is that of urban/suburban vs. rural. With some notable exceptions, e.g. Cook County, the only growth in Illinois is in counties that have prominent cities or towns. Meanwhile, rural counties shrink—the aforementioned Alexander most notably.

Credit for this piece is mine.

Pennsylvania’s Population Shifts

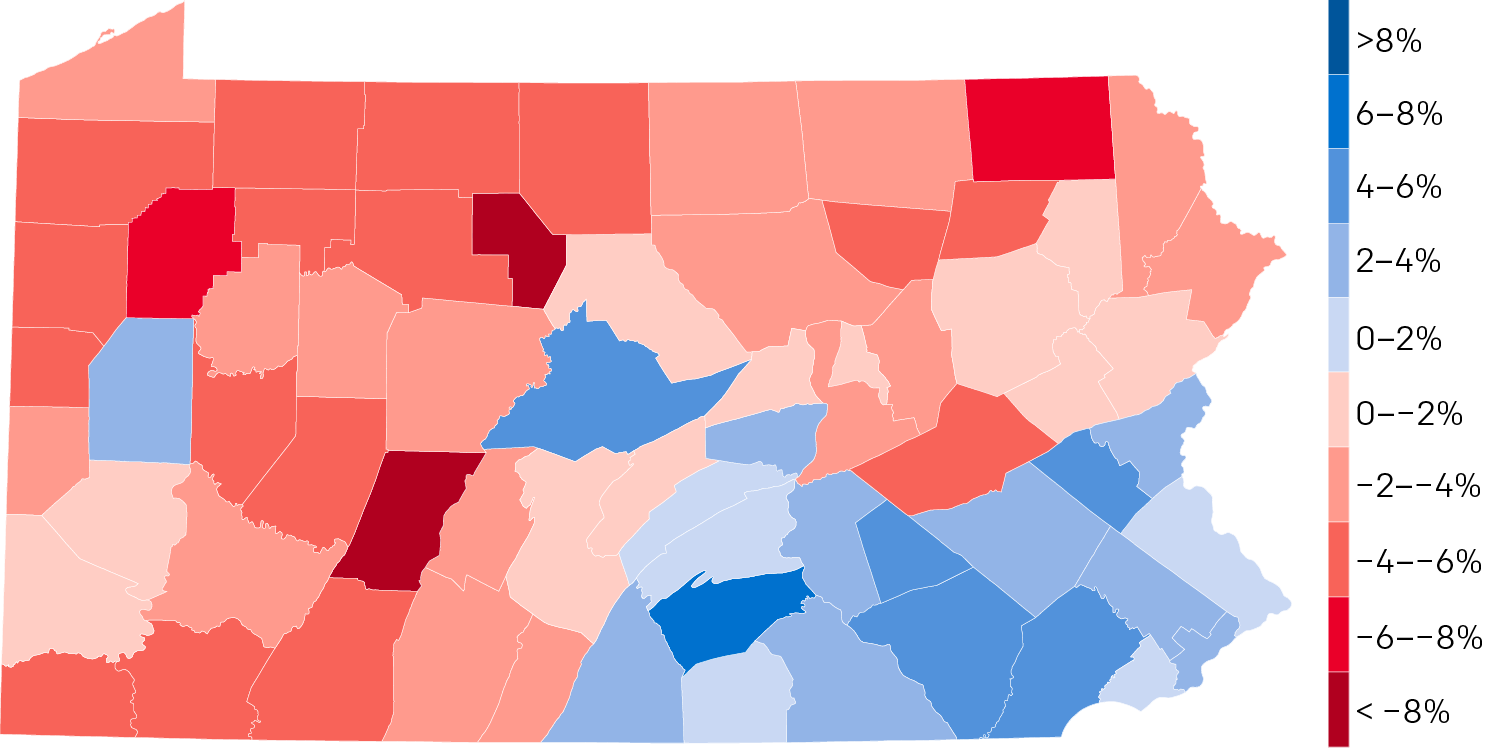
Last month the US Census Bureau published their first batch of 2018 population estimates for states and counties. Pennsylvania is one of those states that is growing, but rather slowly. It will likely lose out to southern and western states in the 2020 census after which House seats will be reapportioned and electoral college votes subtracted.

From 2018 to 2010, the Commonwealth has grown 0.8%. Like I said, not a whole lot. But unlike some states (Illinois), it is at least growing. But Pennsylvania is a very diverse state. It has very rural agricultural communities and then also one of the densest and largest cities in the entire country with the whole lot in between . Where is the growth happening—or not—throughout the state? Fortunately we have county-level data to look at and here we go.

Some definite geographic patterns here…

The most immediate takeaway is that the bulk of the growth is clearly happening in the southeastern part of the state, that is, broadly along the Keystone Corridor, the Amtrak line linking Harrisburg and Philadelphia. It’s also happening up north of Philadelphia into the exurbs and satellite cities.

We see two growth outliers. The one in the centre of the state is Centre County, home to the main campus of Pennsylvania State University. And then we have Butler County in the west, just north of Pittsburgh.

The lightest of reds are the lowest declines, in percentage terms. And those seem to be clustered around Scranton and Pittsburgh, along with the counties surrounding Centre County.

Everywhere else in the state is shrinking and by not insignificant amounts. Of course this data does not say where people are moving to from these counties. Nor does it say why. But come 2020, if the pattern holds, the state will need to take a look at its future planning. (Regional transit spending, I’m looking at you.)

Trump-won Counties Are Winning

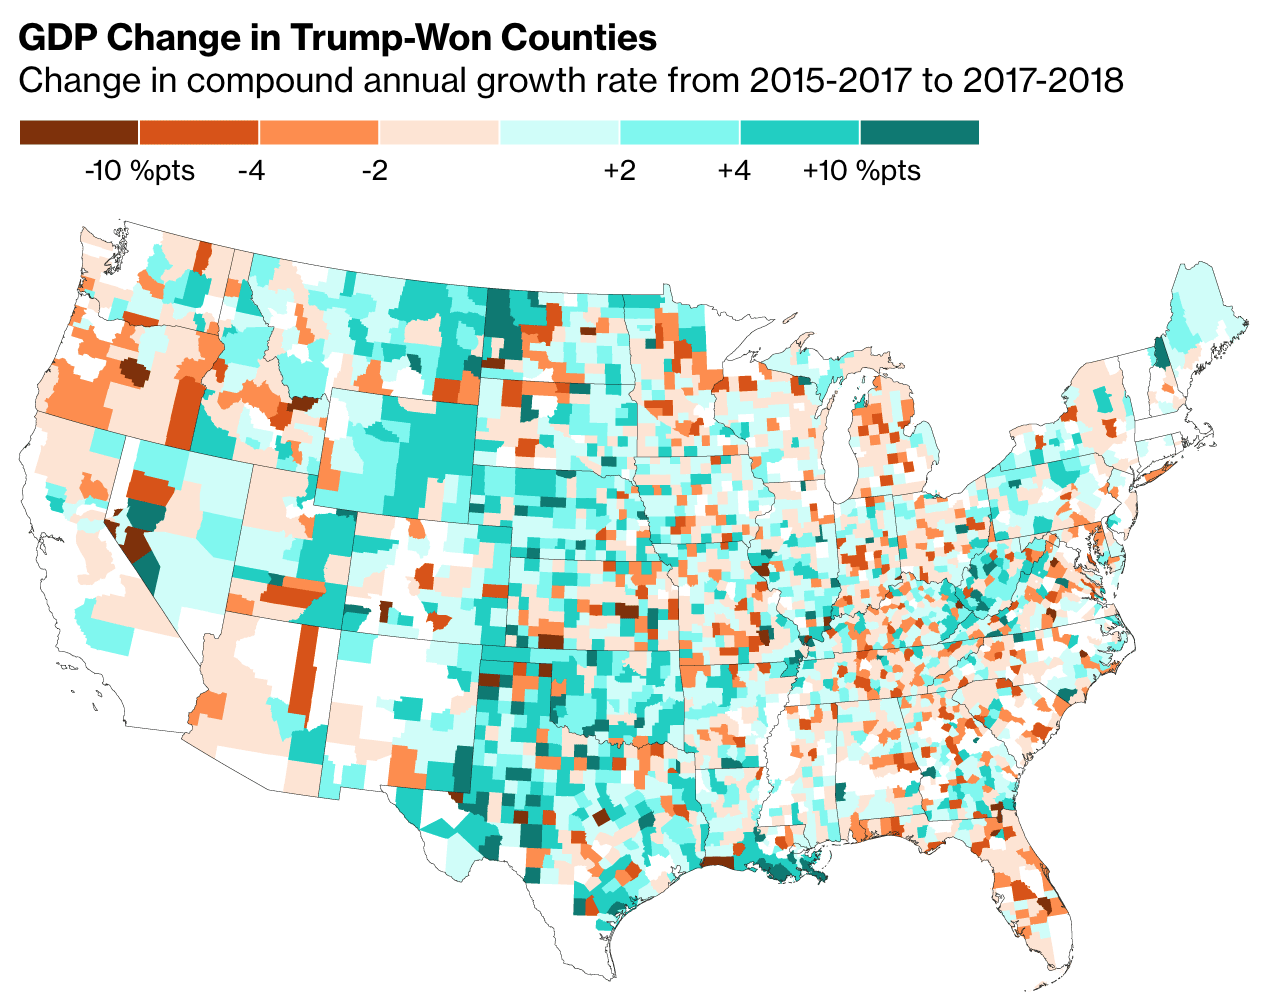
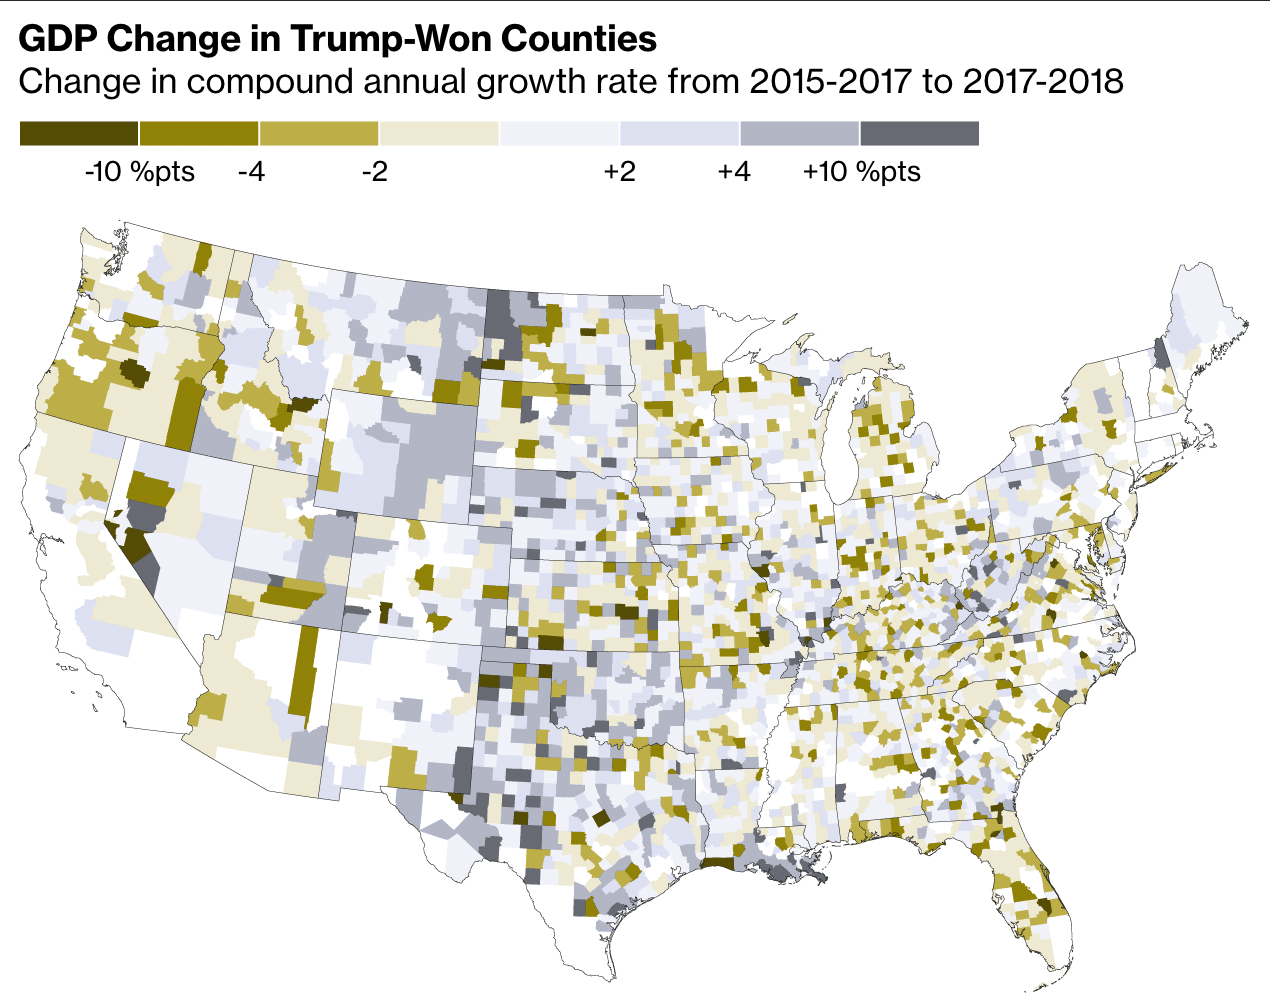
Yesterday we looked at how China and the European Union are planning their tariff/trade war retaliation to target Trump voters. Today let’s take a look at how those voters are doing as this article from Bloom does.

Lots of green, but some noticeably red counties in Florida.

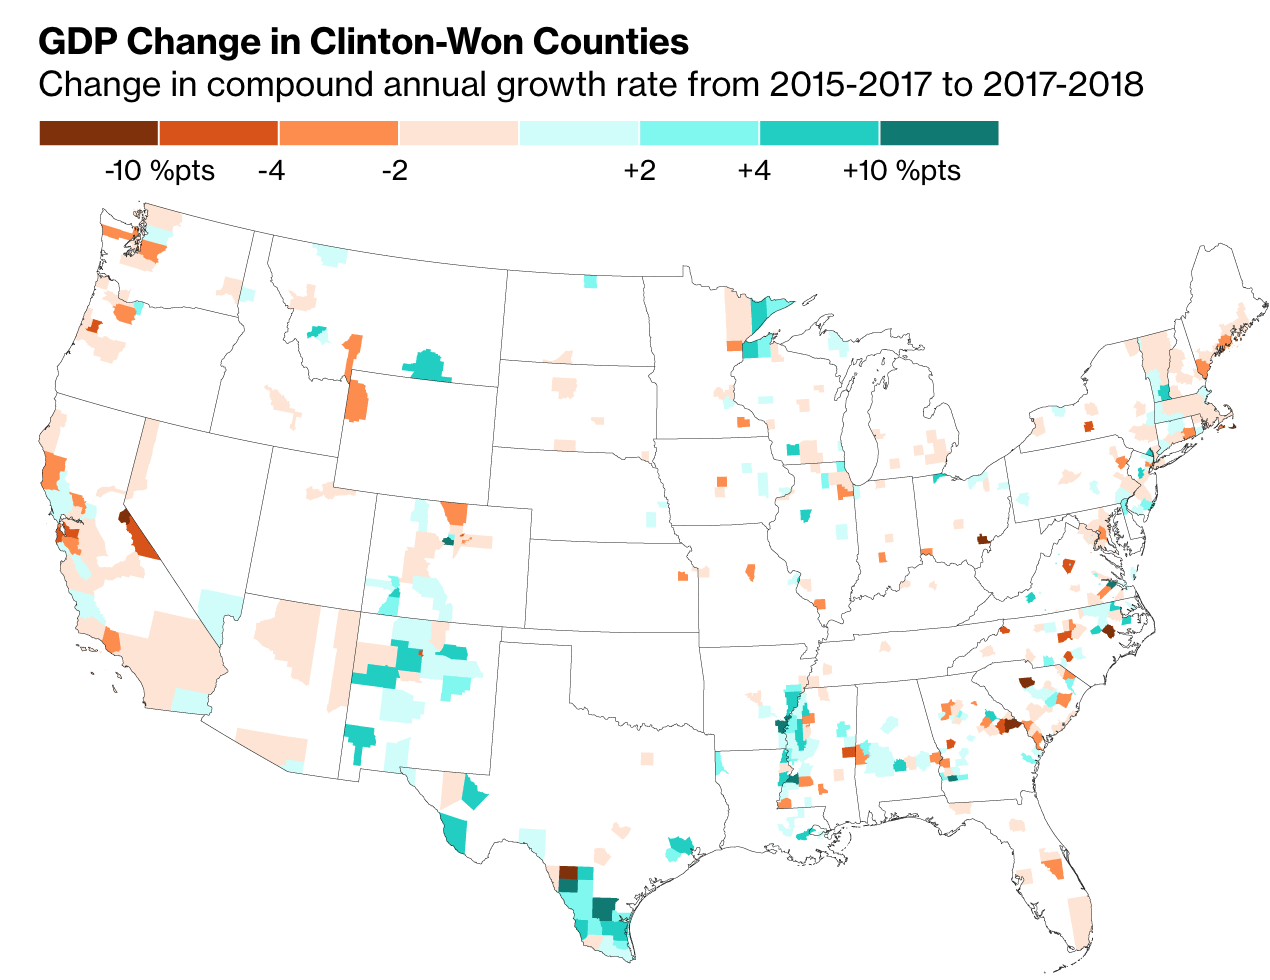
The article is not terribly complicated. We have four choropleth maps at the county level. Two of the maps isolate Trump-won counties and the other two are Clinton-won. For each candidate we have a GDP growth and an employment growth map.

In the Trump-won maps, the Clinton-won counties are white, and vice versa. Naturally, because the Democratic vote is greatest in the large cities, which, especially on the East Coast, are in tiny counties, you see a lot less colour in the Clinton maps.

Not a whole lot to see here…

Design wise, I should point out the obvious that green-to-red maps are not usually ideal. But the designers did a nice job of tweaking these specific colours so that when tested, these burnt oranges and green-blues do provide contrast.

Here they appear more of a yellow to grey

But I am really curious to see this data plotted out in a scatter plot. Of course the big counties in the desert southwest are noticeable. But what about Philadelphia County? Cook County? Kings County? A scatter plot would make them equally tiny dots. Well, hopefully not tiny. But then when you compare GDP growth and employment growth and benchmark them against the US average, we might see some interesting patterns emerge that are otherwise masked behind the hugeness of western counties.

But lastly. And always. Where. Are .Alaska. And. Hawaii? (Of course the hugeness problem is of a different scale in Hawaii. Their county equivalents are larger than states combined.)

Credit for the piece goes to the Bloomberg graphics department.

Trade War Retaliation

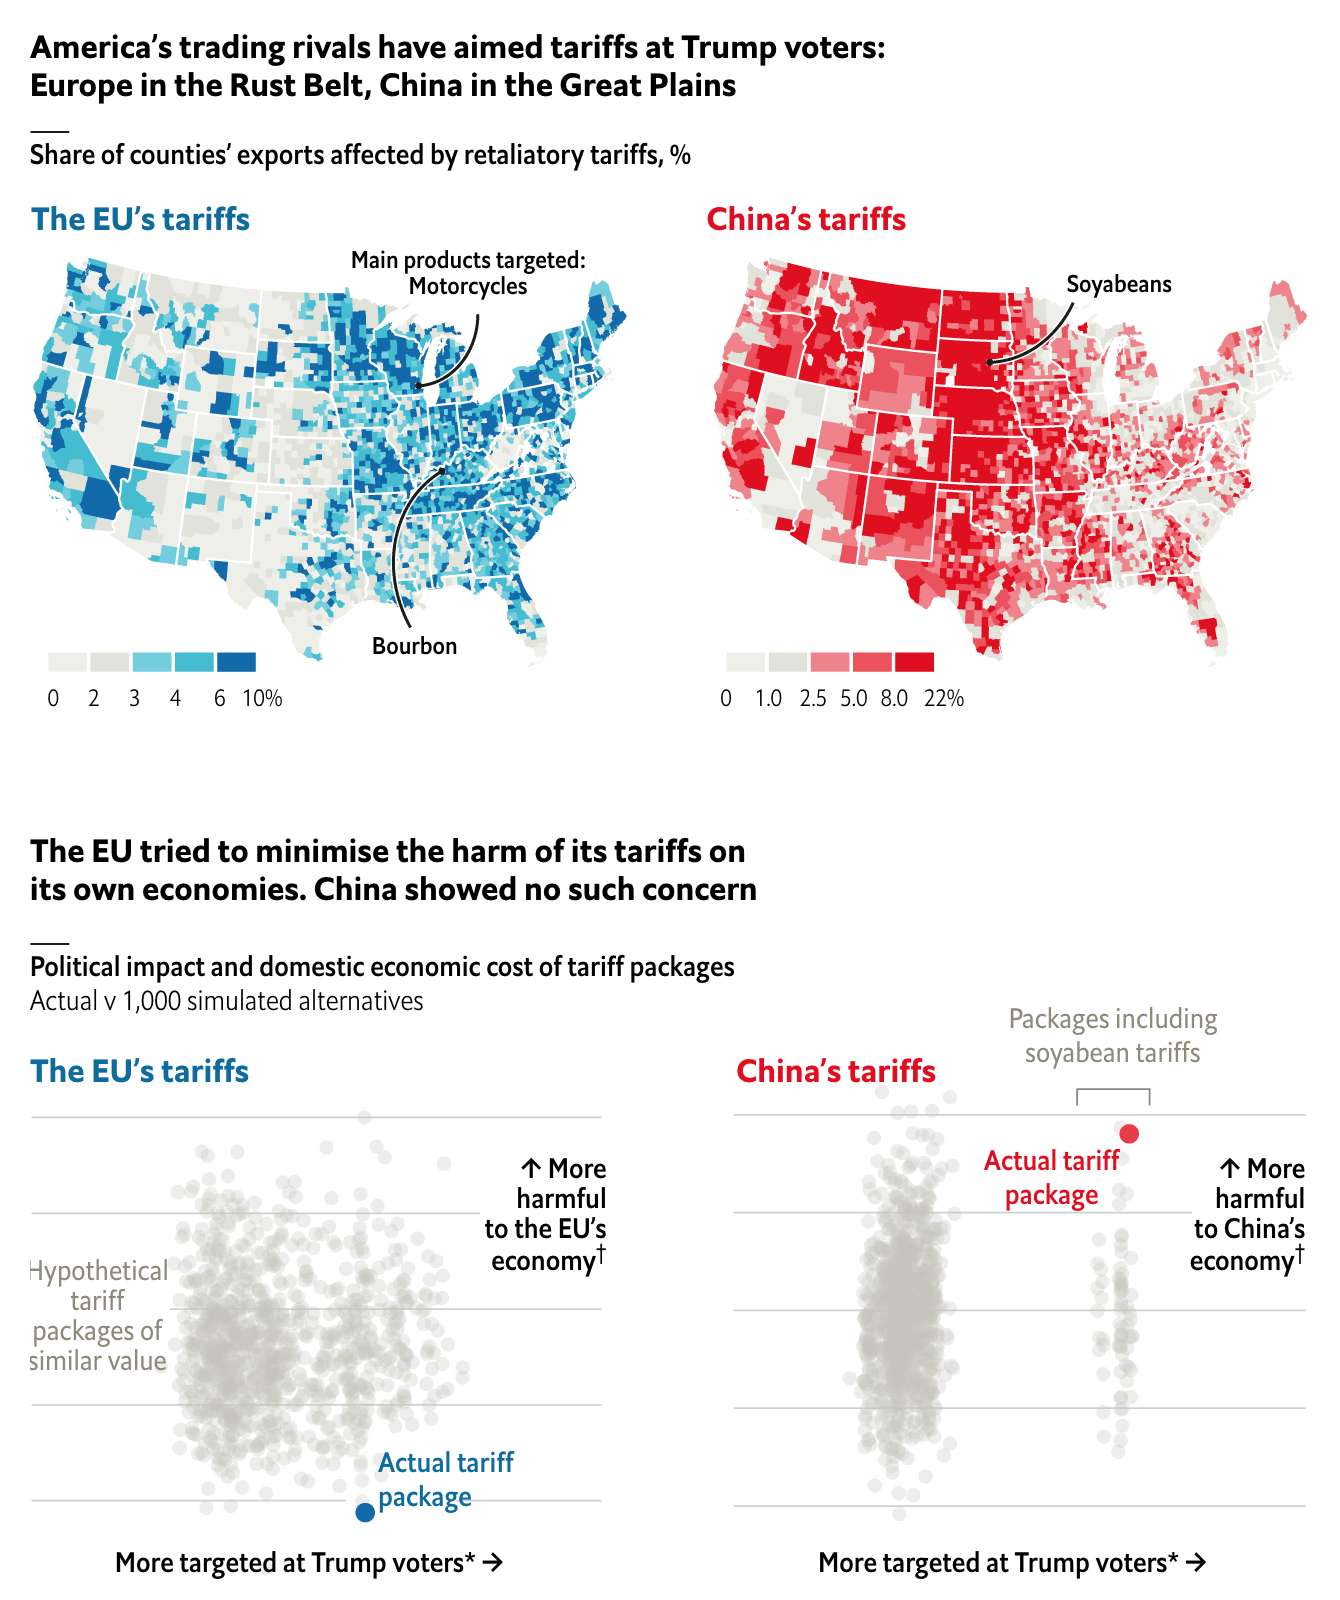
About a week and a half ago the Economist published an article about the retaliatory actions of the European Union and China against the tariffs imposed by the Trump administration. Of course last week we had a theme of sorts with lineages and ancestry. So this week, back to the fun stuff.

What makes today’s piece particularly relevant is that over the weekend, Trump announced he might increase the tariffs proposed, but not yet implemented, upon Chinese goods. So some economists looked at the retaliatory tariffs proposed by the EU and China.

Ultimately Trump's tariffs are not paid by foreign governments, but by US citizens.
Ultimately Trump’s tariffs are not paid by foreign governments, but by US citizens.

Each targets Trump voters, albeit of different types. But China appears more willing to engage in a brutal fight. Its tariff proposal would not just harm Trump voters, but would also harm Chinese citizens. The EU’s plan appears tailored to maximise the pain on Trump voters, but minimise that felt by its own citizens.

A few minor points. I like how the designers chose to highlight high impact categories with colour. Lower impact shares are two shades of light grey. But after that, the scale changes. I wonder how the maps would compare if each had been set to the same scale. It looks doable as the bottom range of the maximum bin is 6% for the EU and 8% for China. (Their high limit is much higher at 22% compared to the EU’s 10%.)

That said, it does a good job of showing the different geographic footprints of the two retaliatory tariff packages. Tomorrow—barring breaking news—we will look at why that is important.

Credit for the piece goes to the Economist Data Team.

The Great Migration Map

Yesterday in a post about Angela’s forced journey from Africa to Jamestown I mentioned that the Pilgrims arrived at Plymouth Bay just one year later in 1620. From 1620 until 1640 approximately 20,000 people left England and other centres like Leiden in the Netherlands for New England. Unlike places like Jamestown that were founded primarily for economic reasons, New England was settled for religious reasons. Consequently, whereas colonies in Virginia drew young men looking to make it rich—along with slaves to help them—New England saw entire families moving and transplanting parts of towns and England into Massachusetts, Rhode Island, Connecticut, and New Hampshire.

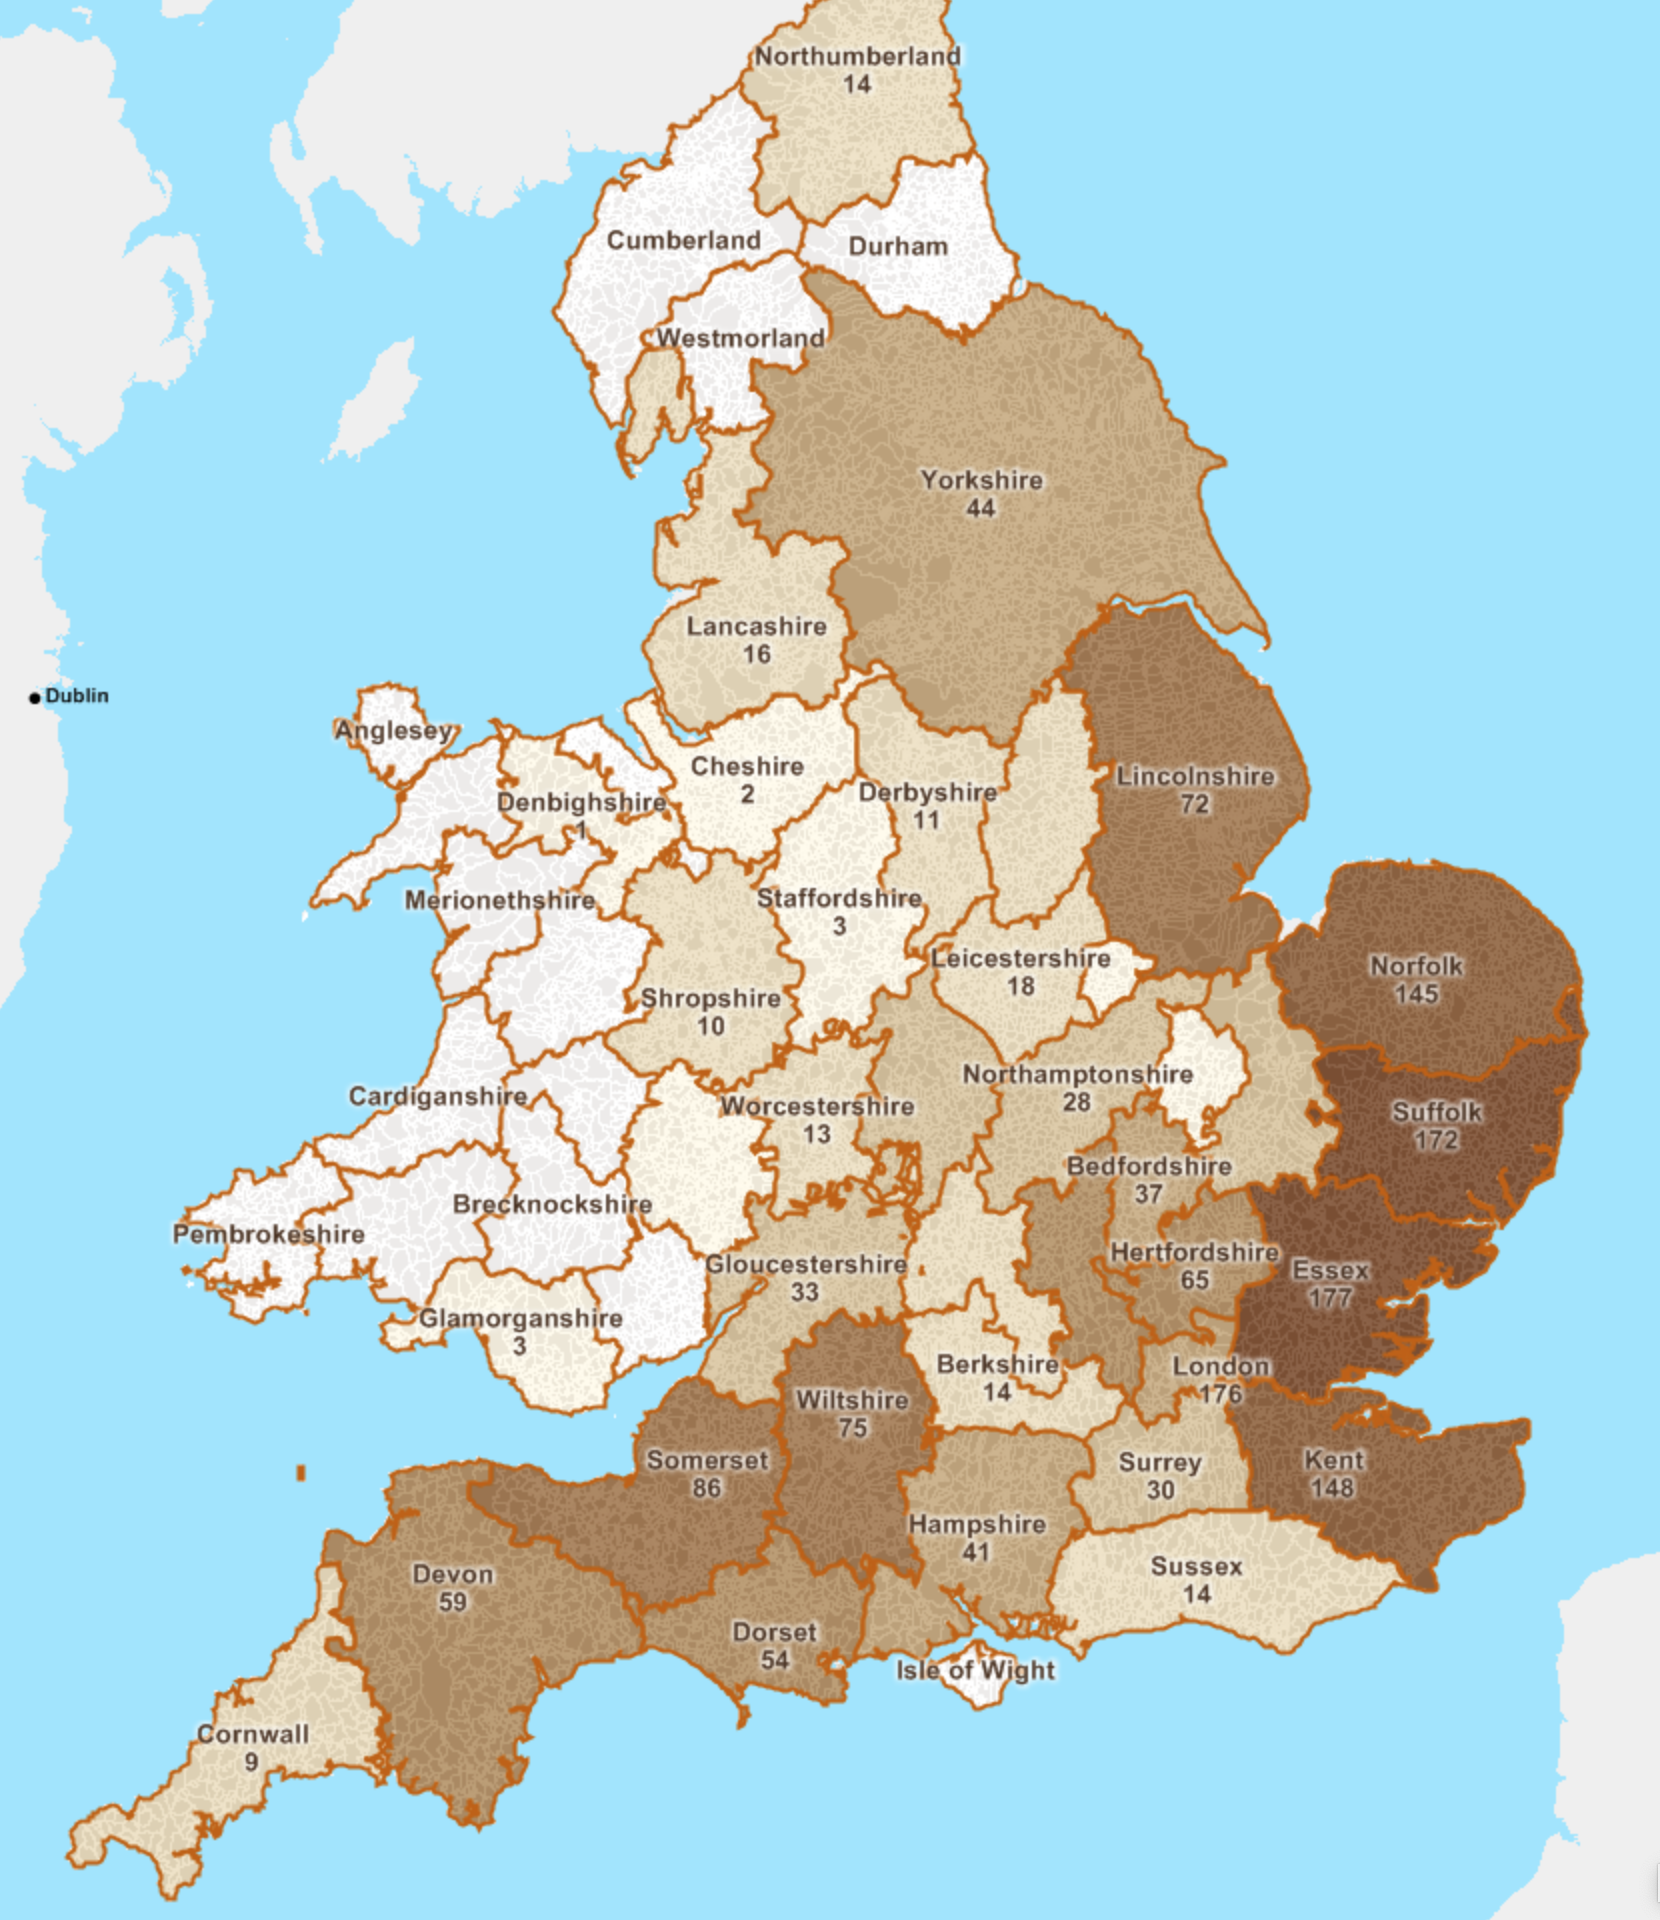
New England kept fantastic records and we know thousands of people. But we do not know whence everyone arrived, but we do know a few thousand. And this mapping project from American Ancestors attempts to capture that information at the English parish level. At its broadest level it is a county-level choropleth that shows, for those for whom we have the information, the majority of the migration, called the Great Migration, came from eastern England, with a few from the southwest.

Quite a few from Norfolk, Suffolk, and Essex

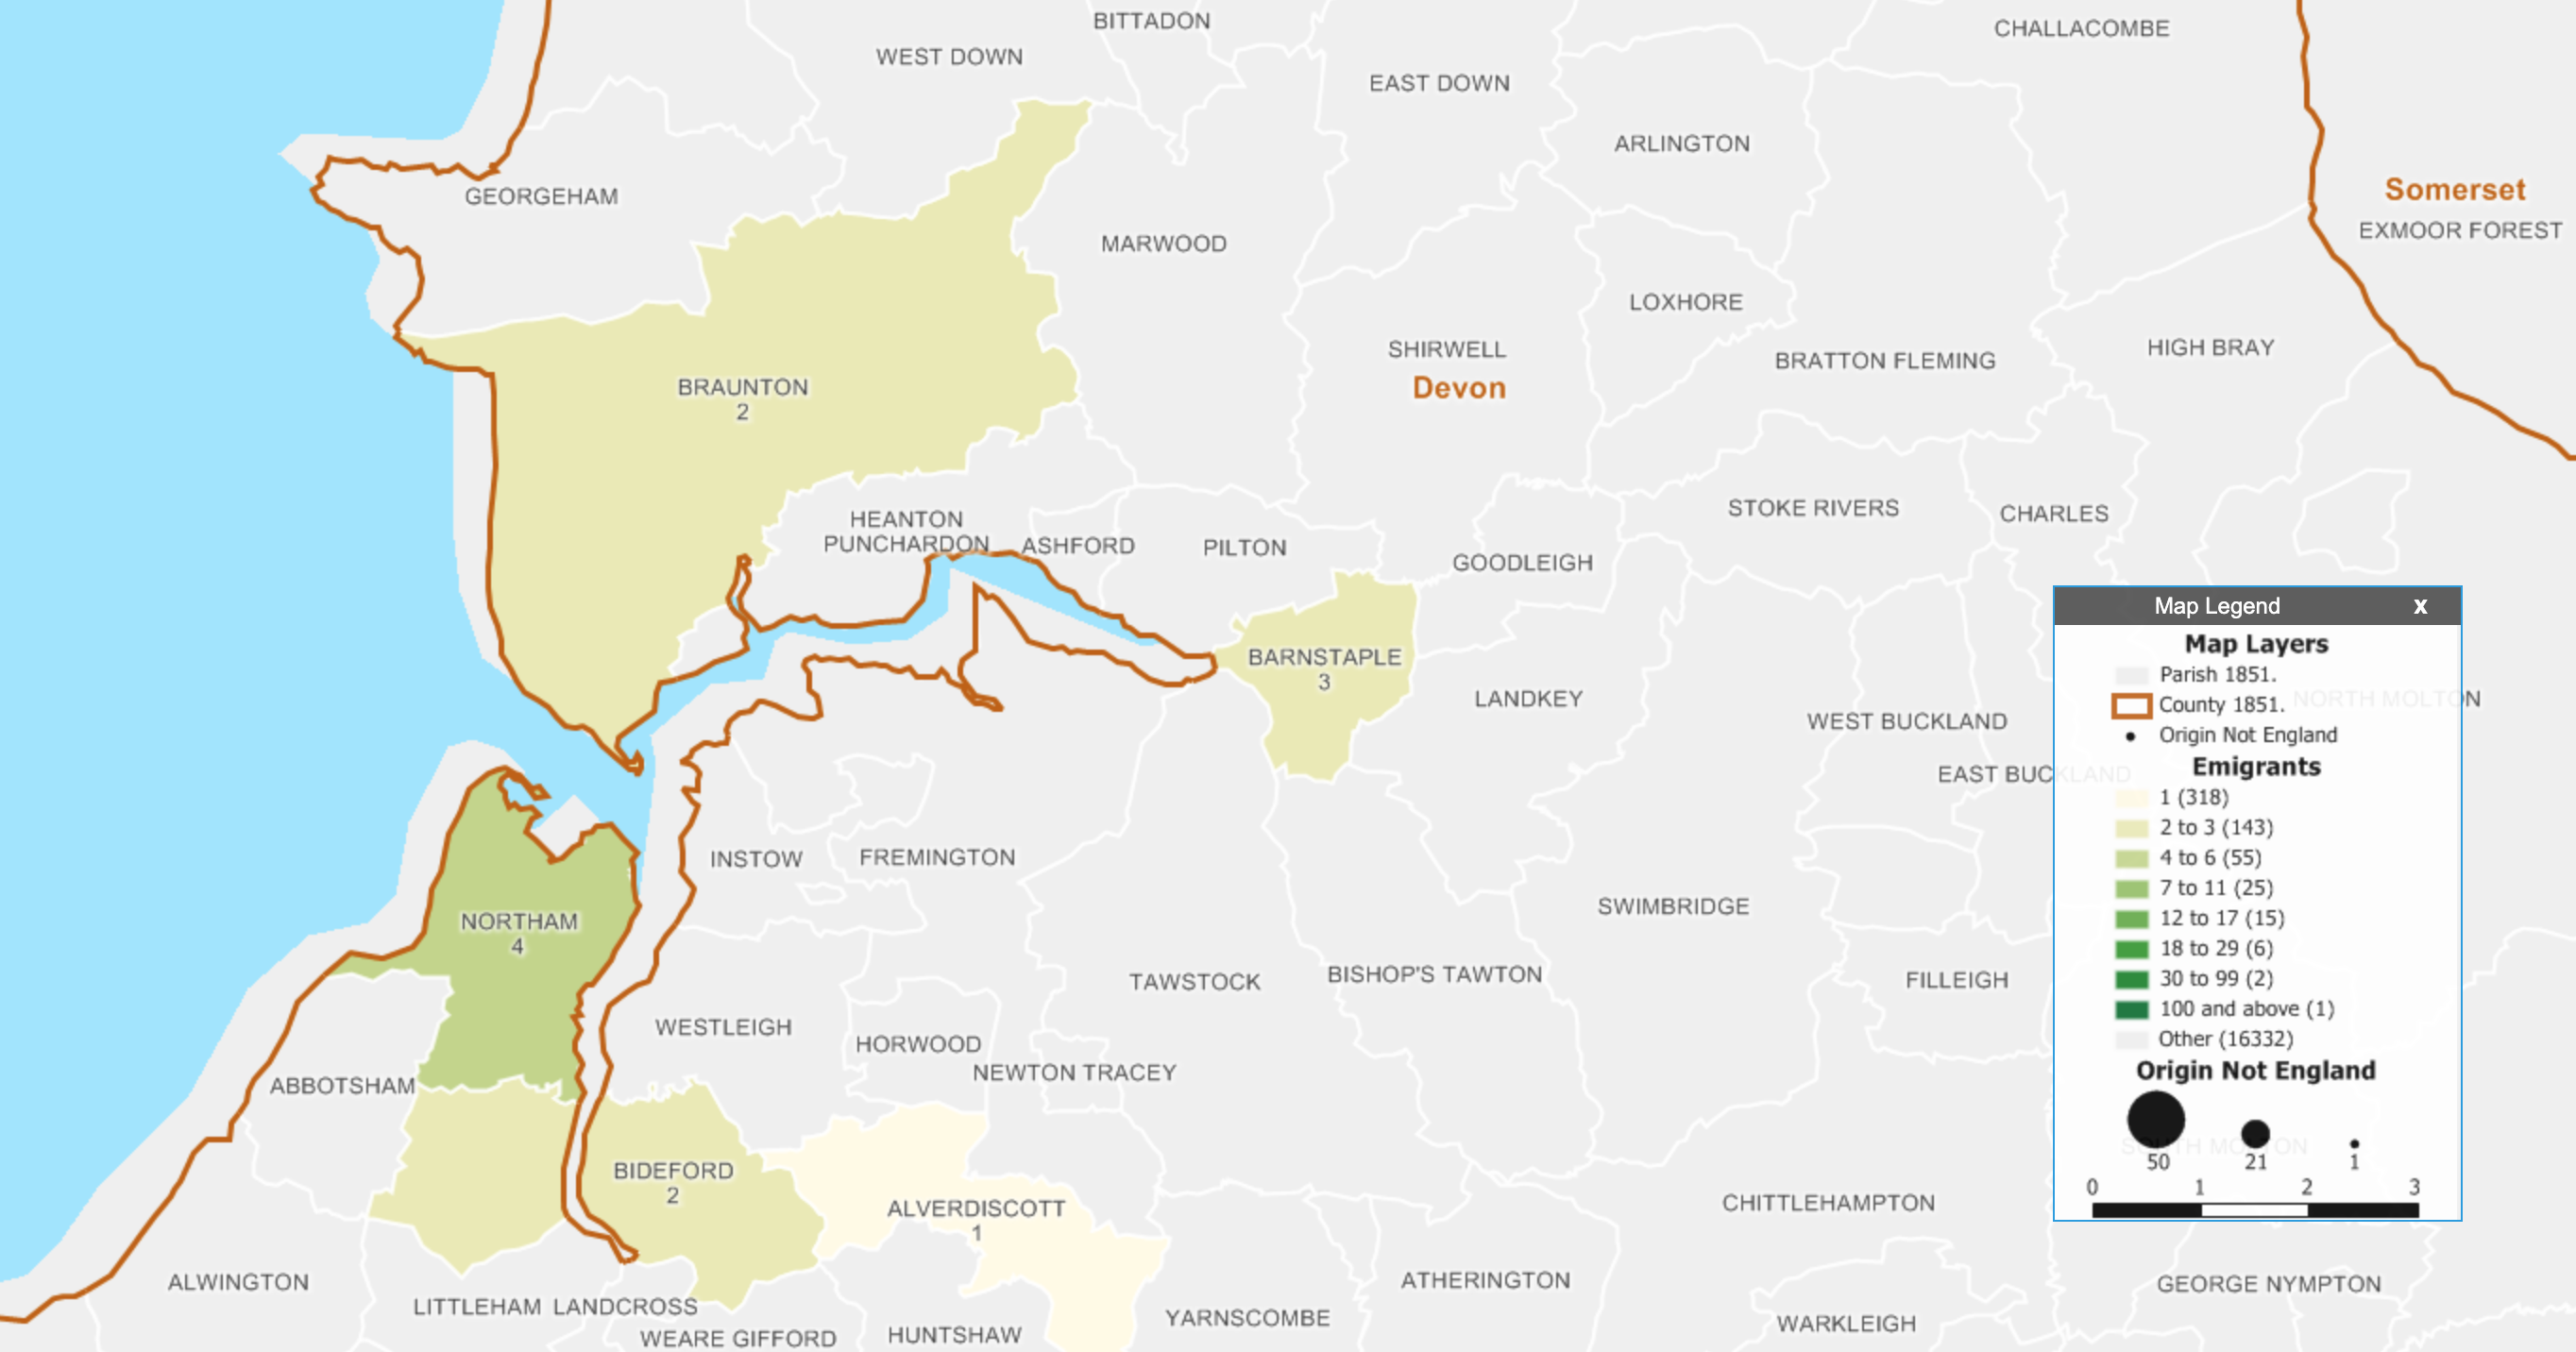
You can also search for specific people, in which case it brings into focus the county and the parishes within that have more detail. In this case I searched for my ancestor Matthew Allyn, who was one of the founders of Hartford, Connecticut. He came from Braunton in Devon and consequently appears as one of the two people connected to that parish.

Devon did not have nearly as many people emigrate as the eastern counties
But was Thomas related to Matthew? We don't know.
But was Thomas related to Matthew? We don’t know.

Overall, it’s a nice way of combining data visualisation and my interest/hobby of genealogy. The map uses the historical boundaries of parishes prior to 1851, which is important given how boundaries are likely to change over the centuries.

This will be a nice tool for those interested in genealogy and that have ancestors that can be traced back to England. I might be biased, but I really like it.

Credit for the piece goes to Robert Charles Anderson, Giovanni Flammia, Peter H. Van Demark.

Carbon Taxes

Last week the New York Times published an article about carbon taxes, looking at their adoption around the world and their effectiveness. It is a fascinating article about how different countries have chosen to implement the broad policy idea and the various forms it can take. And, most importantly, how some of those policies can end up blunting the intended effect of carbon emission reduction.

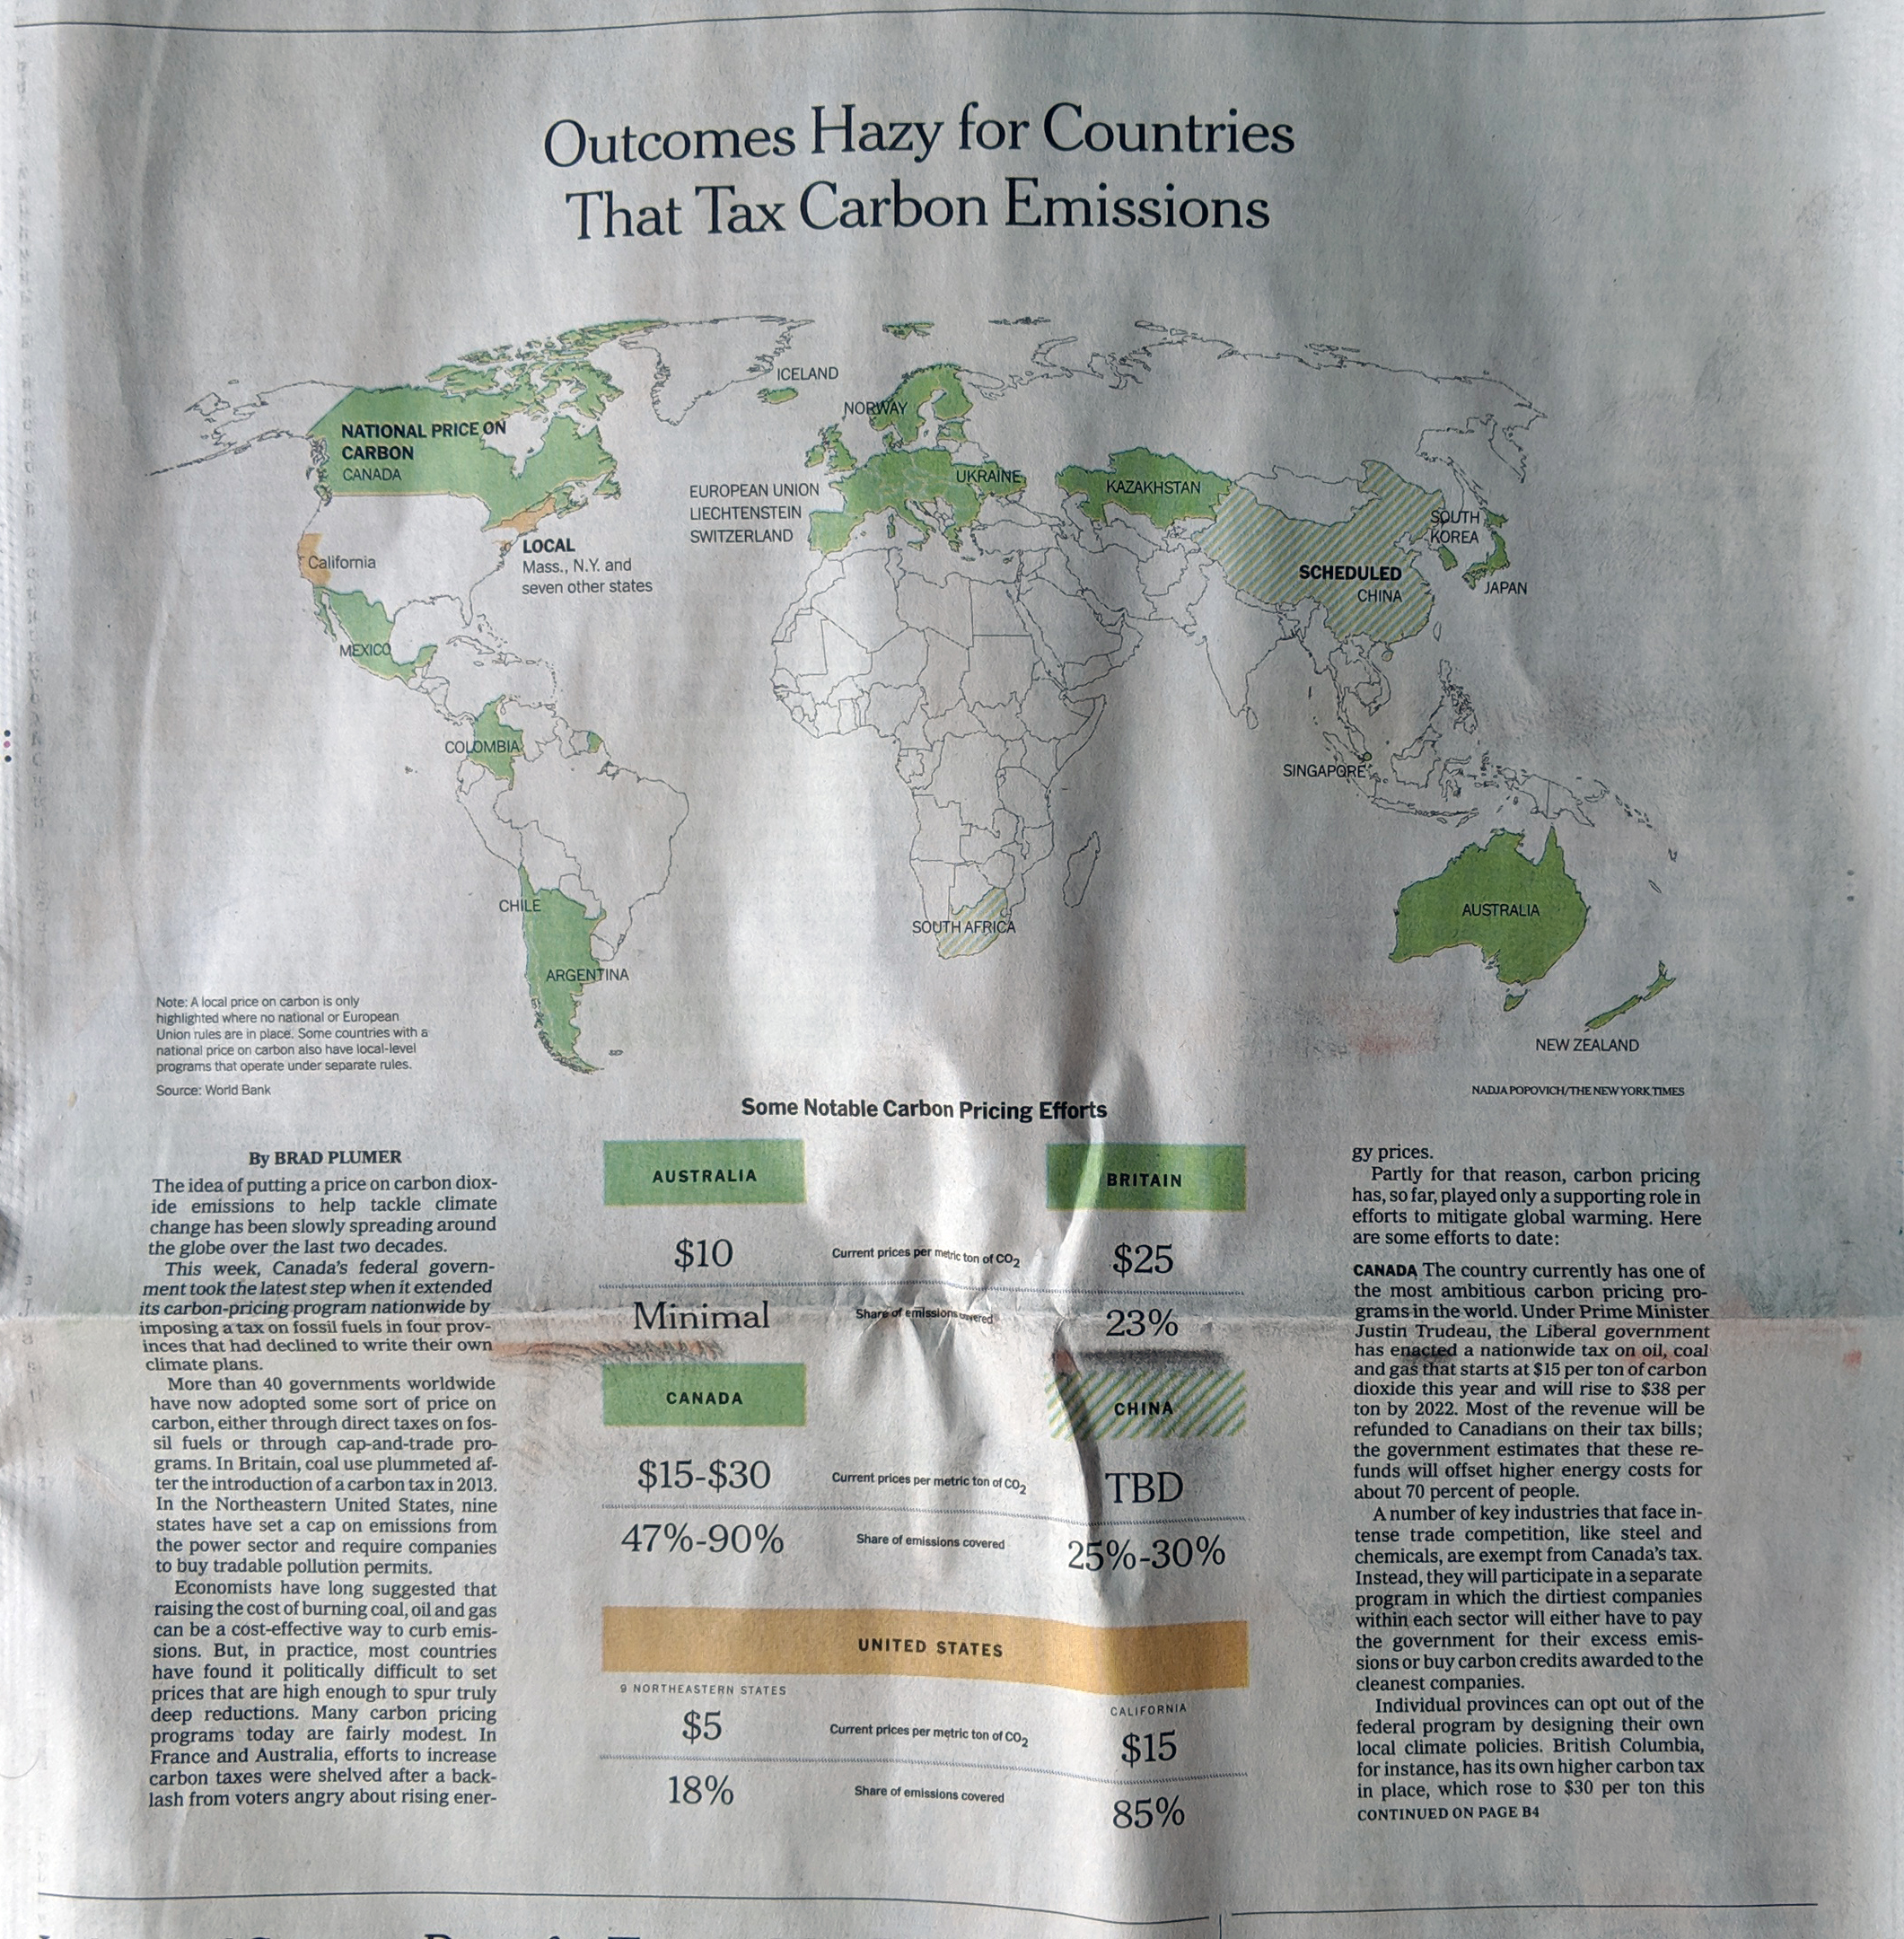
This, however, is about the print piece, because as I was flipping through the morning paper, I found the Business section had a world map above the fold. And we all know how I feel about big, splashy print graphics.

We could use some more green on this map

Here we have a pretty straight-forward piece. It uses a map to indicate which countries have adopted or are scheduled to adopt a carbon tax programme. The always interesting bit is how the federal system in the United States is represented. Whilst a carbon cap-and-trade deal failed in the US Senate in 2009, individual states have taken up the banner and begun to implement their own plans. Hence, the map shows the states in yellow.

There is nothing too crazy going on in the piece, but it is just a reminder that sometimes, as a designer, I love big splashy graphics to anchor an article.

Credit for the piece goes to Brad Plumer.

Regions of German Nationalism

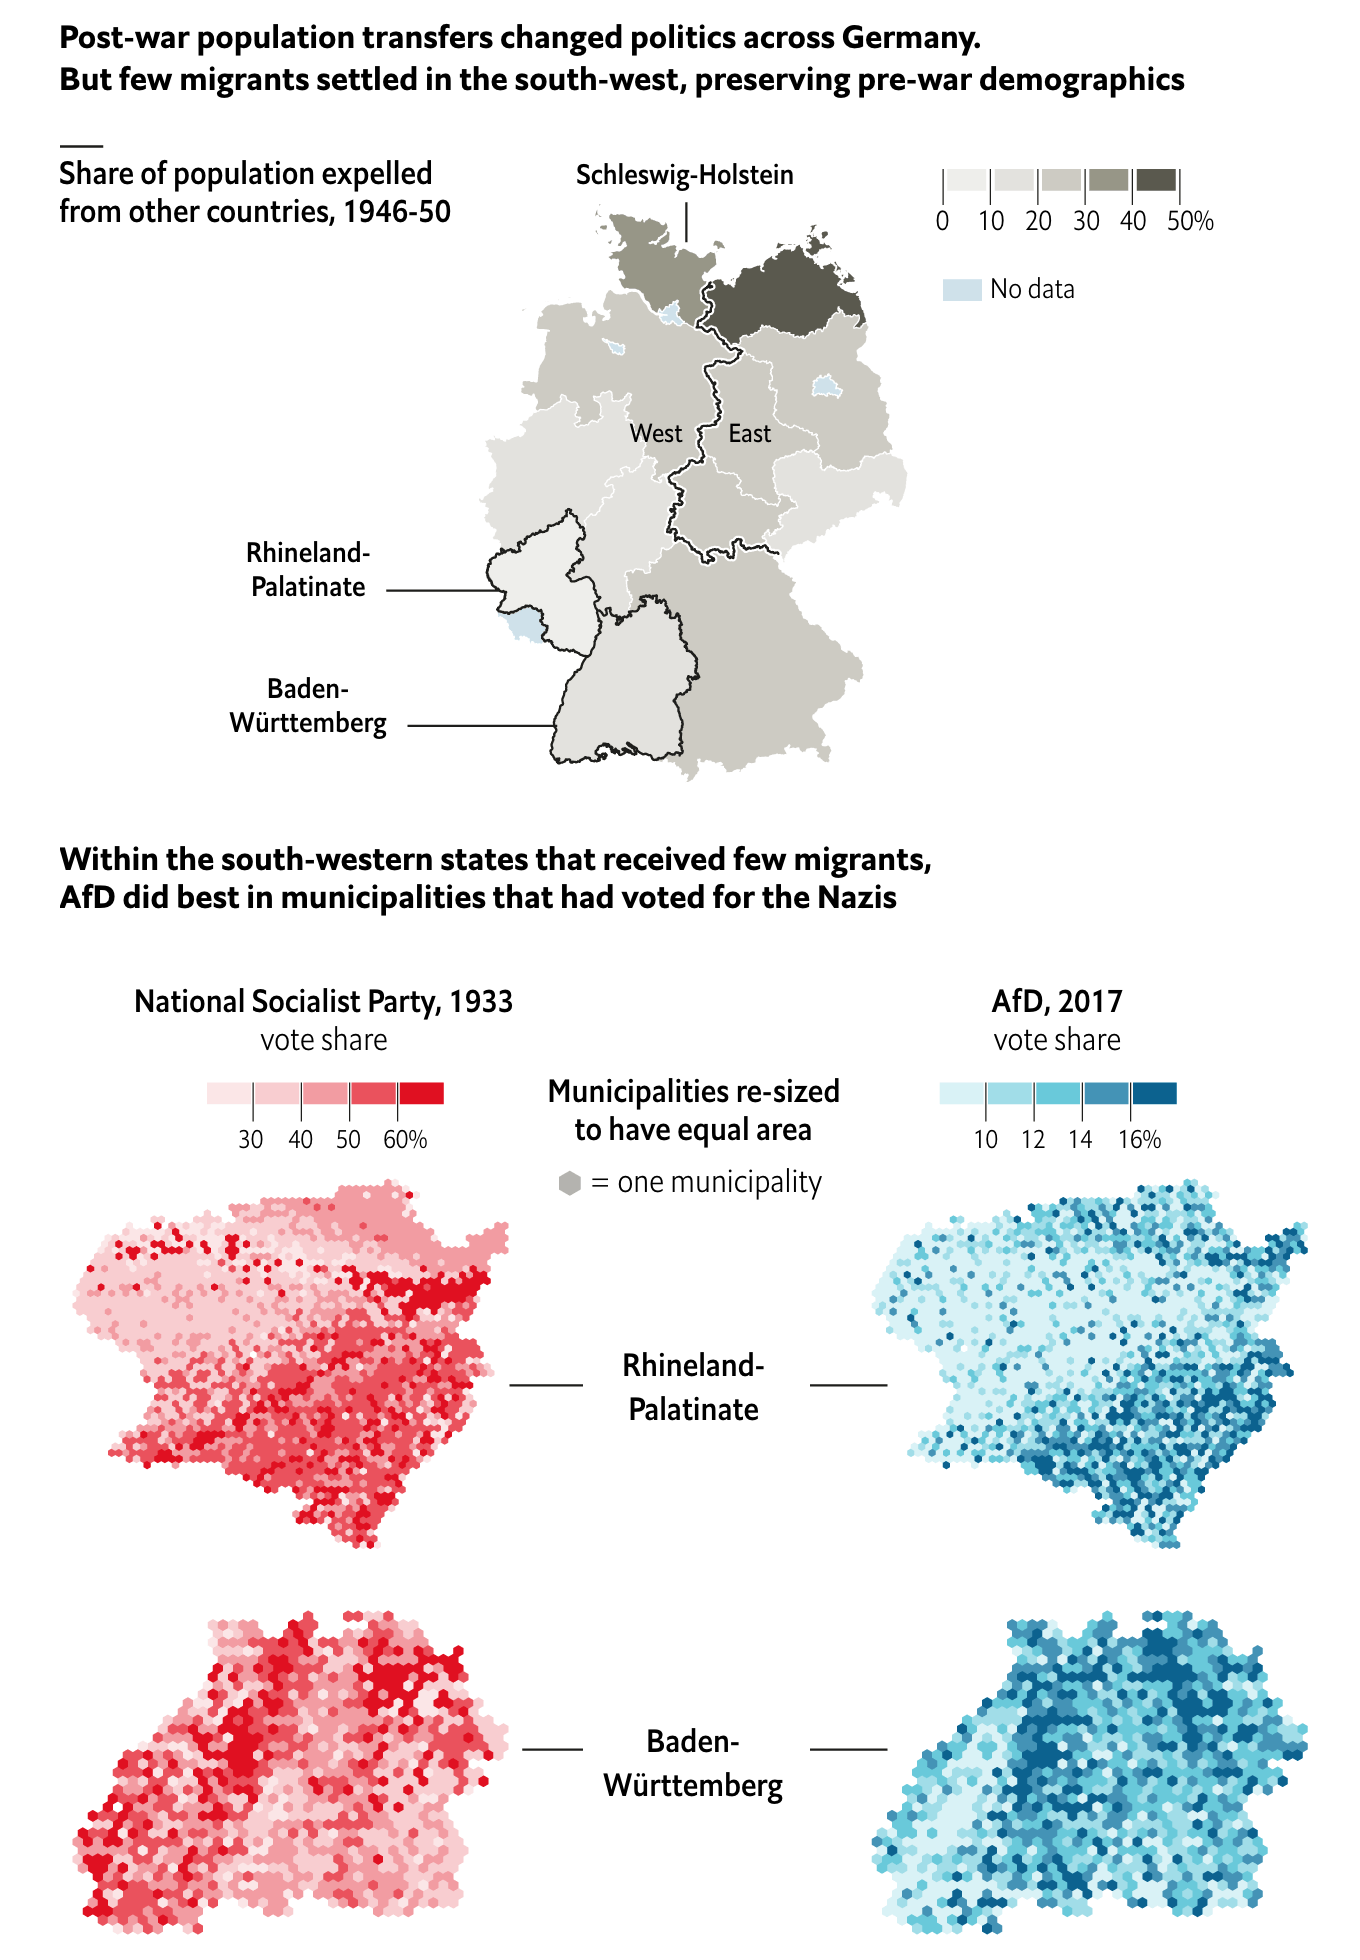
The Economist has an interesting piece looking at the areas of support for the far-right AfD German political party, arguably a neo-fascist nationalist party. It turns out that

Historical analogies are dangerous, but fascinating.

The piece does a great job of setting the case through the demographics map at the top of the piece. It shows how the two areas where the largest AfD support experienced the least changes from prior to the war. And with those demographics in place, the support for hardline nationalism might still be present, as is indicated by the support for the AfD.

In terms of the municipality maps, I would be curious if the hexagon tile map is because those borders have changed. Obviously 84 years can change political boundaries.

But I wonder if a single map could have been done showing the correlation between the 1933 vote and the 2017 vote. Of course, the difficulty could well be in that political boundaries may have changed.

And of course, we should not go so far as to compare the AfD to Nazism.

Credit for the piece goes to the Economist graphics department.

The World Grows On and On

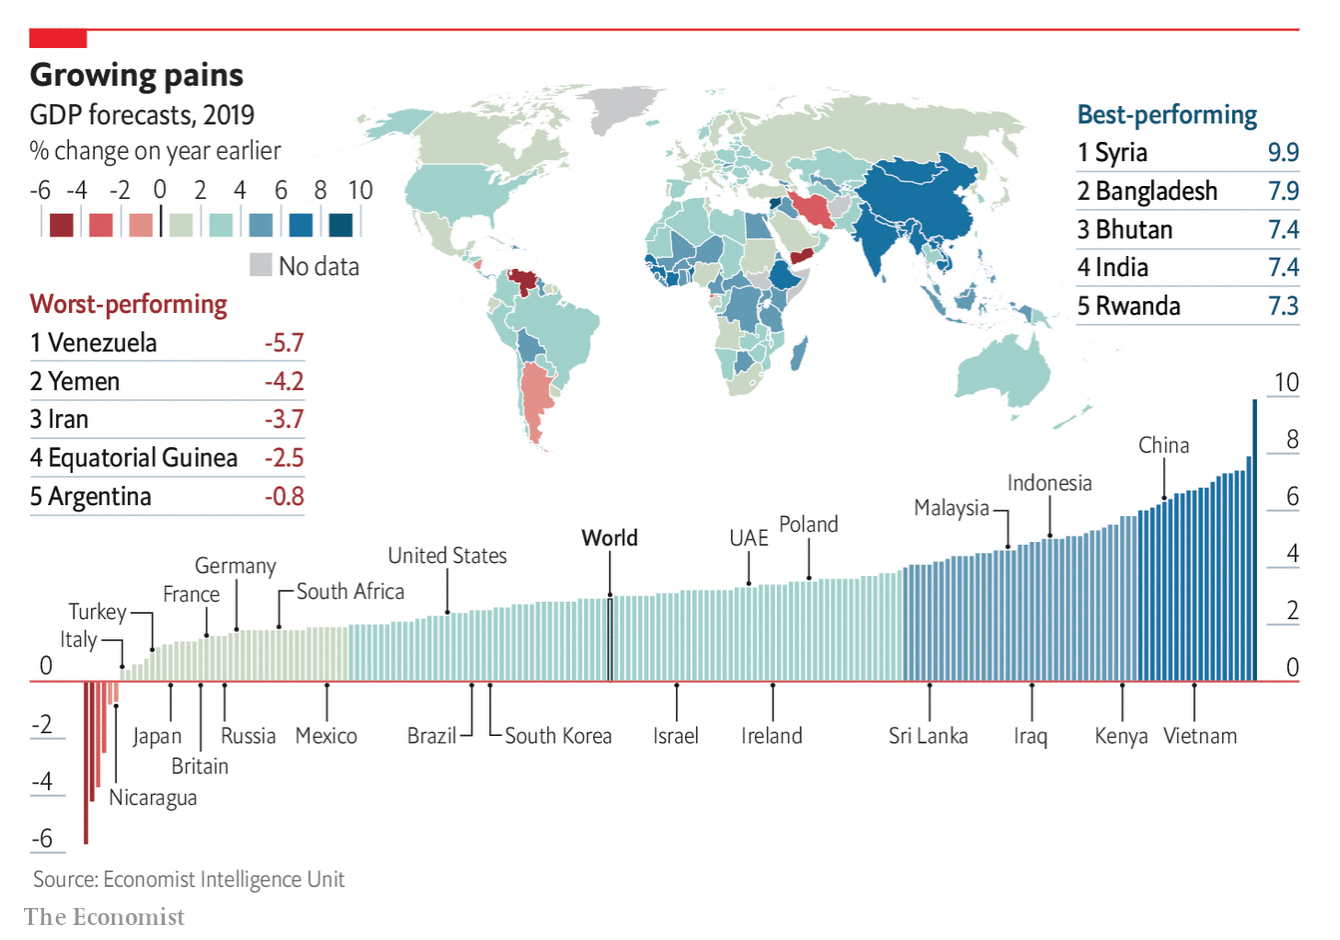
I mentioned this this time last year, but I used to make a lot of datagraphics about GDP growth. The format here has not changed and so there is nothing new to look at there. But, the content is still interesting. And the accompanying Economist article makes the point that high growth rates are not always what they seem. After all, Syria’s high growth rate is because its base is so small.

The 2019 GDP growth forecasts

Credit for the piece goes to the Economist Data Team.

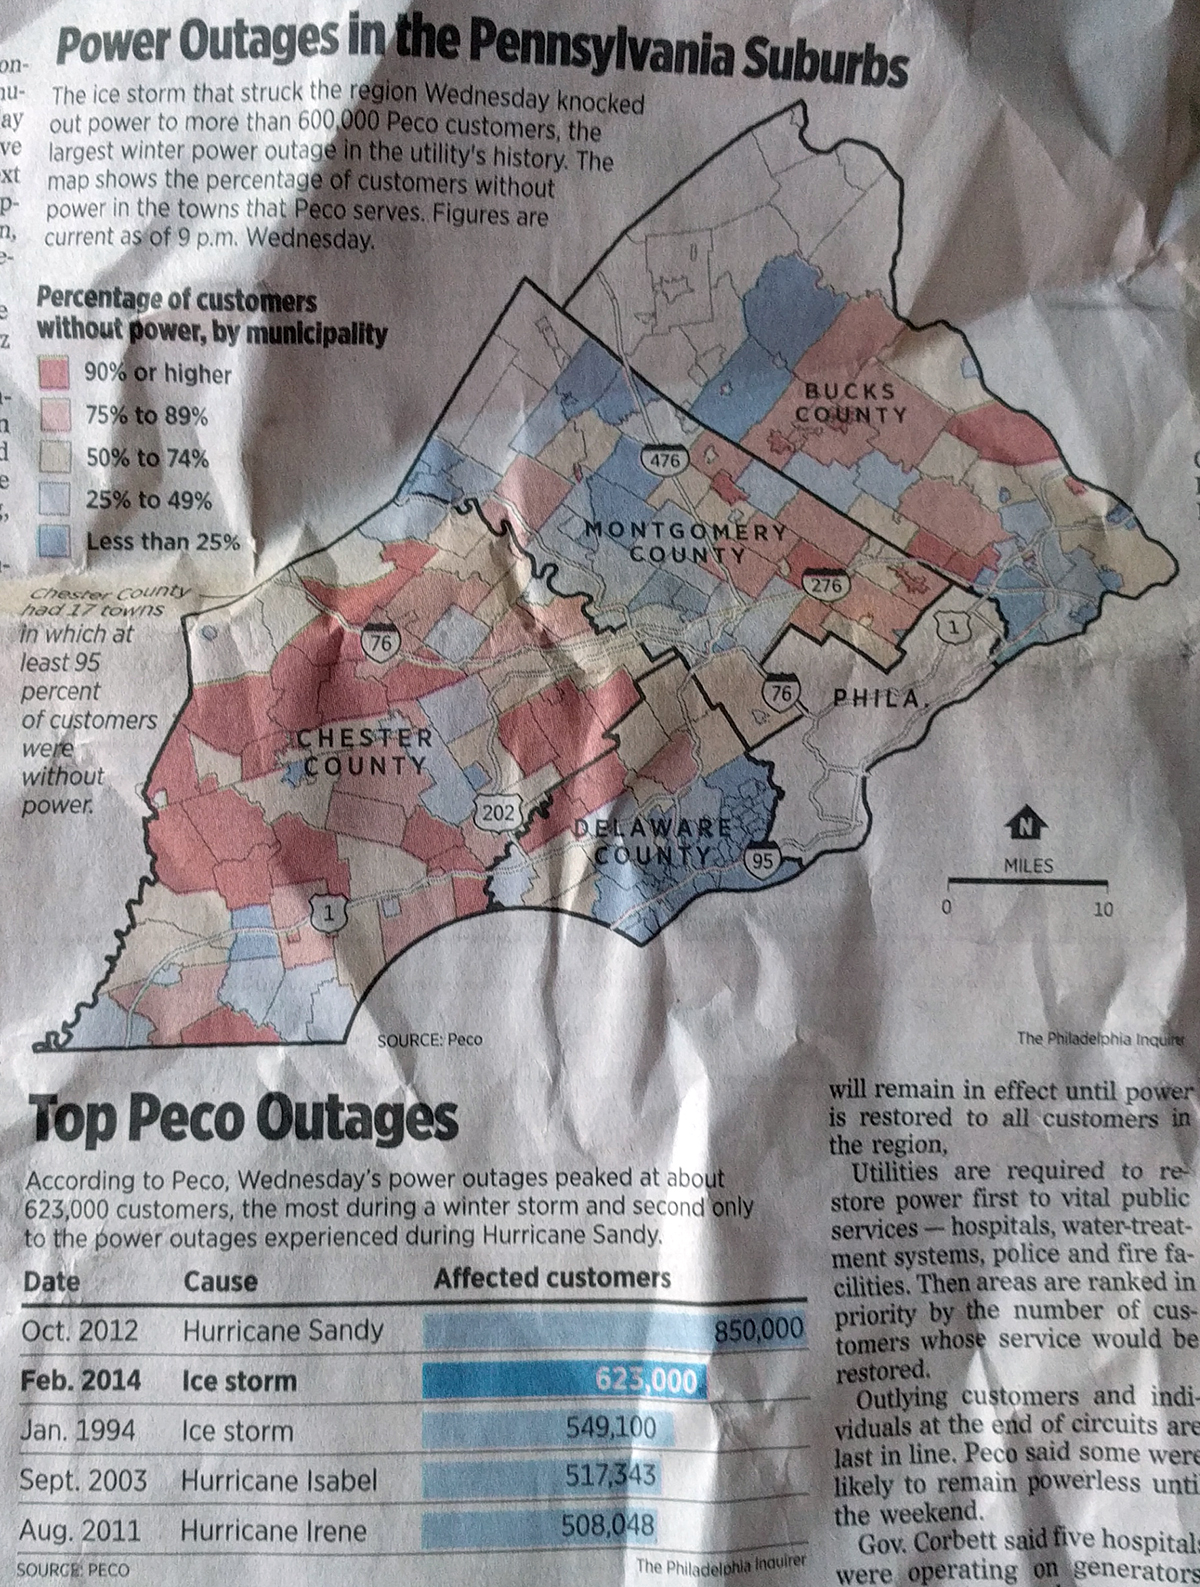
PECO Outages Five Years Ago

Christmas time is a time when people receive gifts. Well this year was no different and I received a few. One, however, was in a box stuffed with old newspaper pages. And it turns out one of said pages had a graphic on it. So let us spend today looking at this little blast from the past.

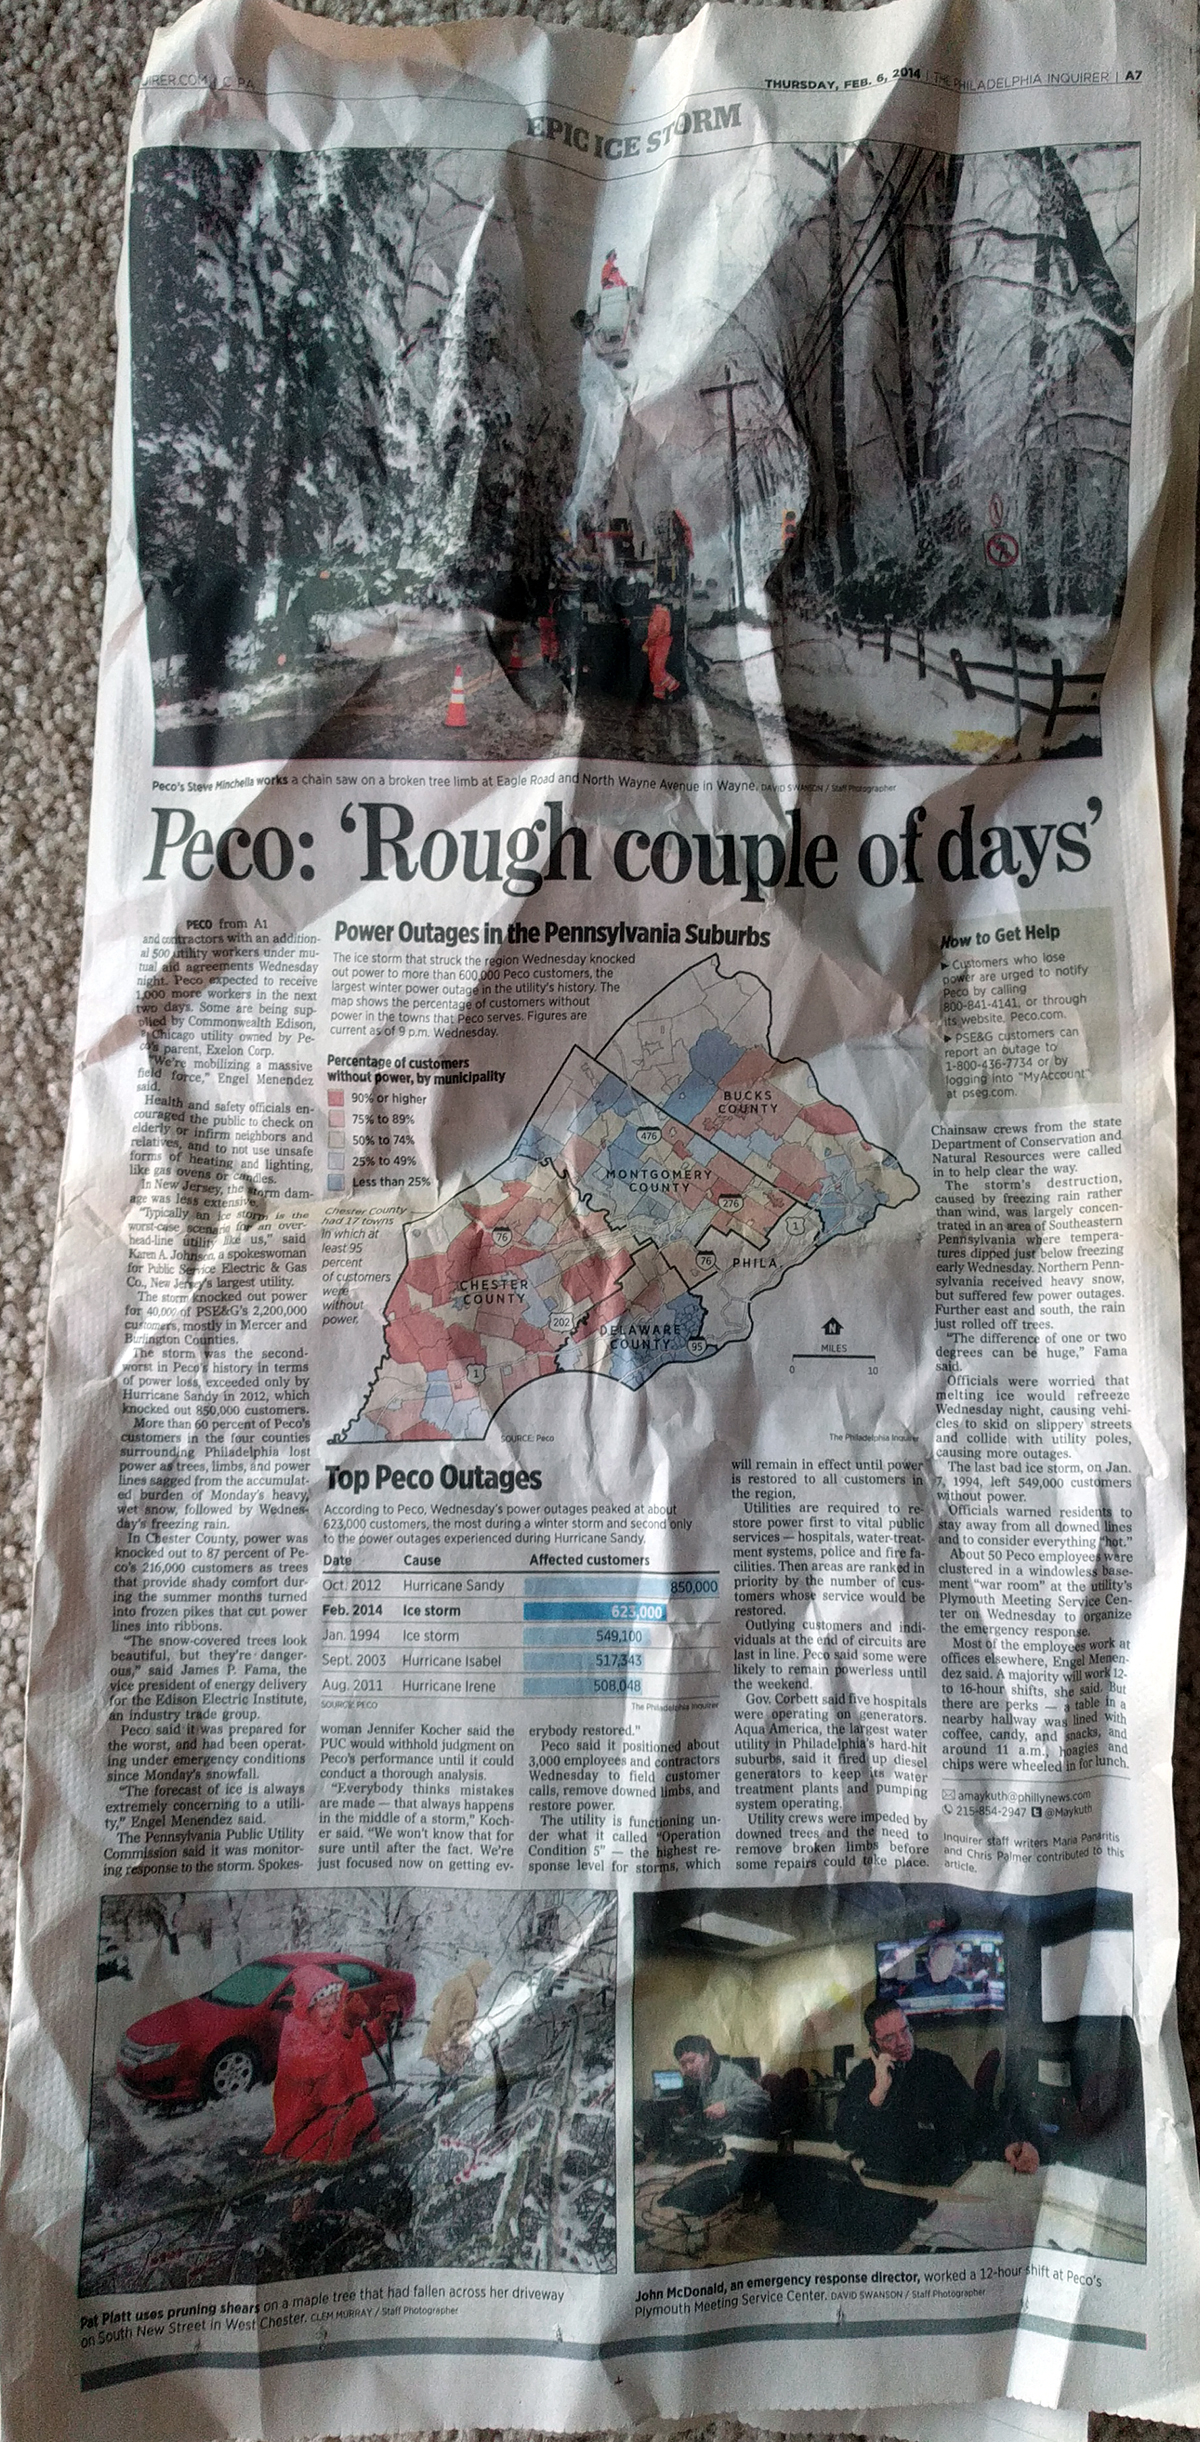
The piece looks at PECO outages, PECO being the Philadelphia region’s main electricity supplier. The article is full page and is both headed and footed with photography, the graphic in which we are interested sits centre stage in the middle of the page.

Full page design.
Full page design.

Overall the graphic is fairly compact and works well at showing the distribution of the outages, which the bar chart below the choropleth shows was historically significant. (Despite my years in Chicago, I was somehow in the area for all but the storm written about and can confirm that they were, in fact, disruptive.)

Ice storms suck.
Ice storms suck.

The choropleth works, but I question the colour scheme. The bins diverge at about 50%, which to my knowledge marks no special boundary other than “half”. If that yellow bin represented, say, the average number of outages per storm or the acceptable number of outages per storm, sure, I could buy it. Otherwise, this is really just degrees of severity along one particular axis. I would have either kept the bins all red or all blue and proceeded from a light of either to a dark of either.

I probably would have also dropped Philadelphia entirely from the map, but I can understand how it may be important to geographically anchor readers in the most populous county to orientate themselves to a story about suburbia.

Lastly, I have one data question. With power lines down during an ice storm, I would be curious to see less of the important roadways as the map depicts and other variables. What about things like average temperature during the storm? Was the more urban and built-up Delaware County less susceptible because of an urban heat bubble preventing water from freezing? Or what about trees? Does the impact in the more rural areas have anything to do with increasing numbers of trees as one heads away from the city?

Those last data questions were definitely out of scope for the graphic, but I nevertheless remain curious. But then again, this piece is almost five years old. Just a look at how some graphical forms remain in use because of their solid ability to communicate data. Long live the bar chart. Long live the choropleth.

Credit for the piece goes to the Philadelphia Inquirer graphics department.