How Mass Shootings Have Changed

A few weeks ago here in the United States, we had the mass shootings in El Paso, Texas and Dayton, Ohio. The Washington Post put together a piece looking at how mass shootings have changed since 1966. And unfortunately one of the key takeaways is that since 1999 they are far too common.

The biggest graphic from the article is its timeline.

Getting worse over time

It captures the total number of people killed per event. But, it also breaks down the shootings by admittedly arbitrary time periods. Here it looks at three distinct ones. The first begins at the beginning of the dataset: 1966. The second begins with Columbine High School in 1999, when two high school teenagers killed 13 fellow students. Then the third begins with the killing of 9 worshippers in a African Episcopal Methodist church in Charlestown, South Carolina.

Within each time period, the peaks become more extreme, and they occur more frequently. The beige boxes do a good job of calling out just how frequently they occur. And then the annotations call out the unfortunate historic events where record numbers of people were killed.

The above is a screenshot of a digital presentation. However, I hope the print piece did a full-page printing of the timeline and showed the entire timeline in sequence. Here, the timeline is chopped up into two separate lines. I like how the thin grey rule breaks the second from the third segment. But the reader loses the vertical comparison of the bars in the first segment to those in the second and third.

Later on in the graphic, the article uses a dot plot to examine the age of the mass shooters. There it could have perhaps used smaller dots that did not feature as much overlap. Or a histogram could have been useful as infrequently used type of chart.

Lastly it uses small multiples of line charts to show the change in frequency of particular types of locations.

Overall it’s a solid piece. But the timeline is its jewel. Unfortunately, I will end up talking about similar graphics about mass shootings far too soon in the future.

Credit for the piece goes to Bonnie Berkowitz, Adrian Blanco, Brittany Renee Mayes, Klara Auerbach, and Danielle Rindler.

United in Gun Control

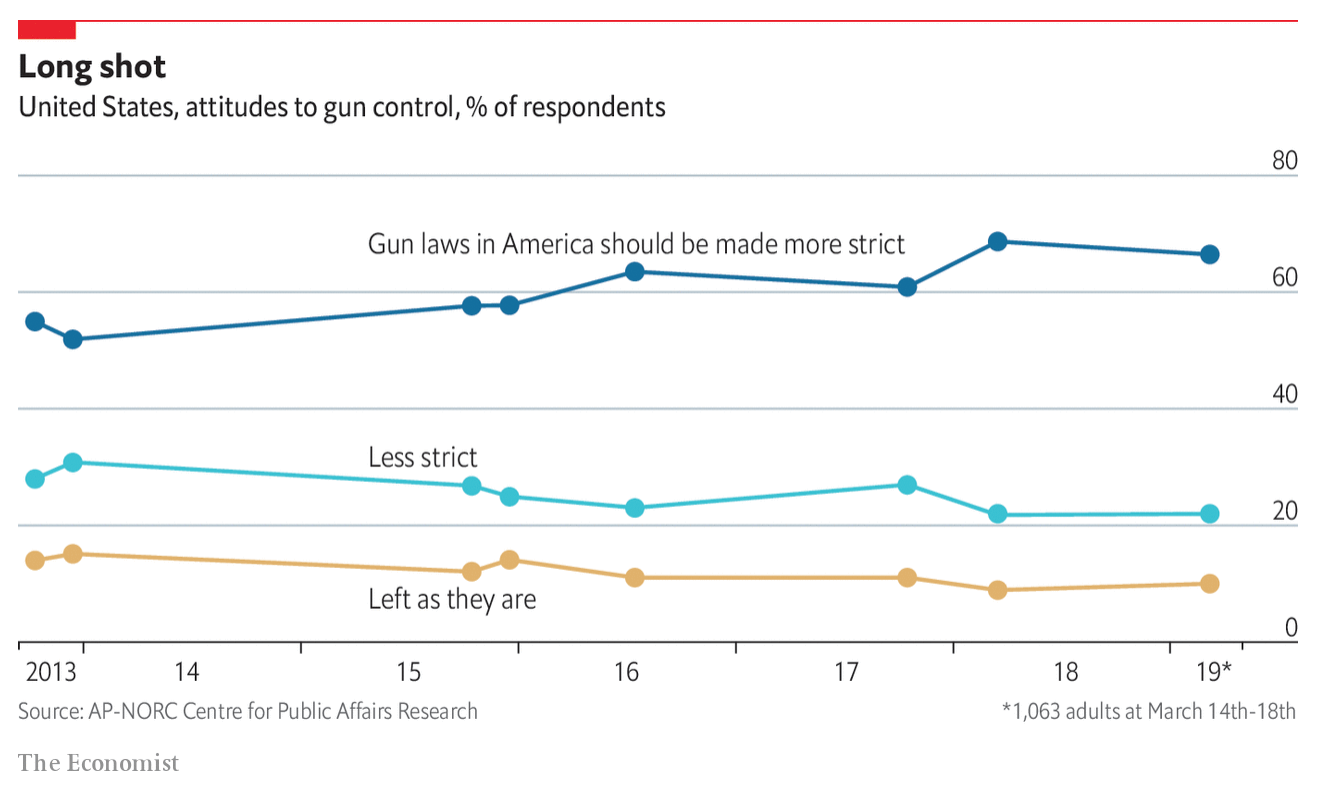
Today’s piece is nothing more than a line chart. But in the aftermath of this past weekend’s gun violence—and the inability of this country to enact gun control legislation to try and reduce instances like them—the Economist published a piece looking at public polling on gun control legislation. Perhaps surprisingly, the data shows people are broadly in favour of more restrictive gun laws, including the outlawing of military-style, semi-automatic weapons.

These trendlines are heading in the right direction

In this graphic, we have a line chart. However the import parts to note are the dots, which is when the survey was conducted. The lines, in this sense, can be seen as a bit misleading. For example, consider that from late 2013 through late 2015 the AP–NORC Centre conducted no surveys. It is entirely possible that support for stricter laws fell, or spiked, but then fell back to the near 60% register it held in 2015.

On the other hand, given the gaps in the dataset, lines would be useful to guide the reader across the graphic. So I can see the need for some visual aid.

Regardless, support for stricter gun laws is higher than your author believed it to be.

Credit for the piece goes to the Economist graphics department.

The Ebola Outbreak in the Congo

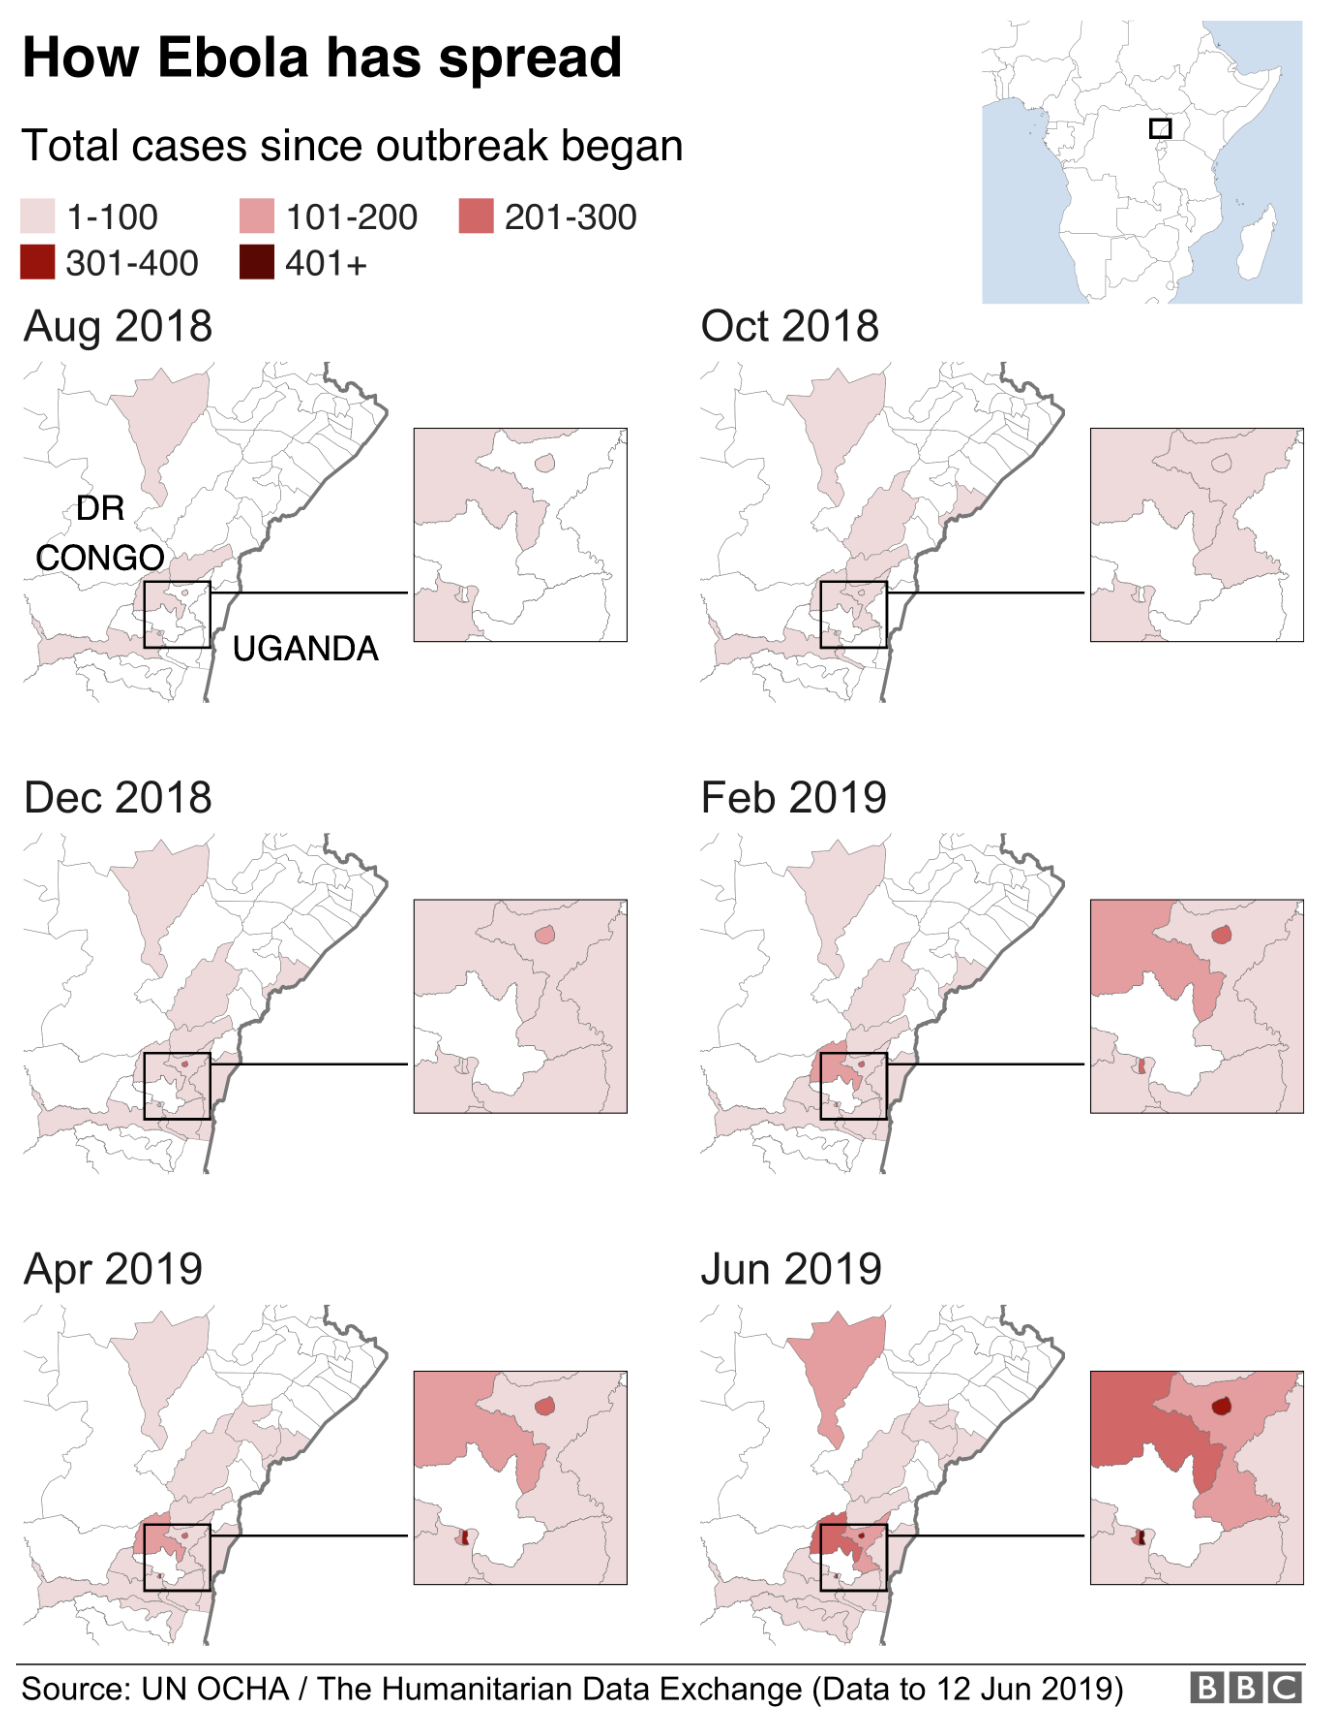
Ebola, which killed 11,000 people in West Africa in 2014 (which I covered in a couple of different posts), is back and this time ravaging the Congo region, specifically the Democratic Republic of the Congo (DRC). The BBC published an article looking at the outbreak, which at 1,400 deaths is still far short of the West Africa outbreak, but is still very significant.

That's looking like a tenuous border right now…
That’s looking like a tenuous border right now…

The piece uses a small multiples of choropleths for western Congo. The map is effective, using white as the background for the no case districts. However, I wonder, would be more telling if it were cases per month? That would allow the user to see to where the outbreak is spreading as well as getting a sense of if the outbreak is accelerating or decelerating.

The rest of the article features four other graphics. One is a line chart that also looks at cumulative cases and deaths. And again, that makes it more difficult to see if the outbreak is slowing or speeding up. Another is how the virus works and then two are about dealing with the virus in terms of suits and the containment camps. But those are graphics the BBC has previously produced, one of which is in the above links.

Credit for the piece goes to the BBC graphics department.

The Tory Leadership Race: The Favourite and All the Also Rans

This piece was published Monday, so it’s one round out of date, but it still holds true. It looks at the betting odds of each of the candidates looking to enter No. 10 Downing Street. And yeah, it’s going to be Boris.

That's a pretty sizable gap
That’s a pretty sizable gap

The thing that strikes me as odd about this piece however, is note the size of the circles. Why are they larger for Boris Johnson and Rory Stewart? It cannot be proportional to their odds of victory or else Boris’ head would be…even bigger. Is that even possible? Maybe it relates to their predicted placement of first and second, the two of which go to the broader Tory party for a vote. It’s really unclear and deserves some explanation.

The graphic also includes a standard line chart. It falls down because of spaghettification in that all those also rans have about the same odds, i.e. slim, to beat Boris.

Perhaps the most interesting thing to follow is who will be the other person on the ballot. But then who remembers Andrea Leadsom was the runner up to Theresa May?

Credit for the piece goes to the Economist graphics department.

Living in the Dark

Earlier this month the Economist published an article that looked at a different way of measuring the economic output of North Korea. The state is so secretive that the publicly available data we all rely on for almost every country is not available. Nor would we necessarily believe their figures. So we have to rely on other measures to estimate the North Korean economy.

The article is about how luminosity, i.e. the lights on seen from space at night, can be used as a proxy for economic activity in the reclusive state.

No lights to guide me home

The article is a fascinating read and uses a scatter plot to show the correlation between luminosity and GDP per capita then how that translates to North Korea, comparing it to older models.

Credit for the piece goes to the Economist graphics department.

Bad Endings

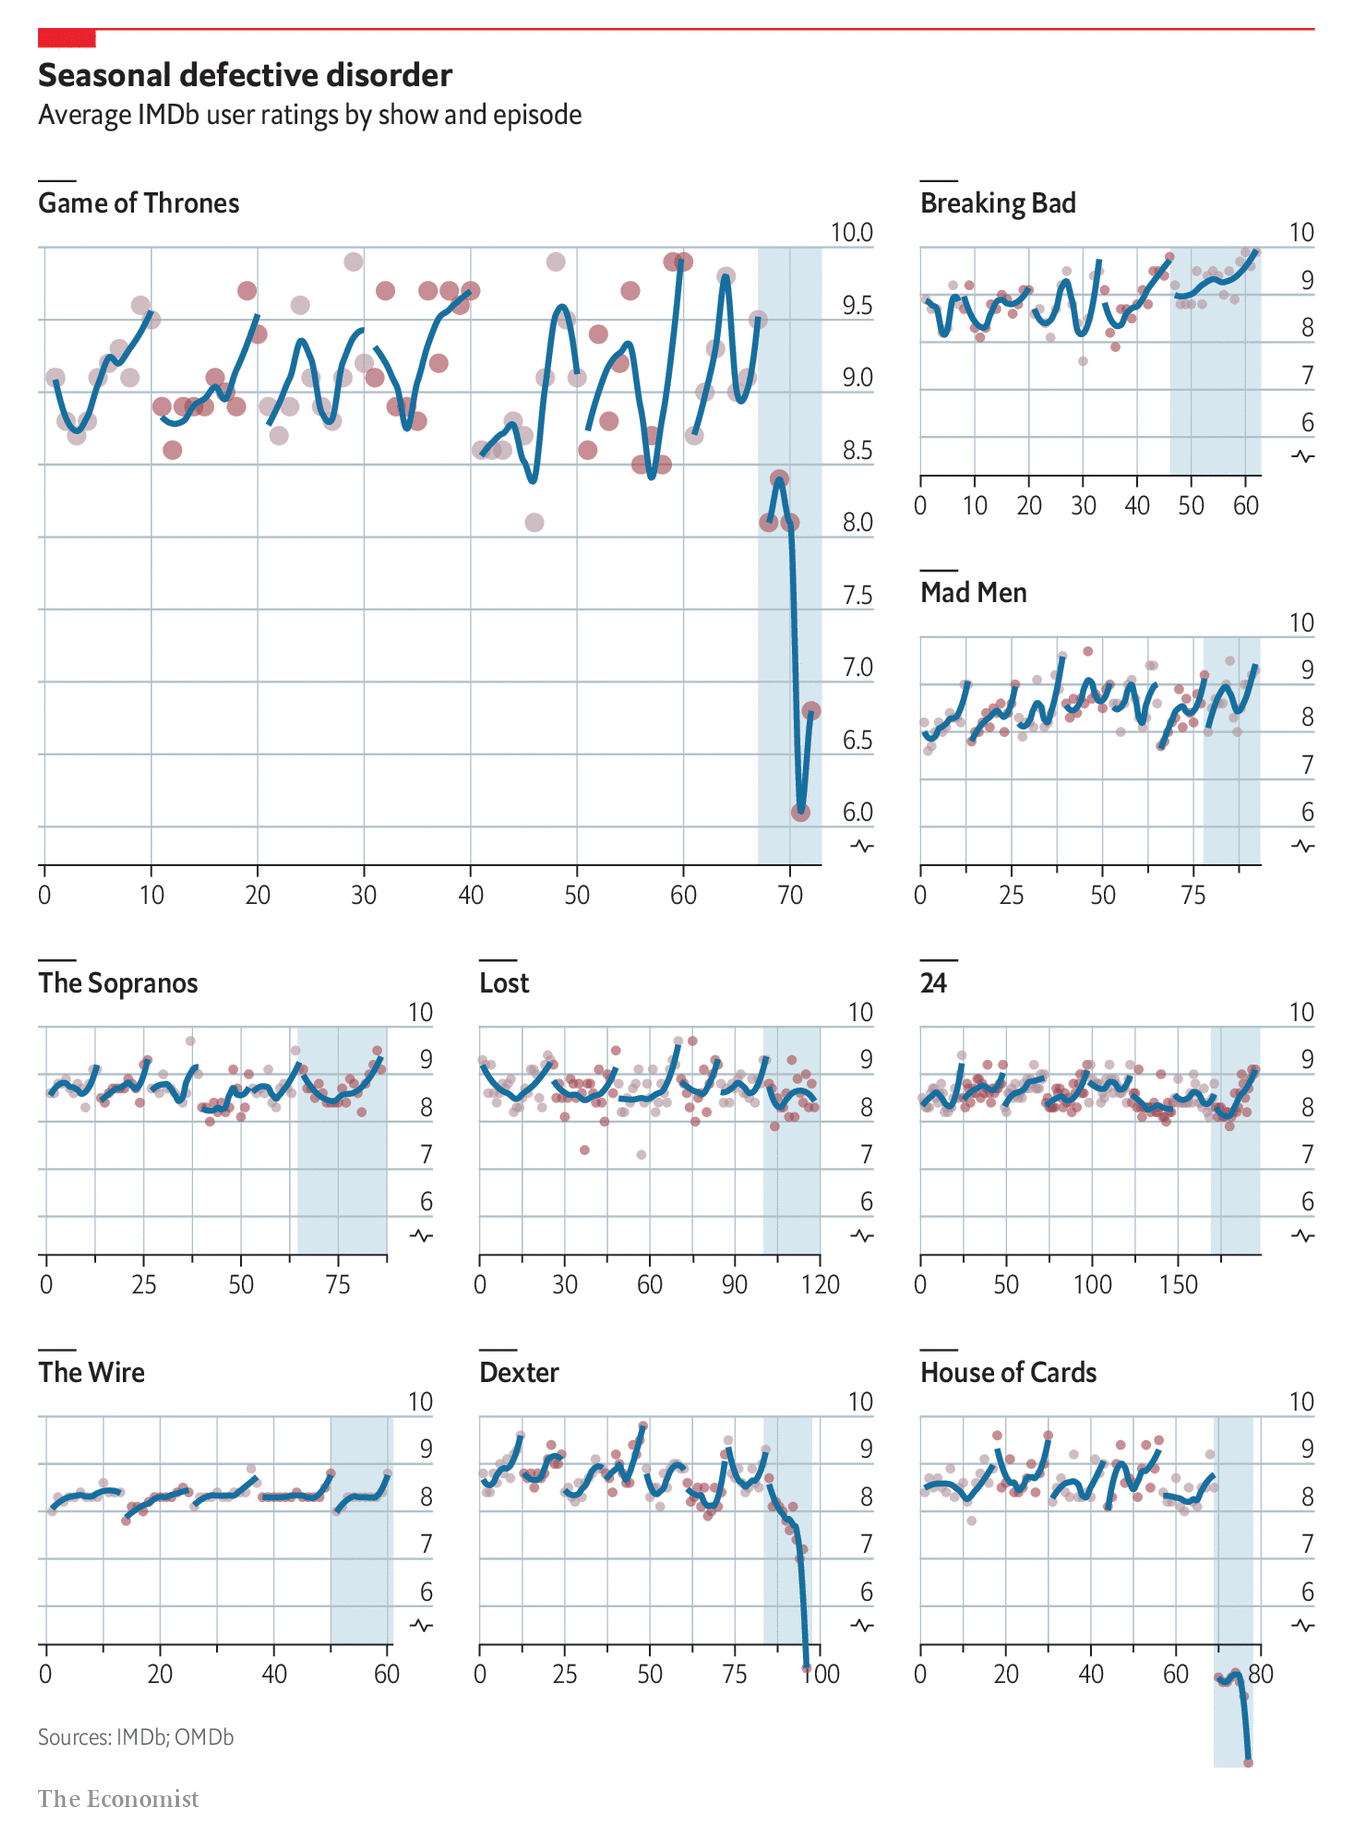
Turns out I was not the only one to look at plotting the ratings of the final series of Game of Thrones. The Economist looked at IMDB ratings, but just prior to the finale on Sunday. They, however, took it a step further and compared Game of Thrones to the final series of other well regarded shows.

All good things…
All good things…

From a design standpoint, I’m not a huge fan of breaking the y-axis at 6. While the data action is all happening at the high range of the scale, that is also the point. Each show is at the top of its class, which makes the precipitous falls of Game of Thrones, Dexter, and House of Cards all the more…wait for it…stark.

I do like the shading behind the line to indicate the final series. That certainly makes it easier to differentiate between the final episodes and those that came before.

But again, I’ll just say, I like how Game of Thrones ended.

Credit for the piece goes to the Economist graphics department.

Game of Thrones Ratings

No spoilers here, so don’t worry.

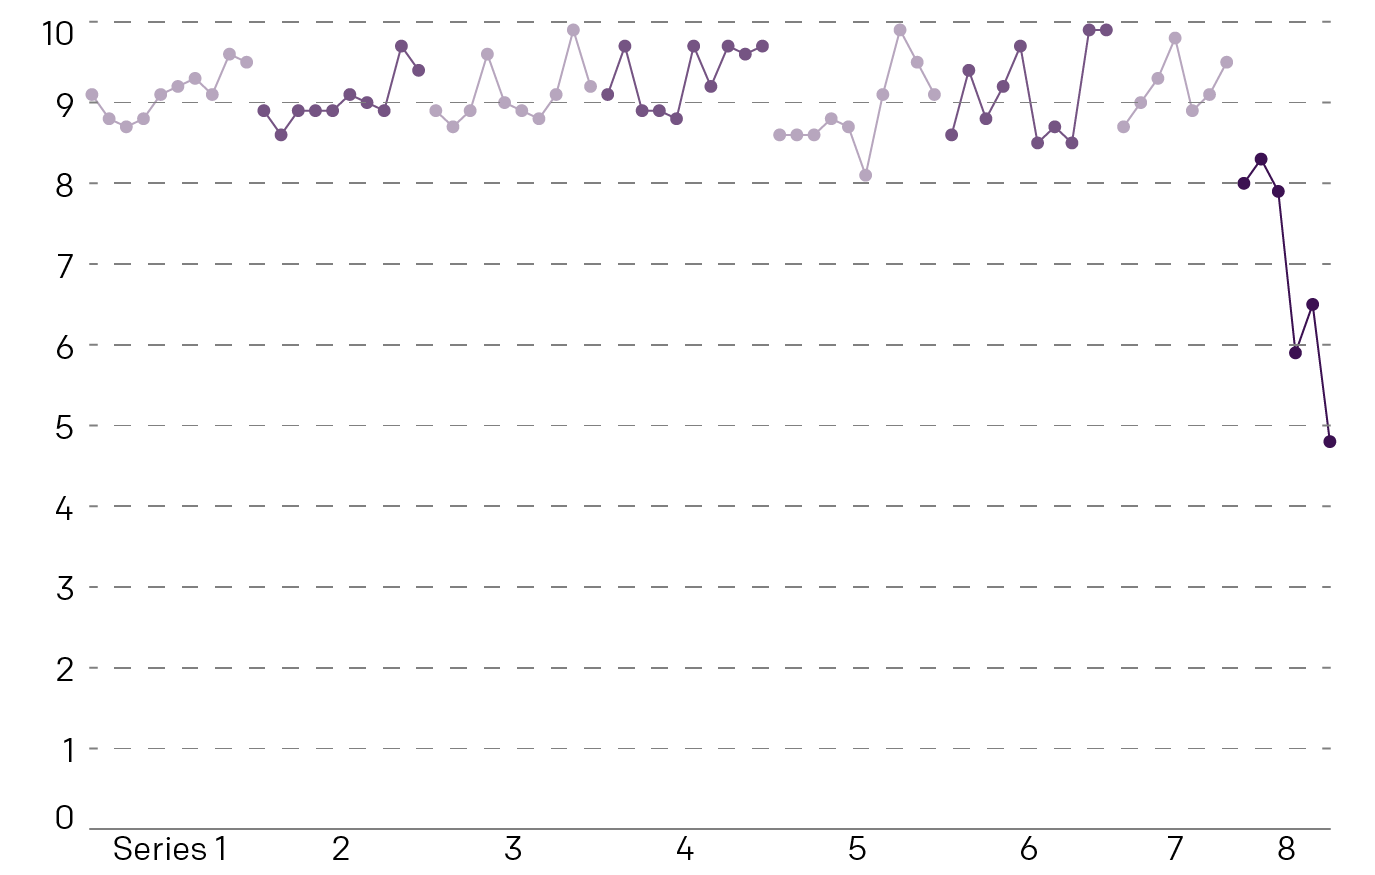
But Game of Thrones ended last night. And I might be in the minority in that I like the overall ending and direction of the plot. But, I will agree that it would have been better…executed (just a Ned Stark reference) if at least the final two series were full, 10-episode series. As it is, we’re left to ourselves to connect the dots between previous character actions and their current actions. It makes sense, but you have to really think about it. It could have been done better over time. Alas, time was the one thing they did not have.

Anyway, a lot of people think the final series was terrible. And the ratings on IMDB say just that.

Ratings dropping faster than a dragon falling out of the sky…

Credit for the piece is mine.

Who Bettors Think Will Sit Upon the Iron Throne

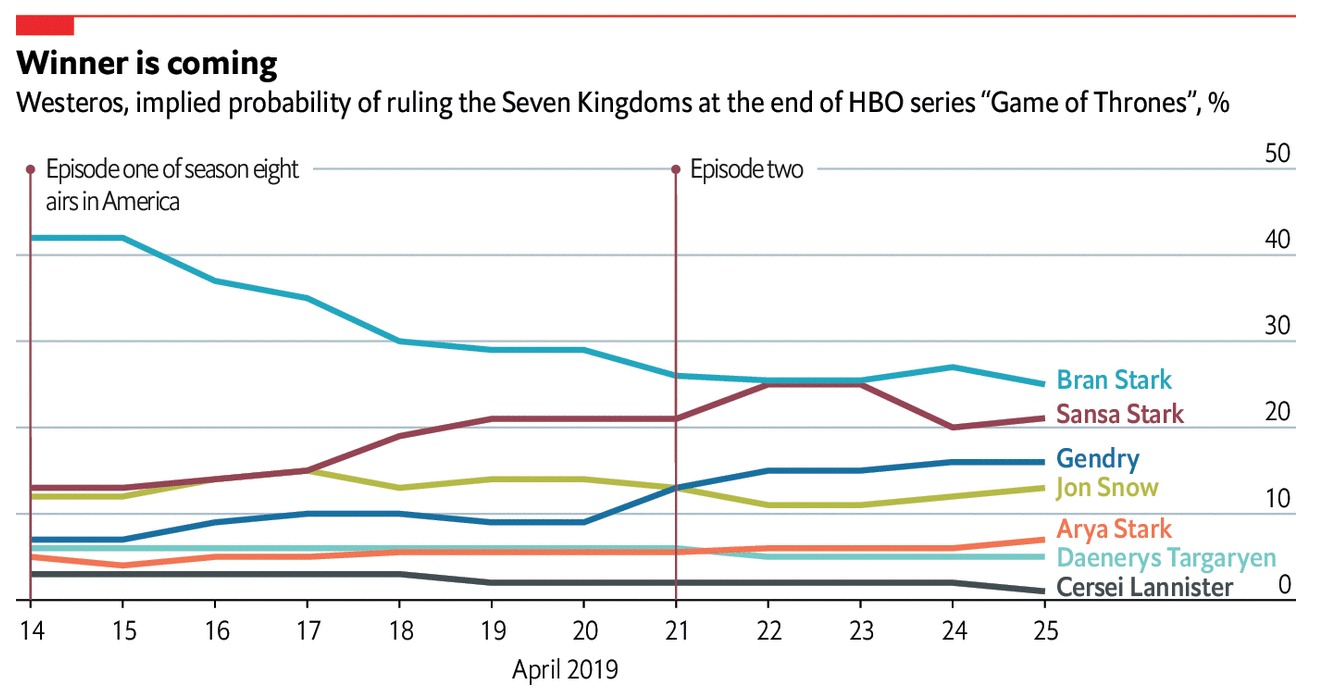
Last night was the third episode of the final series of Game of Thrones and thus marked its midway point. I shall save you from any spoilers, but I thought we could do a lighter post to start the week. This comes from the Economist and simply plots the characters and their implied probability of winning the Iron Throne.

What about Young Griff?

For me, there are too many lines, too many colours and we get the usual spaghettification. But, c’mon, it’s a chart about Game of Thrones. That said, some small multiple grid of characters, sorted by probability would be pretty neat.

Credit for the piece goes to the Economist’s graphics department.

Similar Airspeed Patterns

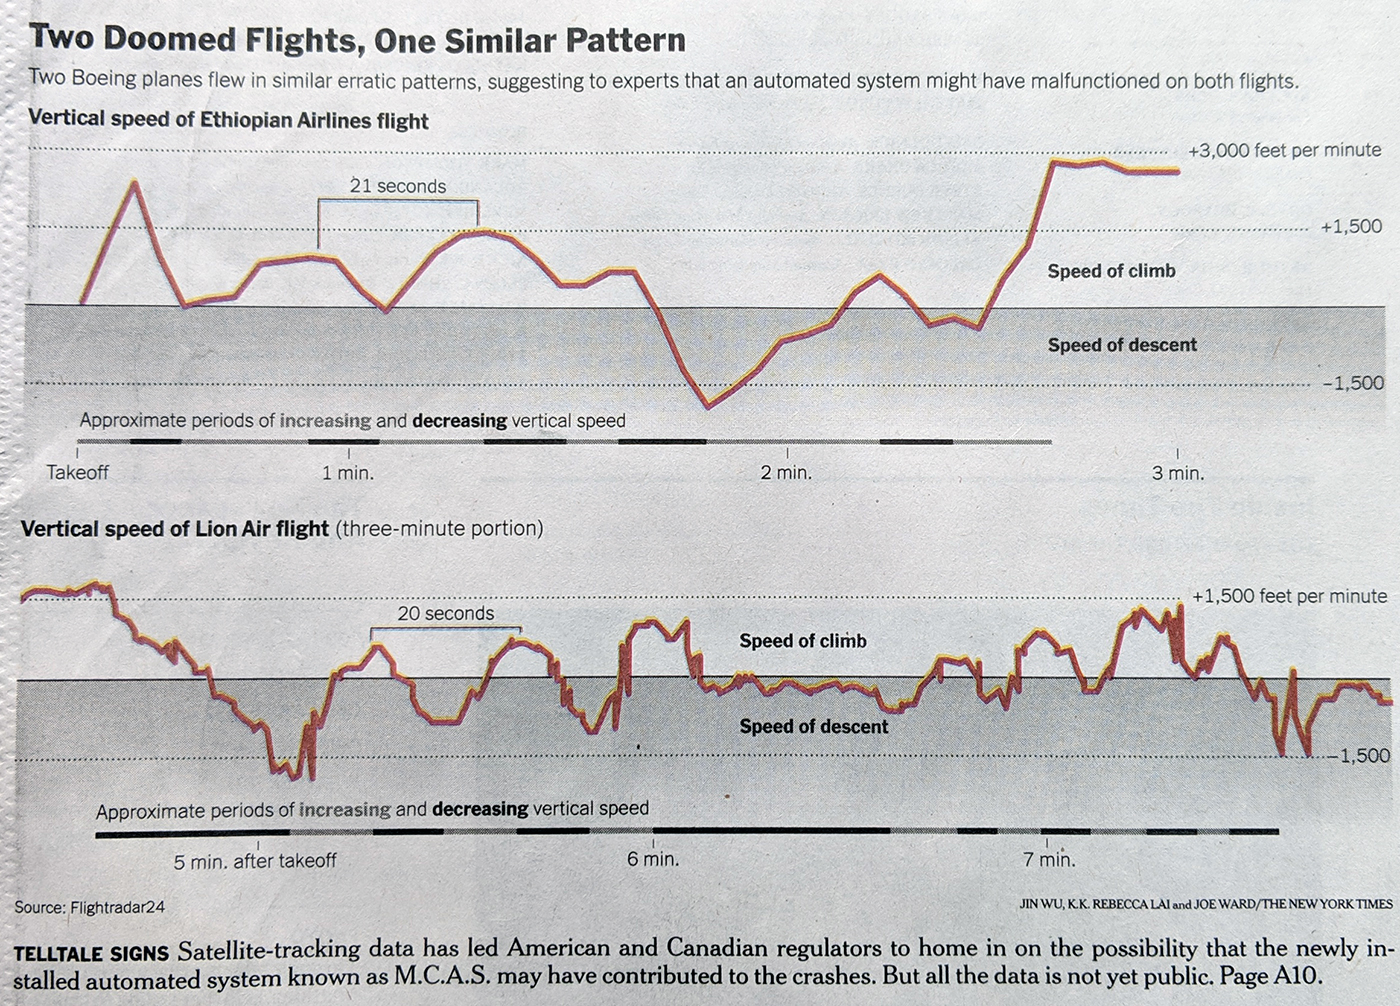
Yesterday we looked at the isolation of the US and Canada in keeping the Boeing 737 Max aircraft in the air. Later that day, both countries grounded those aircraft. Today in the print edition of the New York Times the front page used significant space to chart the vertical speed of the two crashed aircraft.

They are remarkably similar…

It uses the same scale on the y-axis and clearly shows how the aircraft gaining and losing vertical speeds. I am not sure what is gained by the shading below the 0 baseline. I do really enjoy the method of using a chart below the airspeeds to show the periods of increasing and decreasing vertical speed.

Credit for the piece Jin Wu, K.K. Rebecca Lai, and Joe Ward.

Is Bryce Harper Another Ryan Howard?

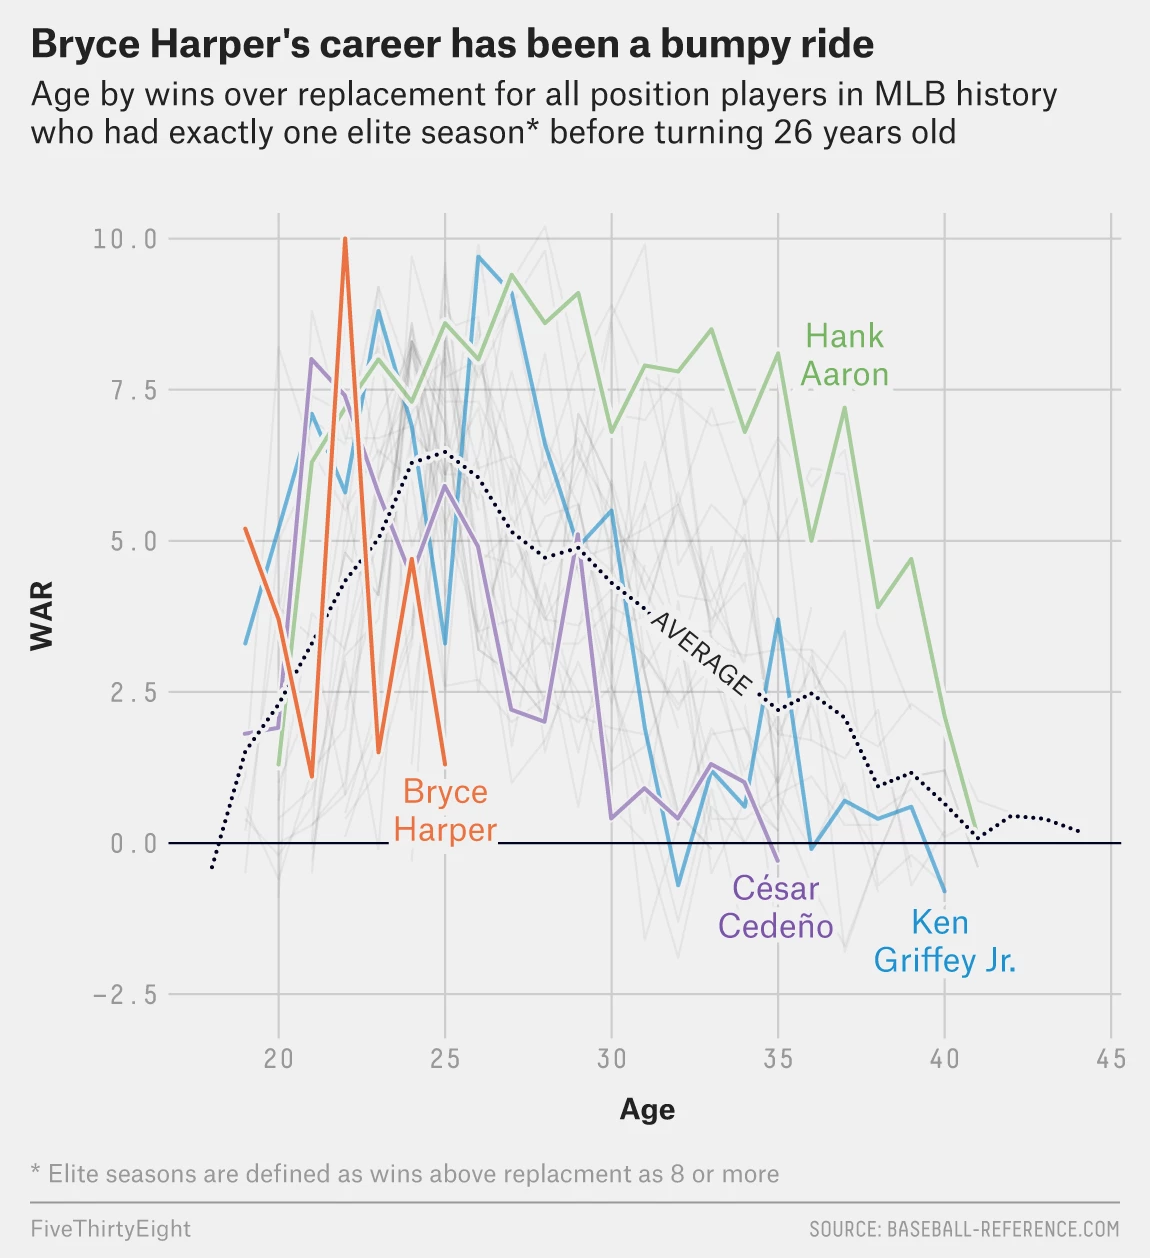
No. Definitely not. But, the position of this article by FiveThirtyEight is that the Phillies, the Philadelphia baseball team that just made the largest guaranteed contract in North American sports, may have purchased the rights to somebody who is a few years past his prime.

The author tracked the performance of similar baseball players over history and found that they peaked earlier and tailed off earlier.

Ken Griffey Jr.'s swing though…
Ken Griffey Jr.’s swing though…

Now, the obvious thing about this graphic that I dislike is the spaghetti-fication of the lines. What does help alleviate it, however, are the greying and lighter weight of the non-identified lines in the background. Interestingly, they are even lighter than the axes’ value lines. There is also a thin outline to the lines that helps them standout against each other.

I also wonder if a few more added benchmark lines would be useful. Elite seasons are defined as those with 8+ wins above replacement (WAR), an advanced measurement statistic. Could that level not be indicated with a line on the y-axis? What about the age of 26, before which the players would have had to produce one and only one 8+ WAR season to be eligible for the data set?

Of course, as I said at the beginning, the answer to this post’s title is no. Harper will make the Phillies a better team and the length of his contract will not be the albatross that was Ryan Howard’s. However, the Phillies may be paying for 13 years of subprime Harper.

Credit for the piece goes to the FiveThirtyEight graphics department.