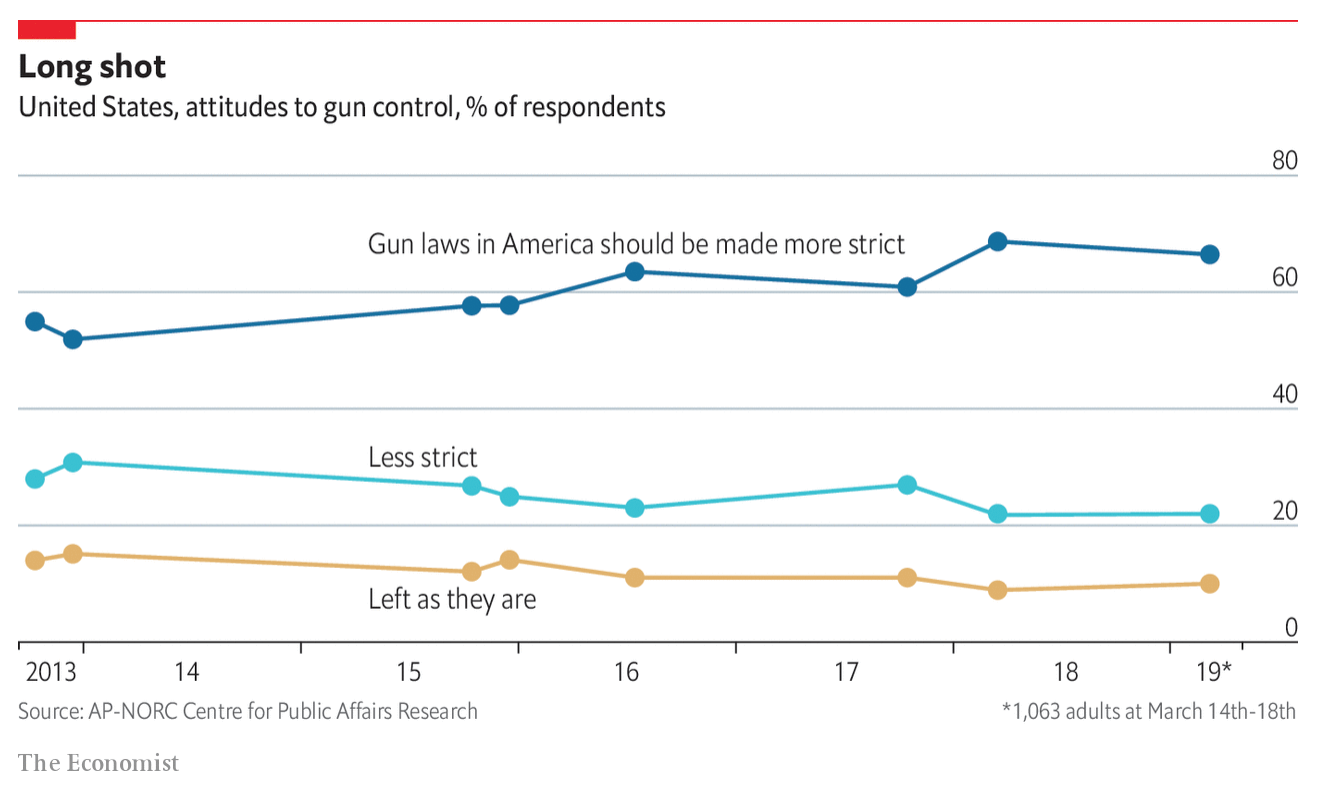
Today’s piece is nothing more than a line chart. But in the aftermath of this past weekend’s gun violence—and the inability of this country to enact gun control legislation to try and reduce instances like them—the Economist published a piece looking at public polling on gun control legislation. Perhaps surprisingly, the data shows people are broadly in favour of more restrictive gun laws, including the outlawing of military-style, semi-automatic weapons.

In this graphic, we have a line chart. However the import parts to note are the dots, which is when the survey was conducted. The lines, in this sense, can be seen as a bit misleading. For example, consider that from late 2013 through late 2015 the AP–NORC Centre conducted no surveys. It is entirely possible that support for stricter laws fell, or spiked, but then fell back to the near 60% register it held in 2015.
On the other hand, given the gaps in the dataset, lines would be useful to guide the reader across the graphic. So I can see the need for some visual aid.
Regardless, support for stricter gun laws is higher than your author believed it to be.
Credit for the piece goes to the Economist graphics department.
