
Last weekend I enjoyed several days off for Memorial Day. But that Sunday I enjoyed a nice, full-spread graphic in the New York Times. The clue that I was in for a treat was on the front page, beneath the fold, with a small map with some green, magenta, and orange.
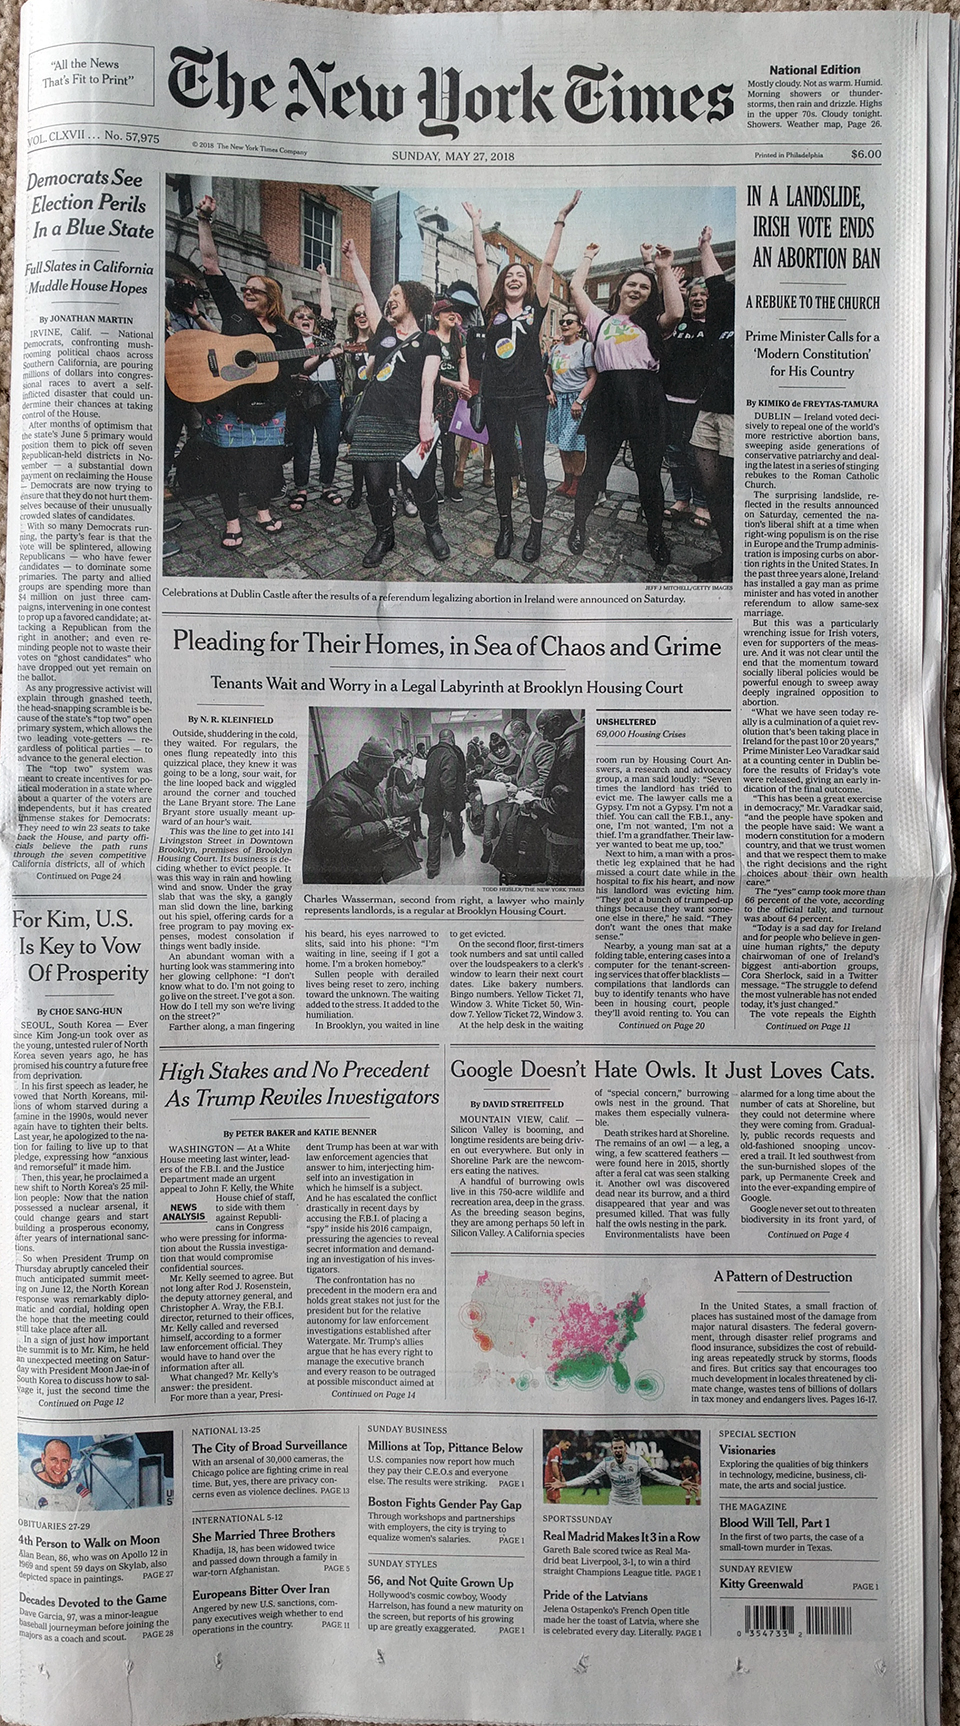
When I looked more closely I could see that the piece was about the location of disasters. But the actual graphic itself served more as an advertisement than informative graphic. The closeup here shows only that there is a lot of green in the American southeast. But nowhere do we get a sense of what it means other than probably some bad disasters.
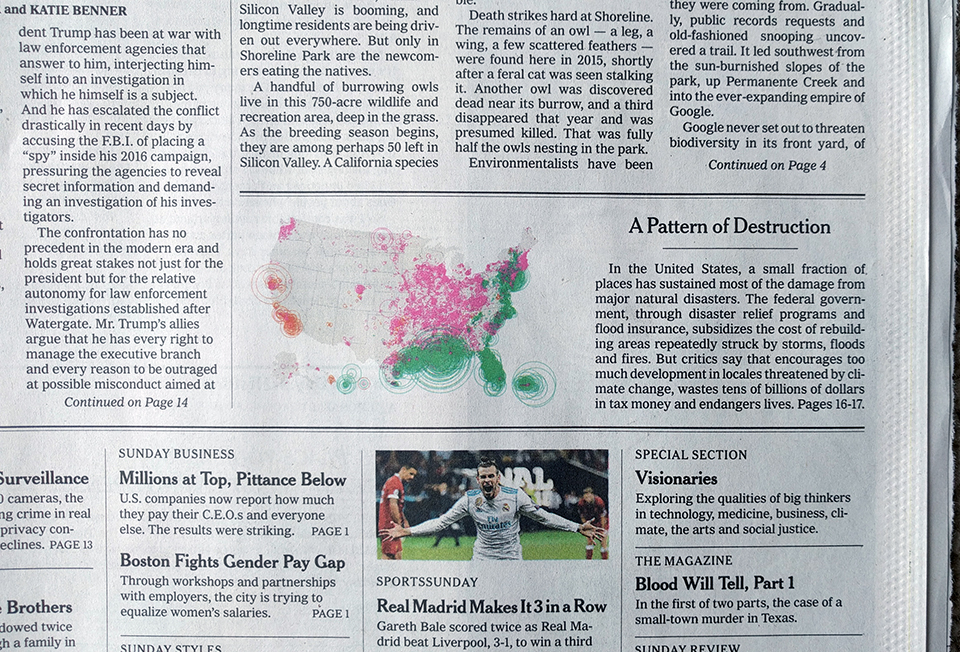
But that is the point of an advertisement—to get you to turn to the page, click on the banner, fork over your e-mail address. To be fair, I did not jump straight to the spread as I was going to read the entire section. But when I did finally get there, I got map overload.
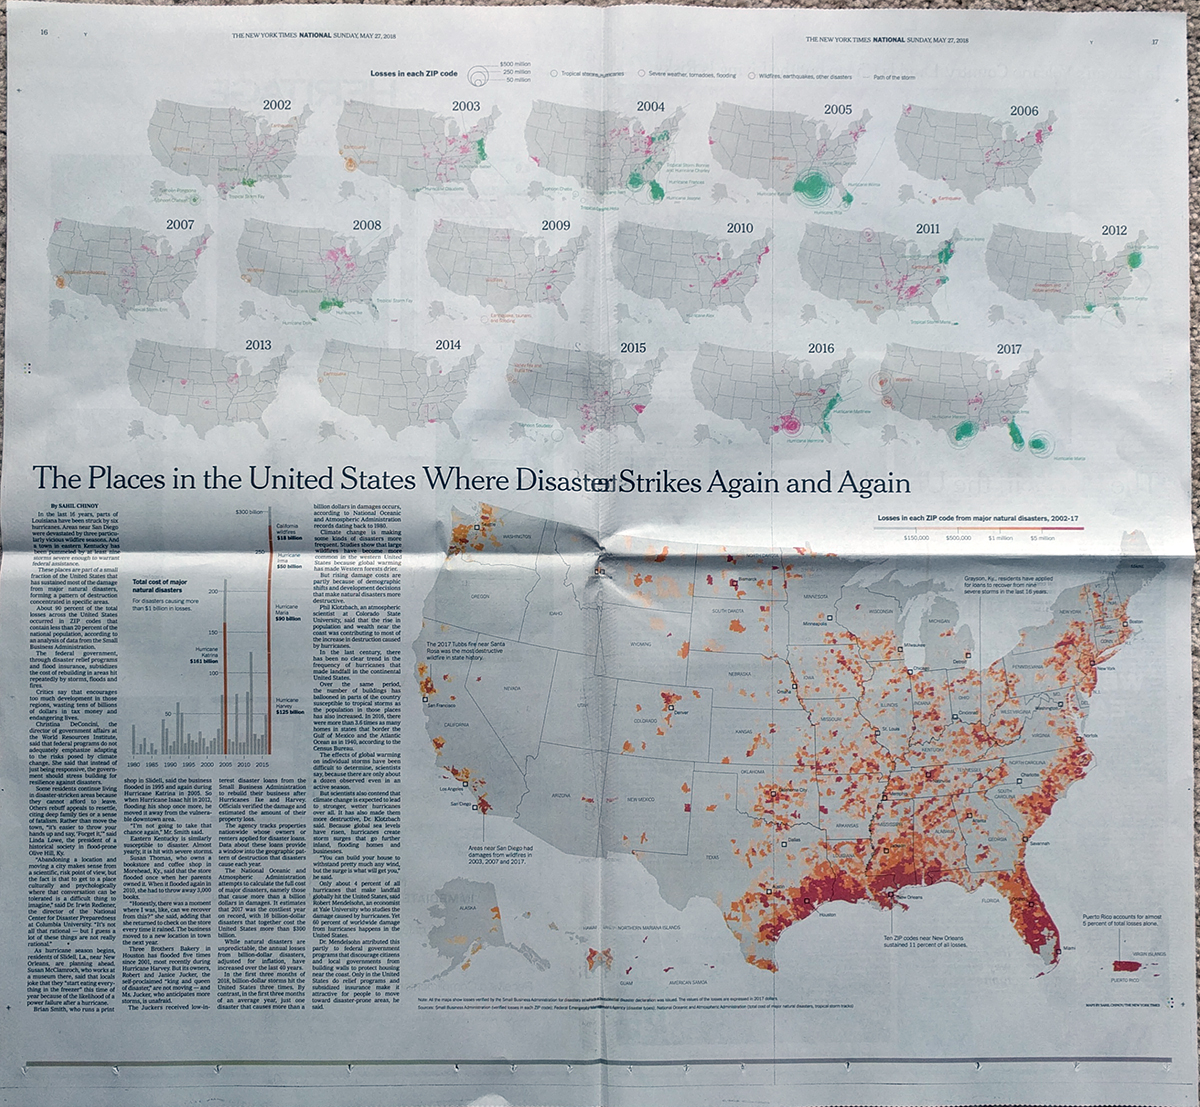
The piece uses small multiples across the top. One for each of the last 16 years. Clearly we get the legend explaining what each circle means. But we also have the added context of storm tracks for the tropical systems. And with those in particular, it is fascinating to see how unpredictable tropical systems can be in terms of their impact on America’s coastal regions.
Along with the text of the article, we also get a bar chart exploring the actual dollar value of the largest disasters, major disasters being defined as those over $1 billion in damages. I was a bit surprised to see that Harvey lower than Katrina, as I heard a lot about Harvey surpassing Katrina, but maybe the full data is not in yet? Or maybe it needs to account for the changing value of the dollar?
Regardless, the big thing is the map, as in the big map. Conceptually we get nothing terribly complex, just a choropleth for US postal codes. But keep in mind that more often than not, we want simpler forms because they work the best at showing clearly and concisely what the data is trying to tell us.
The only thing I could not figure out is why some cities were labelled and not others. After all, the map did stretch across 2/3 of the spread. There was clearly enough room to label Philadelphia. Maybe it is just because there looks to be comparatively few losses reported in its postal codes.
But lastly, I absolutely loved the inclusion of Puerto Rico here. No, it is not technically a US state. But it would be the 30th largest if it were. And given that at least 1,000 people died from Hurricane Maria, it is one of the deadliest hurricanes to have hit the United States. And the more attention that gets, the more likely it is Puerto Rico will get the federal assistance it needs.
Overall, this was just a great piece to sit and absorb over a cup of tea on a Sunday morning.
Credit for the piece goes to Sahil Chinoy.