Water, Water Everywhere Nor Any Drop to Drink

Most of Earth’s surface is covered by water. But, as any of you who have swallowed seawater can attest, it is not exactly drinkable. Instead, mankind evolved to drink freshwater. And as some new data suggests, that might not be as plentiful in the future because some areas are already under extreme stress. Yesterday the New York Times published an article looking at the findings.
More reasons for me not to move to the desert southwest

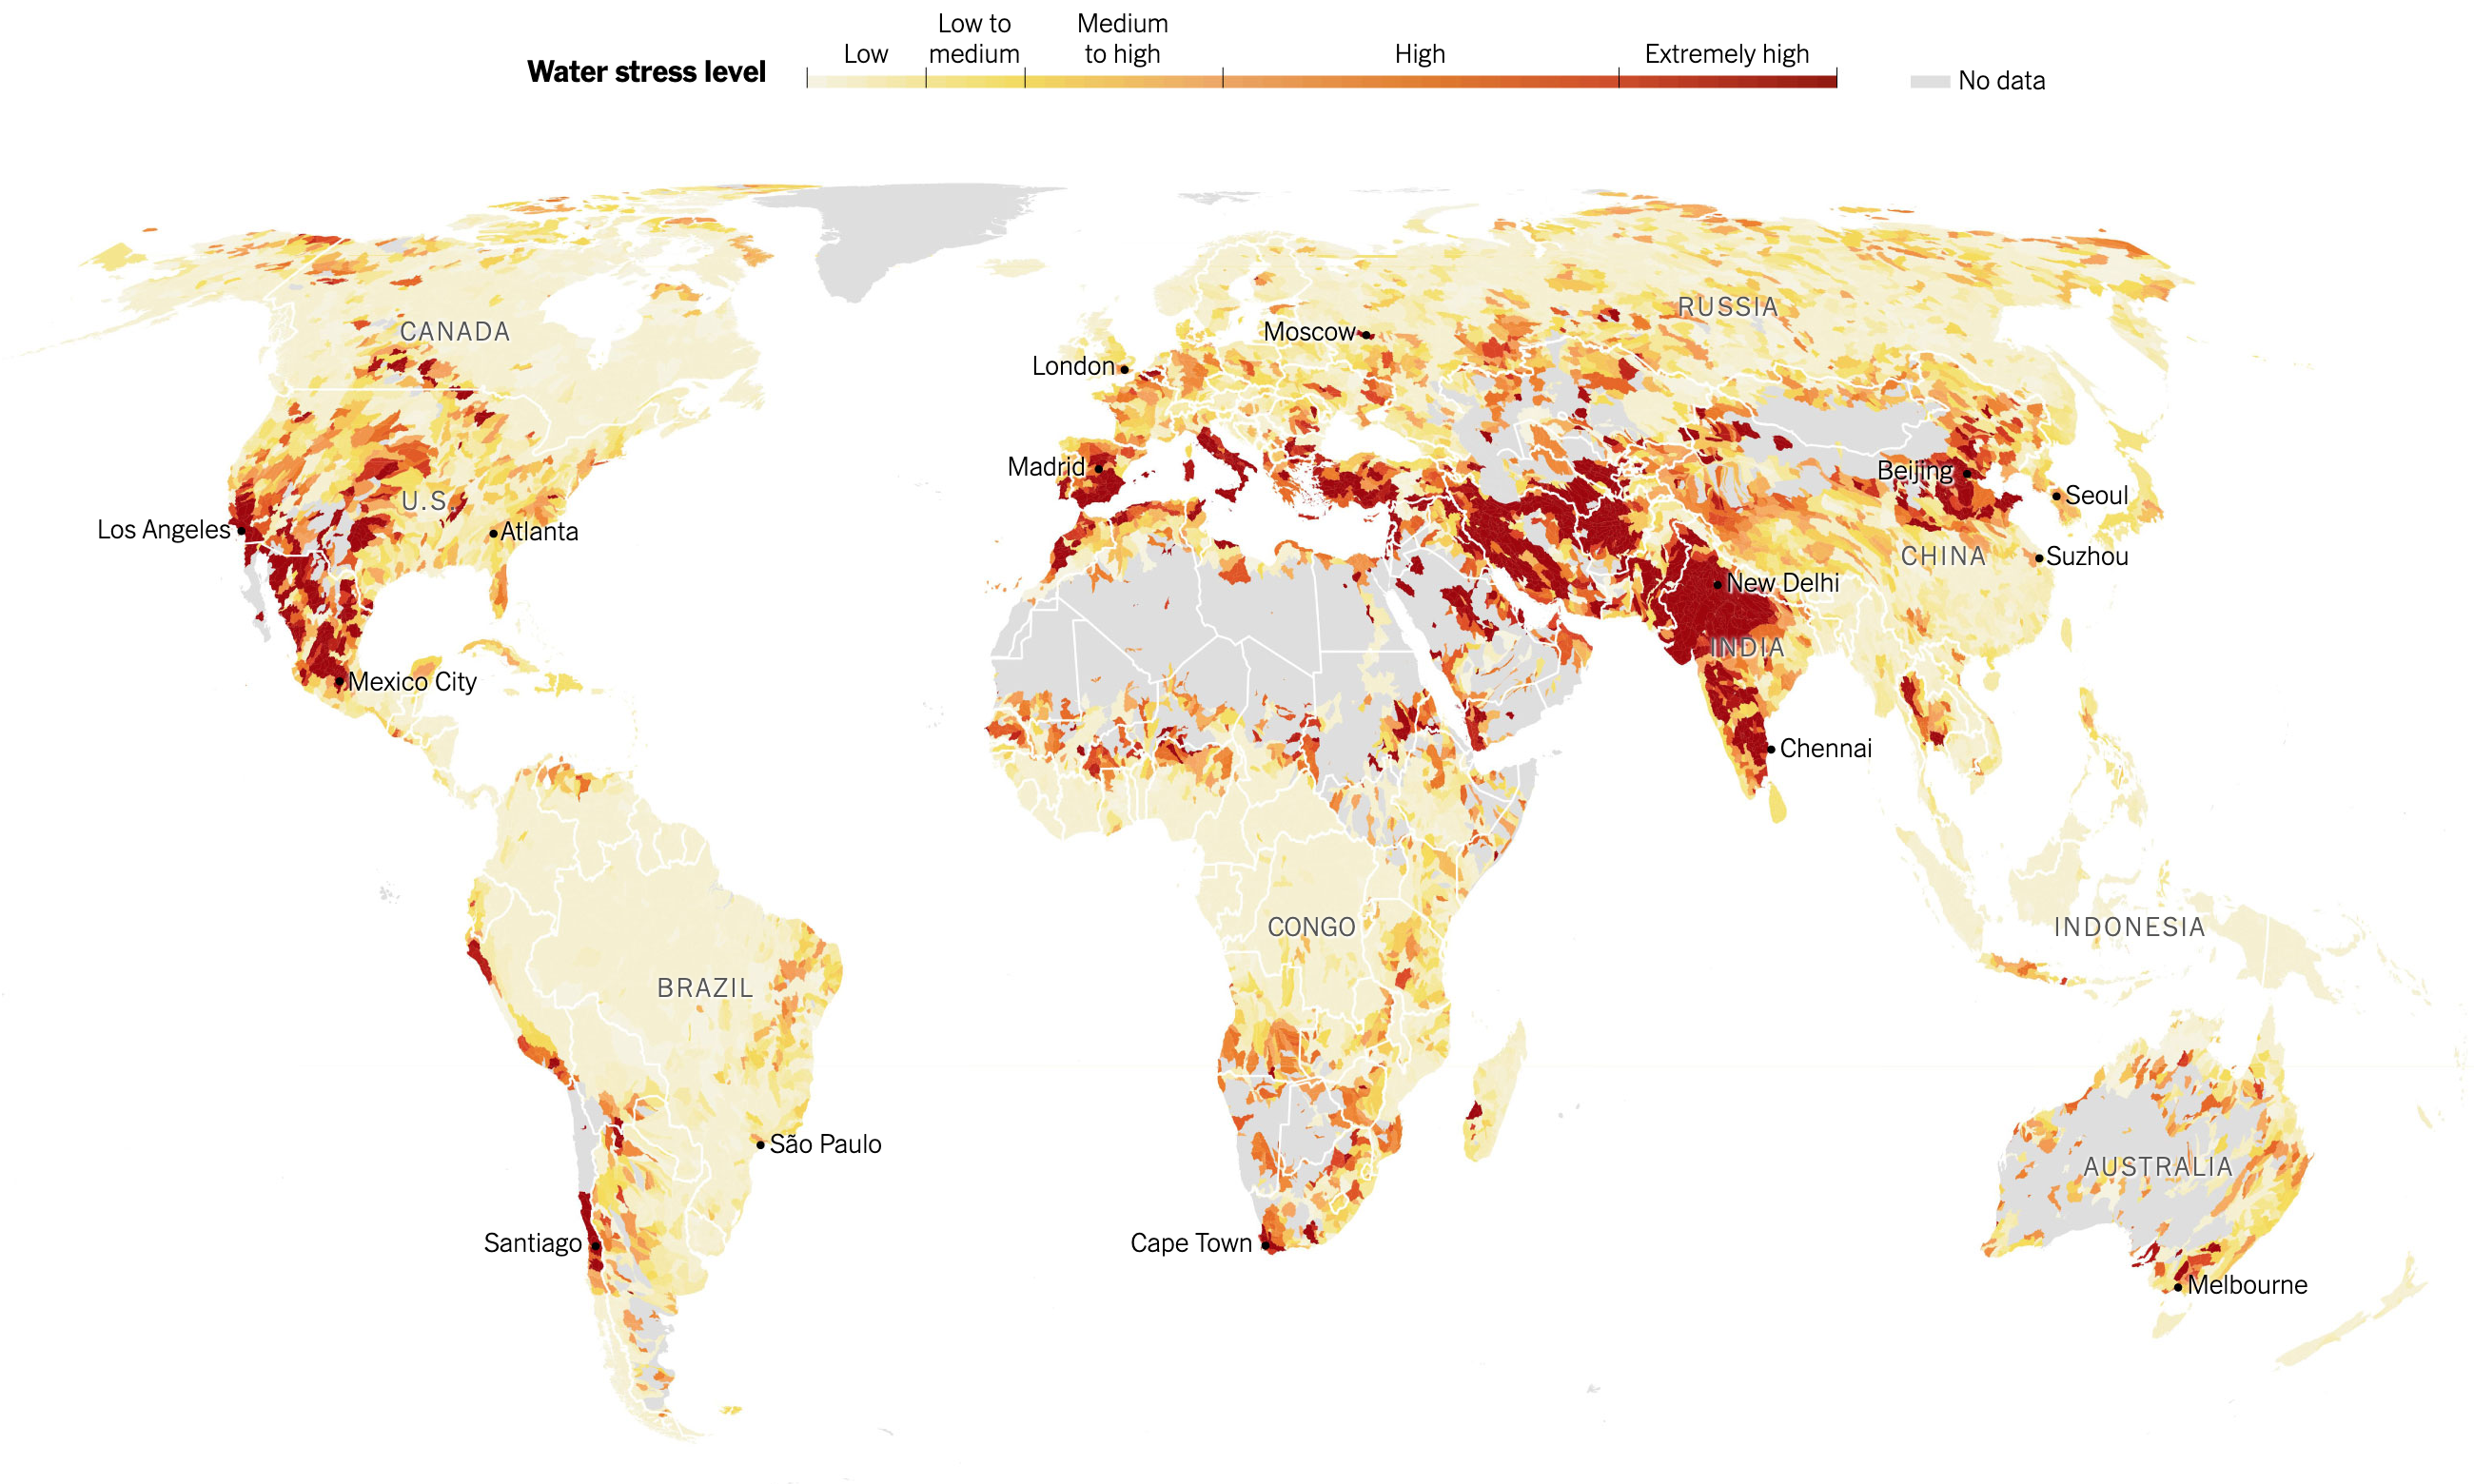
The piece leads with a large map showing the degree of water stress across the globe. It uses a fairly standard yellow to red spectrum, but note the division of the labels. The High range dwarfs that of the Low, but instead of continuing on, the Extremely High range then shrinks. Unfortunately, the article does not go into the methodology behind that decision and it makes me wonder why the difference in bin sizes.

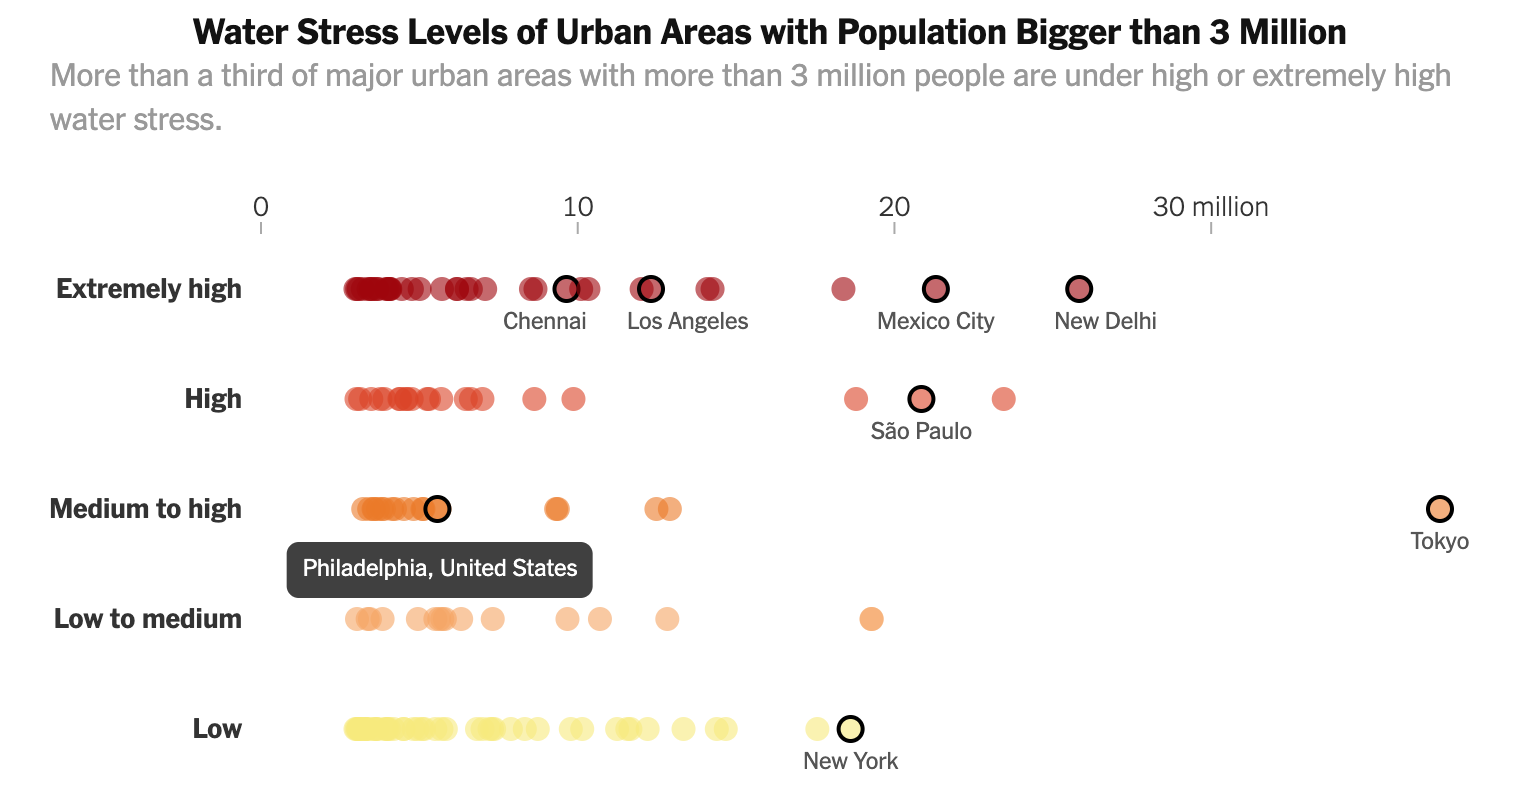
Of course, any big map makes one wonder about their own local condition. How stressed is Philadelphia, for example? Thankfully, the designers kept that in mind and created an interactive dot plot that marks where each large city falls according to the established bins.
Not so great, Philly

At this scale, it is difficult to find a particular city. I would have liked a quick text search ability to find Philadelphia. Instead, I had to open the source code and search the text there for Philadelphia. But more curiously, I am not certain the graphic shows what the subheading says.

To understand what a third of major urban areas is, we would need to know the total number of said cities. If we knew that, a small number adjacent to the categorisation could be used to create a quick sum. Or a separate graphic showing the breakdown strictly by number of cities could also work. Because seeing where each city falls is both interesting and valuable, especially given how the shown cities are mentioned in the text—it just doesn’t fit the subheading.

But, for those of you from Chicago, I included my former home as a different screenshot. Though I didn’t need to search the source code, because I just happened across it scrolling through the article.

It helps having Lake Michigan right there

Credit for the piece goes to Somini Sengupta and Weiyi Cai.

Quantifying Part of the Opioid Crisis

Two weeks ago the Washington Post published a fascinating article detailing the prescription painkiller market in the United States. The Drug Enforcement Administration made the database available to the public and the Post created graphics to explore the top-line data. But the Post then went further and provided a tool allowing users to explore the data for their own home counties.

The top line data visualisation is what you would expect: choropleth maps showing the prescription and death rates. This article is a great example of when maps tell stories. Here you can clearly see that the heaviest hit areas of the crisis were Appalachia. Though that is not to say other states were not ravaged by the crisis.

There are some clear geographic patterns to see here

For me, however, the true gem in this piece is the tool allowing you the user to find information on your county. Because the data is granular down to county-level information on things like pill shipments from manufacturer to distributor, we can see which pharmacies were receiving the most pills. And, crucially, which manufacturers were flooding the markets. For this screenshot I looked at Philadelphia, though I only moved here in 2016, well after the date range for this data set.

It could be worse
It could be worse

You can clearly see, however, the designers chose simple bar charts to show the top-five. I don’t know if the exact numbers are helpful next to the bars. Visually, it becomes a quick mess of greys, blacks, and burgundies. A quieter approach may have allowed the bars to really shine while leaving the numbers, seemingly down to the tens, for tables. I also cannot figure out why, typographically, the pharmacies are listed in all capitals.

But the because I lived in Chicago for most of the crisis, here is the screenshot for Cook County. Of course, for those not from Chicago, it should be pointed out that Chicago is only a portion of Cook County, there are other small towns there. And some of Chicago is within DuPage County. But, still, this is pretty close.

Better numbers than Philly

In an unrelated note, the bar charts here do a nice job of showing the market concentration or market power of particular companies. Compare the dominance of Walgreens as a distributor in Cook County compared to McKesson in Philadelphia. Though that same chart also shows how corporate structures can obscure information. I was never far from a big Walgreens sign in Chicago, but I have never seen a McKesson Corporation logo flying outside a pharmacy here in Philadelphia.

Lastly, the neat thing about this tool is that the user can opt to download an image of the top-five chart. I am not sure how useful that bit is. But as a designer, I do like having that functionality available. This is for Pennsylvania as a whole.

For Pennsylvania, state-wide

Credit for the piece goes to Armand Emamdjomeh, Kevin Schaul, Jake Crump and Chris Alcantara.

Baby, It’s Hot Outside

Those of you living on the East Coast, specifically the Mid-Atlantic, know that presently the weather is quite warm outside. As in levels of dangerous heat and humidity. Personally, your author has not left his flat in a few days now because it is so bad.

Alas, not everyone has access to air conditioning in his or her abode. Consequently, they need to look to public spaces with air conditioning. Usually that means libraries or public buildings. But here in Philadelphia, have people considered the subway?

Billy Penn investigated the temperatures in Philadelphia’s subsurface stations along the Broad Street and Market–Frankford Lines—Philadelphia’s third and oft-forgot line, the Patco, was untested. What they found is that temperatures in the stations were significantly below the temperatures above ground. The Market–Frankford stations, for example, were less than 100ºF.

Just explore the rails…

Of course that misses the 2nd Street station in Old City, but otherwise picks up all the Market–Frankford stations situated underground.

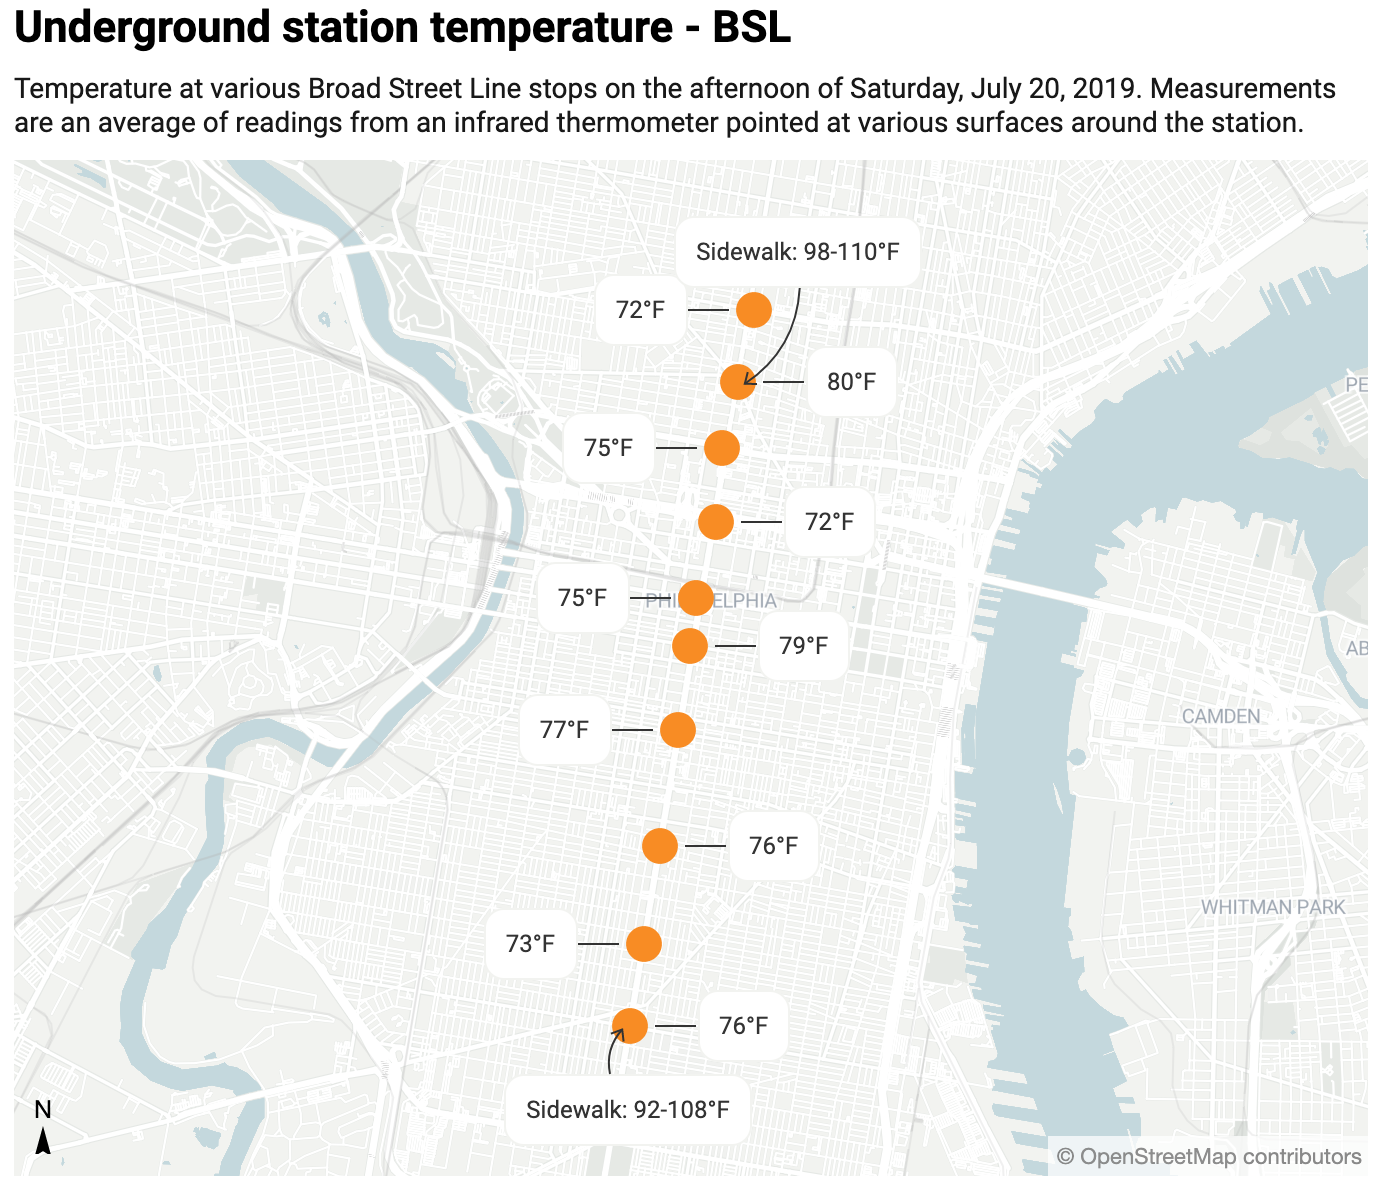
Then there is the Broad Street Line.

More rail riding…
More rail riding…

Here, I do have a question about why the line wasn’t investigated from north to south. It ran only as far north as Girard, stopping well short of north Philadelphia neighbourhoods, and then as far south as Snyder, missing both Oregon and Pattison (sorry, corporately branded AT&T) stations. The robustness of the dataset is a bit worrying.

The colours here too mean nothing. Instead blue is used for the blue-coloured Market–Frankford line and orange for the orange-coloured Broad Street line. (The Patco line would have been red.) Here was a missed opportunity to encode temperature data along the route.

Finally, if the sidewalk temperatures were measured at each station, I would want to see that data alongside and perhaps run some comparisons.

This is an interesting story, but some more exploration and visualisation of the data could have taken it to the next level.

Credit for the piece goes to Danya Henninger.

British English vs. Irish English

The United Kingdom is known for having a large number of accents in a—compared to the United States—relatively small space. But then you add in Ireland and you have an entirely new level of linguistic diversity. Josh Katz, who several years ago made waves for his work on the differences in the States, completed some work for the New York Times on those differences between the UK and Ireland.

You might know this as tag. At least I do.

Why do I bring it up? Well, your author is going on holiday again, this time back to London. I will be maybe taking some day trips to places outside the capital and maybe I will confirm some of these findings. But if you want, you can take the quiz and see where you fall compared to Katz’s findings.

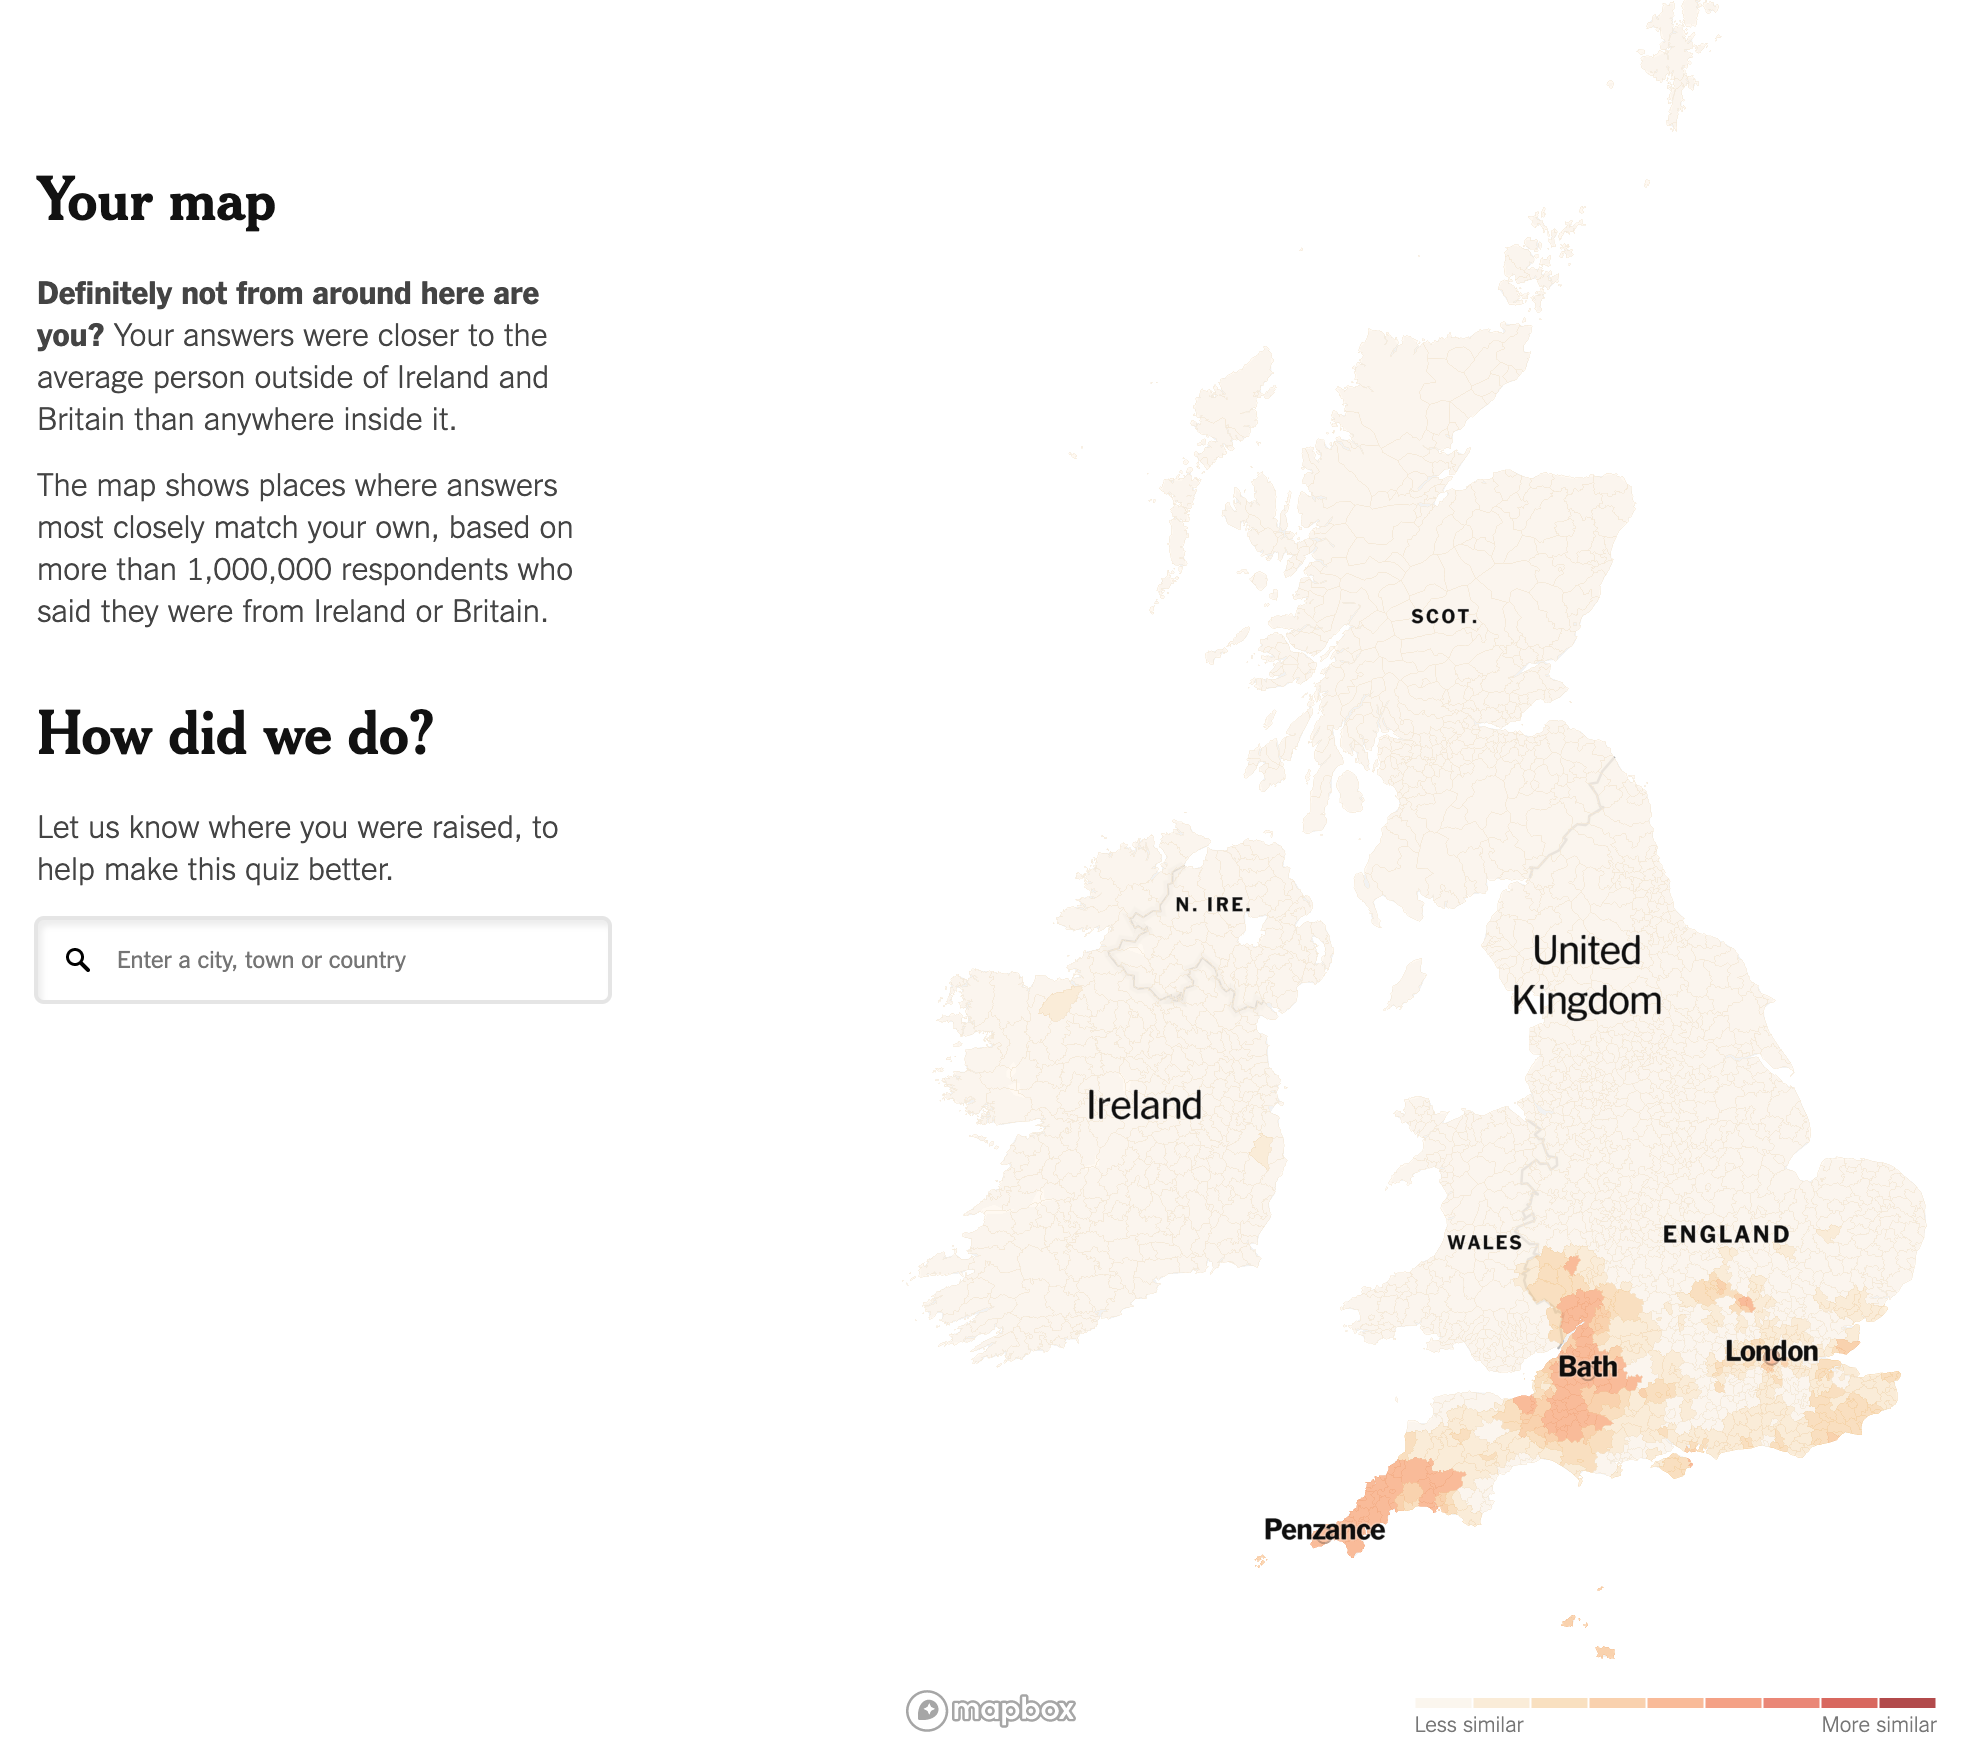
And it does pretty well. It identified me as being clearly not from the British Isles.

Maybe I'm secretly Cornish?
Maybe I’m secretly Cornish?

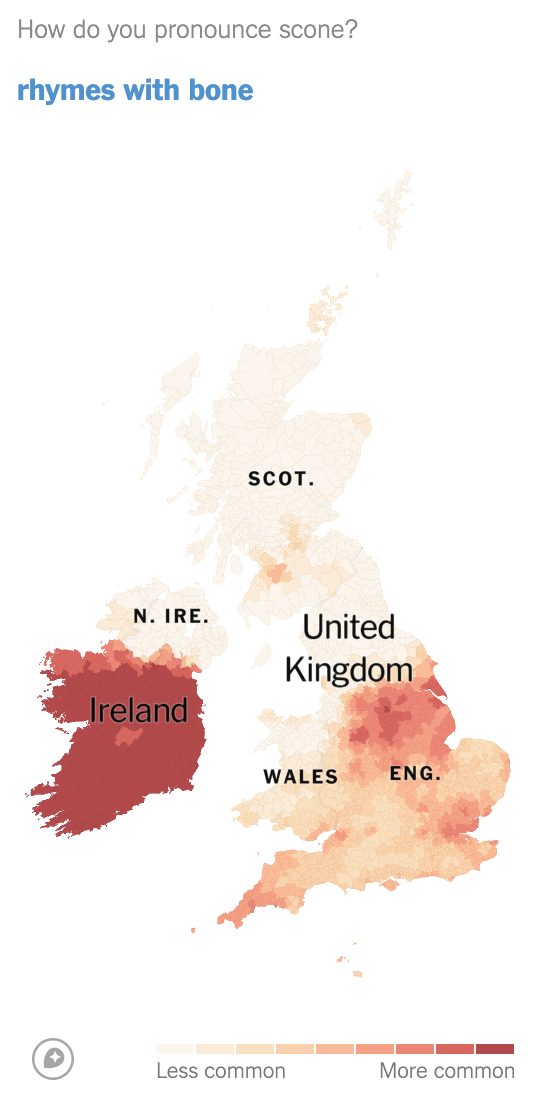
But depending upon how you answer a particular question, the article will show you how your answer compares.  Let’s take my answer for scone. In that, I am more Irish.

Or you can just call them fantastic and delicious.

Credit for the piece goes to Josh Katz.

The Great Migration Map

Yesterday in a post about Angela’s forced journey from Africa to Jamestown I mentioned that the Pilgrims arrived at Plymouth Bay just one year later in 1620. From 1620 until 1640 approximately 20,000 people left England and other centres like Leiden in the Netherlands for New England. Unlike places like Jamestown that were founded primarily for economic reasons, New England was settled for religious reasons. Consequently, whereas colonies in Virginia drew young men looking to make it rich—along with slaves to help them—New England saw entire families moving and transplanting parts of towns and England into Massachusetts, Rhode Island, Connecticut, and New Hampshire.

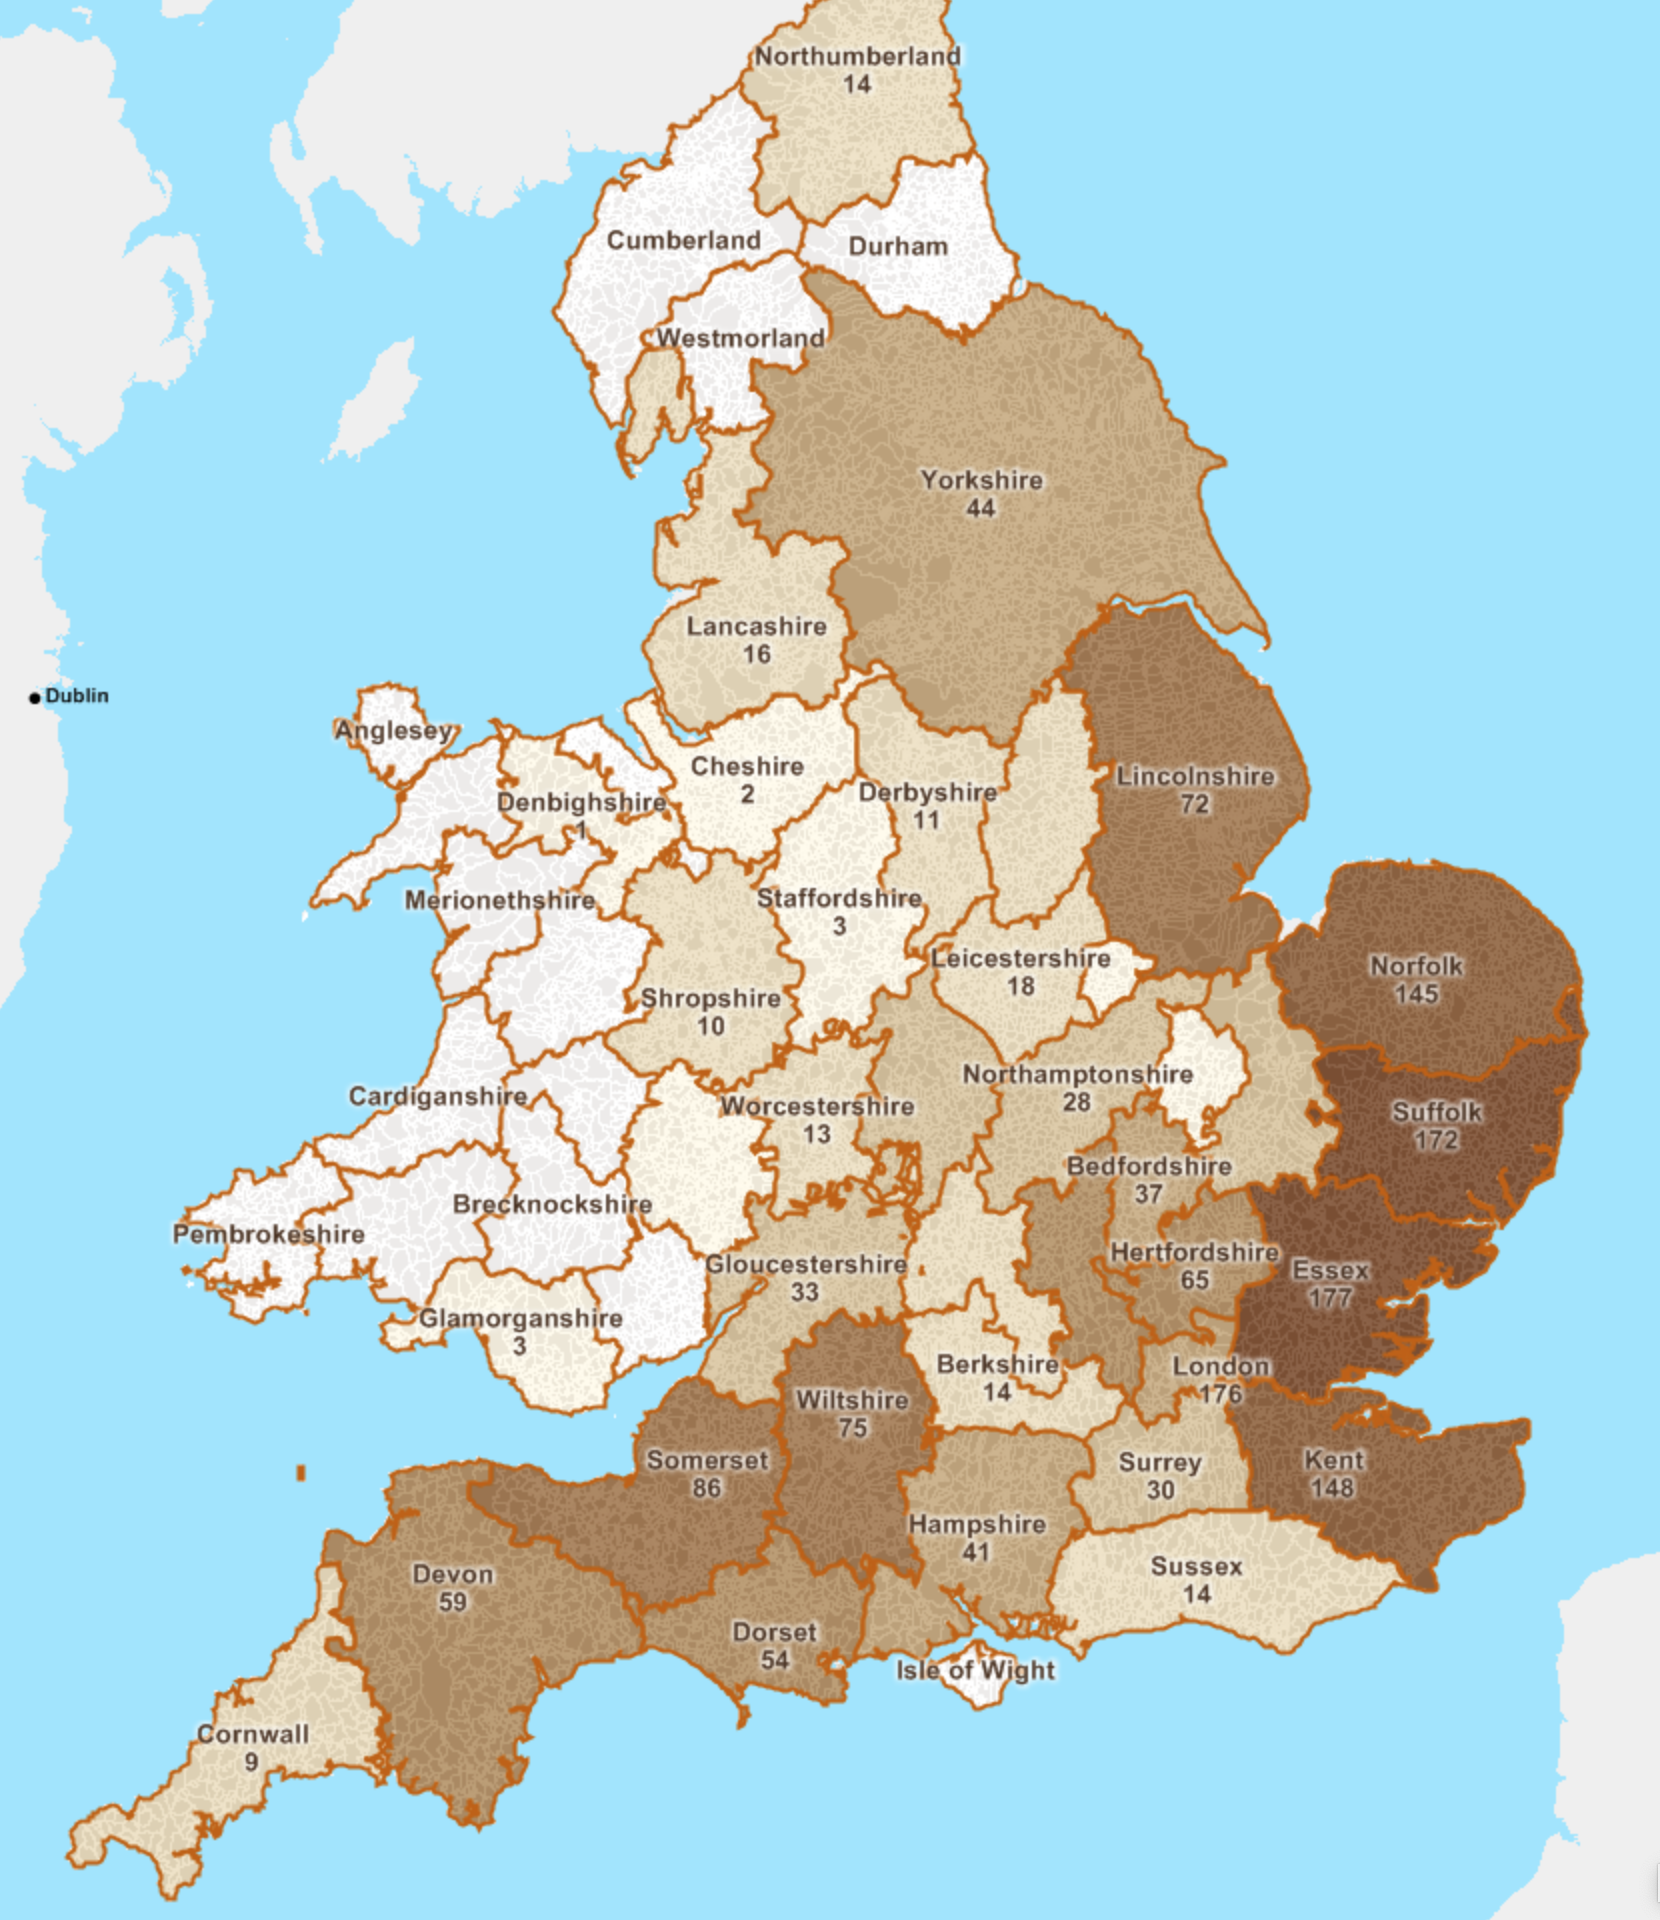
New England kept fantastic records and we know thousands of people. But we do not know whence everyone arrived, but we do know a few thousand. And this mapping project from American Ancestors attempts to capture that information at the English parish level. At its broadest level it is a county-level choropleth that shows, for those for whom we have the information, the majority of the migration, called the Great Migration, came from eastern England, with a few from the southwest.

Quite a few from Norfolk, Suffolk, and Essex

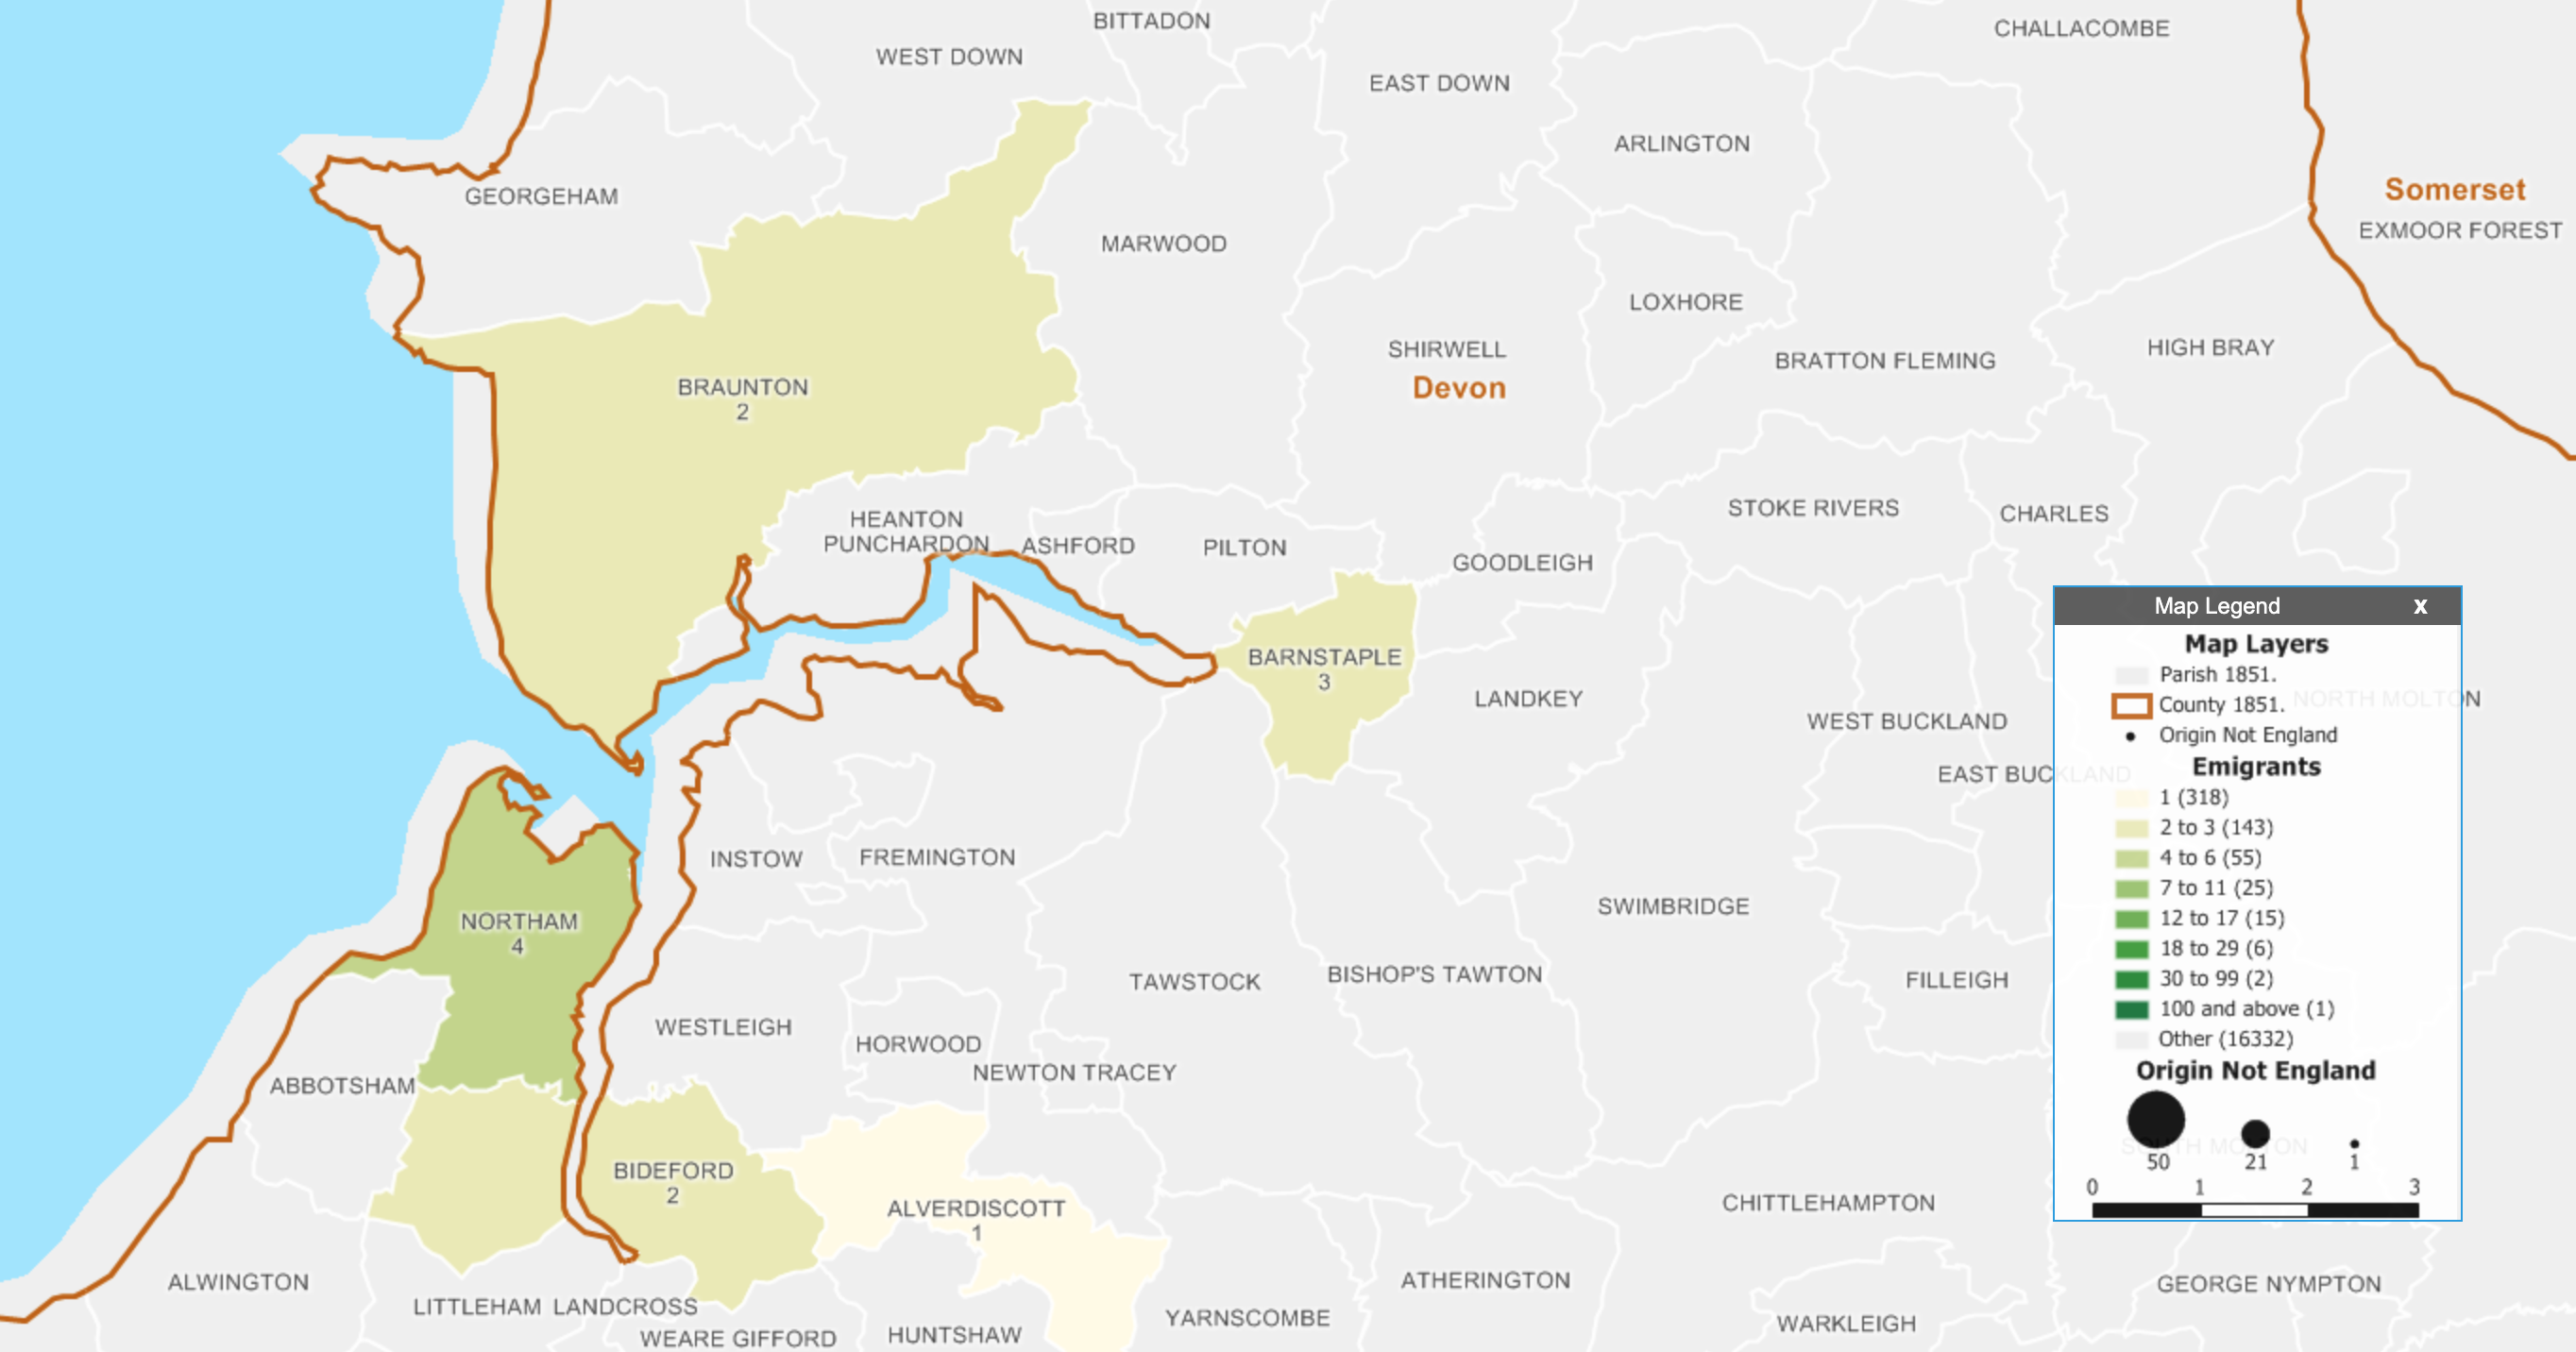
You can also search for specific people, in which case it brings into focus the county and the parishes within that have more detail. In this case I searched for my ancestor Matthew Allyn, who was one of the founders of Hartford, Connecticut. He came from Braunton in Devon and consequently appears as one of the two people connected to that parish.

Devon did not have nearly as many people emigrate as the eastern counties
But was Thomas related to Matthew? We don't know.
But was Thomas related to Matthew? We don’t know.

Overall, it’s a nice way of combining data visualisation and my interest/hobby of genealogy. The map uses the historical boundaries of parishes prior to 1851, which is important given how boundaries are likely to change over the centuries.

This will be a nice tool for those interested in genealogy and that have ancestors that can be traced back to England. I might be biased, but I really like it.

Credit for the piece goes to Robert Charles Anderson, Giovanni Flammia, Peter H. Van Demark.

An Illustrated Guide to the Deaths in Game of Thrones

Did something important happen yesterday in the news? We’ll get to it. But for now, it’s Friday. You’ve made it to the weekend. So sit back and binge. On gin or Game of Thrones, whatever.

Last Sunday the hit HBO show Game of Thrones returned for its final series. I did not have time to post about this piece then, but thankfully, not much has changed.

It details all the on-screen deaths in the show. (Spoiler: a lot.) It includes the series in which they died, the manner of their death, who killed them, and some other notable information. Remarkably, it is not limited to the big characters, e.g. Ned Stark. (If that is a spoiler to you, sorry, not sorry.) The piece captures the deaths of secondary and tertiary characters along with background extras. The research into this piece is impressive.

Don’t worry, if you haven’t seen the show, this spoils only some extras and I guess the locations the show has, well, shown.

Don't go beyond the Wall
Don’t go beyond the Wall

Thankfully, by my not so rigourous counting, last week added only four to the totals on the page (to be updated midway and after the finale).

In terms of data visualisation, it’s pretty straightforward. Each major and minor character has an illustration to accompany them—impressive in its own right. And then extras, e.g. soldiers, are counted as an illustration and circles to represent multiples.

For me, the impressive part is the research. There is something like over 60 hours of footage. And you have to stop whenever there is a battle or a a feast gone awry and count all the deaths, their manners, identify the characters, &c.

Credit for the piece goes to Shelley Tan.

The Fire at Notre Dame Cathedral: Part Trois

On Tuesday I talked about a small article published by the New York Times that looked at the cathedral fire. I lamented that there were no immediate graphics explaining what happened. Just give me two days. Tuesday we had the BBC piece and then yesterday the New York Times published a more extensive look.

As the user scrolls through the piece, a 3-dimensional model reveals the key structural elements whilst text explains why that part is being focused upon in the story.

Wood beams do not make for preventative measures.

I do not know if the dramatic, black background helps. It might create contrast the designers deemed helpful against the light-coloured illustration. But that is probably my only real point to make about the piece. Otherwise, it is a very thorough and helpful guide to the architecture and how that helped the fire spread.

Credit for the piece goes to Larry Buchanan, James Glanz, Even Grothjan, K.K. Rebecca Lai, Allison McCann, Karthik Patanjali, Yuliya Parshina-Kottas, Jeremy White, and Graham Roberts.

Public Transit of Yesteryear

For my frequent readers, it will be no big surprise that I am avid supporter of public transit, especially the railways. Consequently I was delighted when I read a non-Brexit piece in the Guardian yesterday that looked at public transit systems in several cities.

But it did so by comparing earlier plans or systems to those in existence today.

That's definitely one time I'd like to live in the past.
That’s definitely one time I’d like to live in the past.

Each design is slightly different and reflects the source material for the various cities. But I naturally selected the Philadelphia map. One of the biggest things to notice are the lack of trams/trolleys north of Girard and the addition of the River Line.

Credit for the piece goes to Jake Berman.

Angry Birds? Bad Birds

Baseball is almost upon us. And oh boy do the Baltimore Orioles look bad. How bad? Historically bad. FiveThirtyEight went so far as to chart the expected WAR, wins above replacement, of each position of all teams since 1973. And the expected Orioles lineup looks remarkably bad.

They are going to be so bad.

What is nice about this graphic is the use of the medium grey for each team/year combination. I may have used a filled orange dot instead of open, but the dots do at least standout and show the poor positioning of just about everything but the second baseman.

Credit for the piece goes to the FiveThirtyEight graphics department.

The Long and Winding Road

This Washington Post piece caught my eye earlier this week. It takes a look back at all the departures from the Trump administration, which has been beset by one of the highest turnover rates of all time.

So many names.
So many names.

What I like about the piece is how it classifies personnel by whether or not they require Senate confirmation. For example, Ryan Zinke as Interior Secretary had to be approved by the Senate. Nick Ayers, Pence’s former chief of staff, did not.

Importantly each name serves as a link to the story about the person’s departure. It serves as a nice way of leading the user to additional content while keeping them inside the graphic.

The further down the piece you go, there are notable sections where blocks of body copy appear in the centre of the page. These provide much more context to the comings and goings around that part of the timeline.

Credit for the piece goes to Kevin Schaul, Reuben Fischer-Baum, and Kevin Uhrmacher