Comparing the US Healthcare System to the World

Spoiler, we don’t look so great.

In this piece from the Guardian, we have one of my favourite types of charts. But, the piece begins with a chart I wonder about. We have a timeline of countries creating universal healthcare coverage, according to the WHO definition—of which there are only 32 countries. But we then plot their 2016 population regardless of when the country established the system. It honestly took me a few minutes to figure out what the chart was trying to communicate.
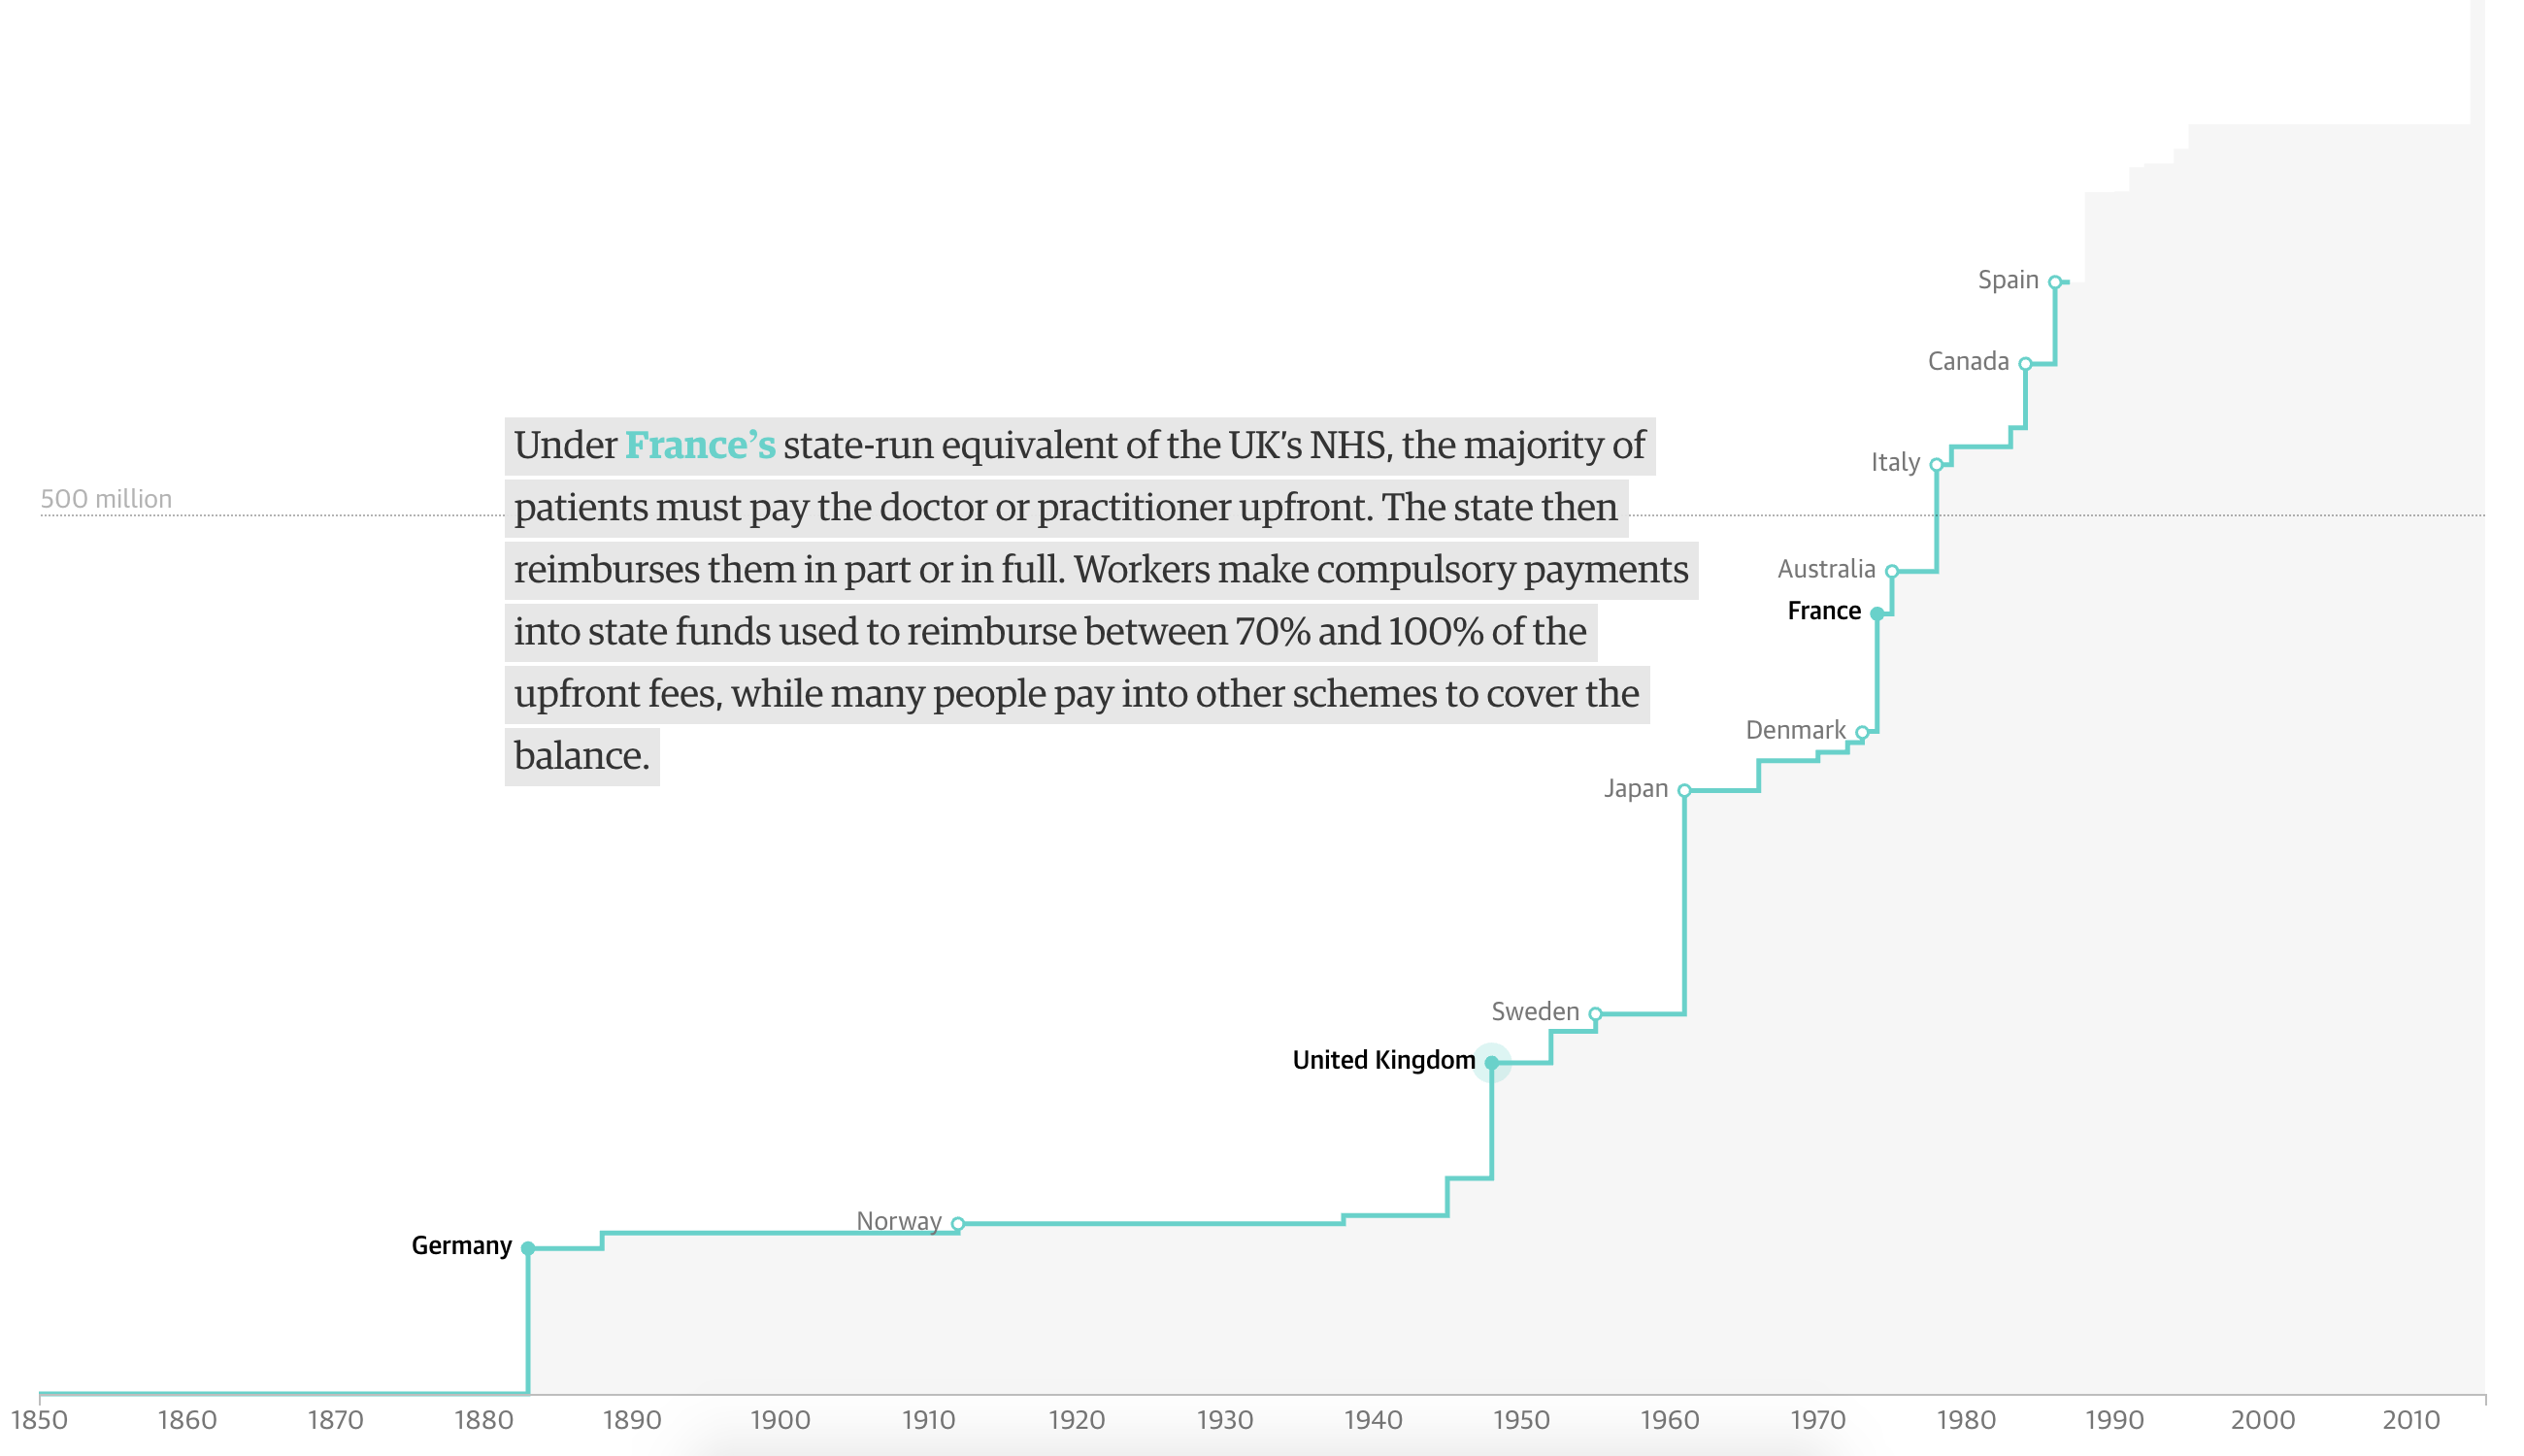
This is the only graphic I'm not sure of in the entire piece.
This is the only graphic I’m not sure of in the entire piece.

However, we do get one of my favourite charts: the scatter plot over time. And in it we look at the correlation between spending on healthcare compared to life expectancy. And, as I revealed in the spoiler, for all the money we spend on healthcare—it is not leading to longer lives as it broadly does throughout the world. And care as you might want to blame Obamacare, the data makes clear this problem began in the 1980s.
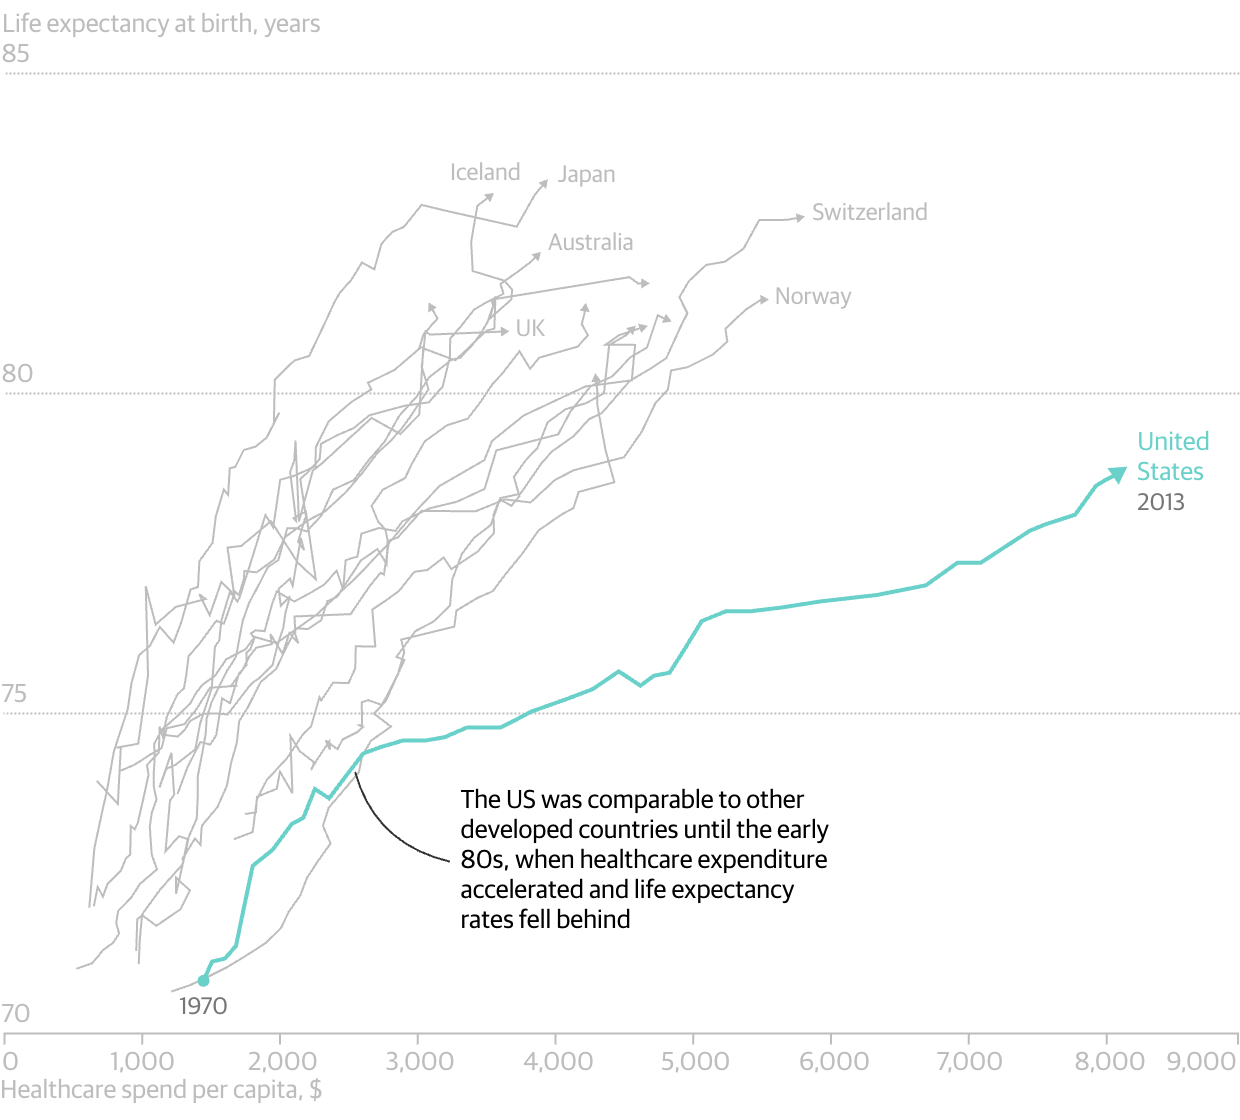
Someone's getting cheated out of a lot of money. Oh wait, that's us…
Someone’s getting cheated out of a lot of money. Oh wait, that’s us…

And of course Obamacare is why the Guardian published this piece since this is the week of the Vote-a-rama that we expect to see Thursday night. The Republicans will basically be holding an open floor to vote on anything and everything that can get some measure of repeal and/or replace 50 votes. And to wrap the piece, the Guardian concludes with a simple line chart showing the number of uninsured out to 2026. To nobody’s surprise, all the plans put forward leave tens of millions uncovered.
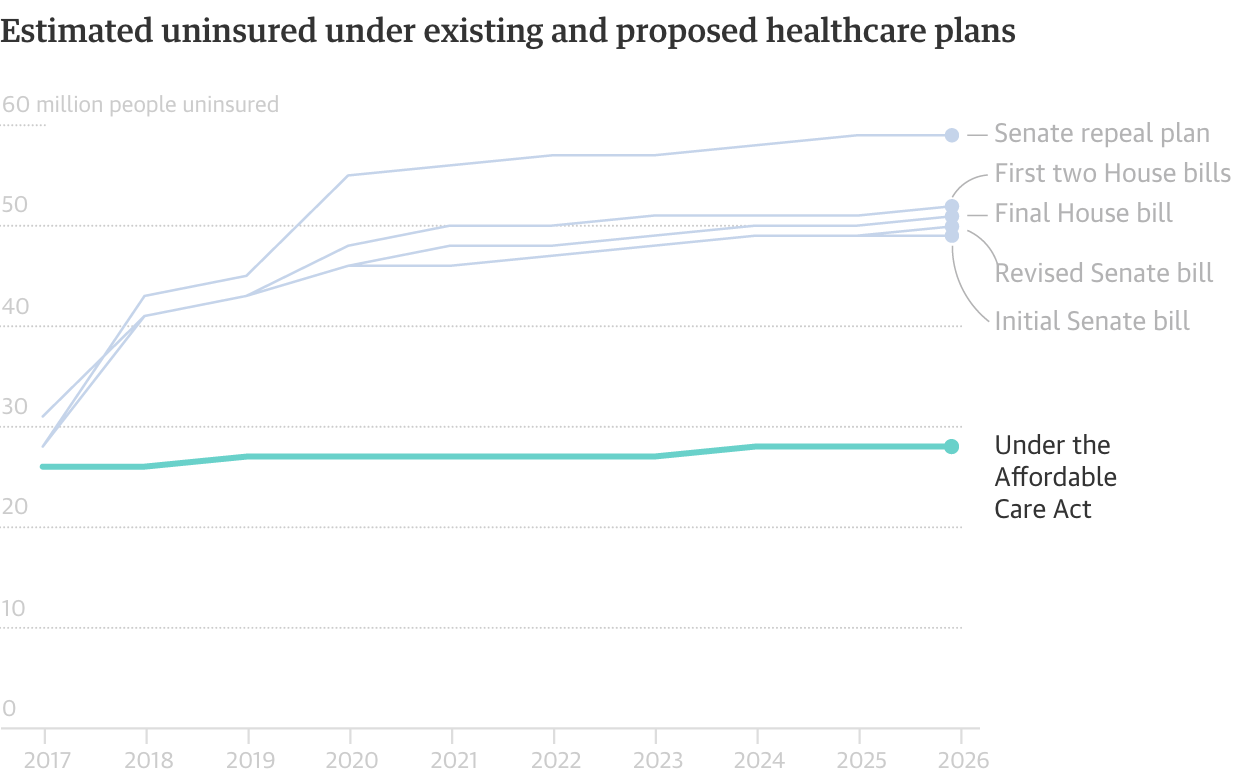
When all the options look bad, why not work with what you have?

It is a fantastic piece that is well worth the read, especially because it compares the systems used by a number of countries. (That is largely the text bit that we do not cover here at Coffeespoons.) I found the piece very informative.


Credit for the piece goes to the Guardian graphics department.

London in Small Multiple Form

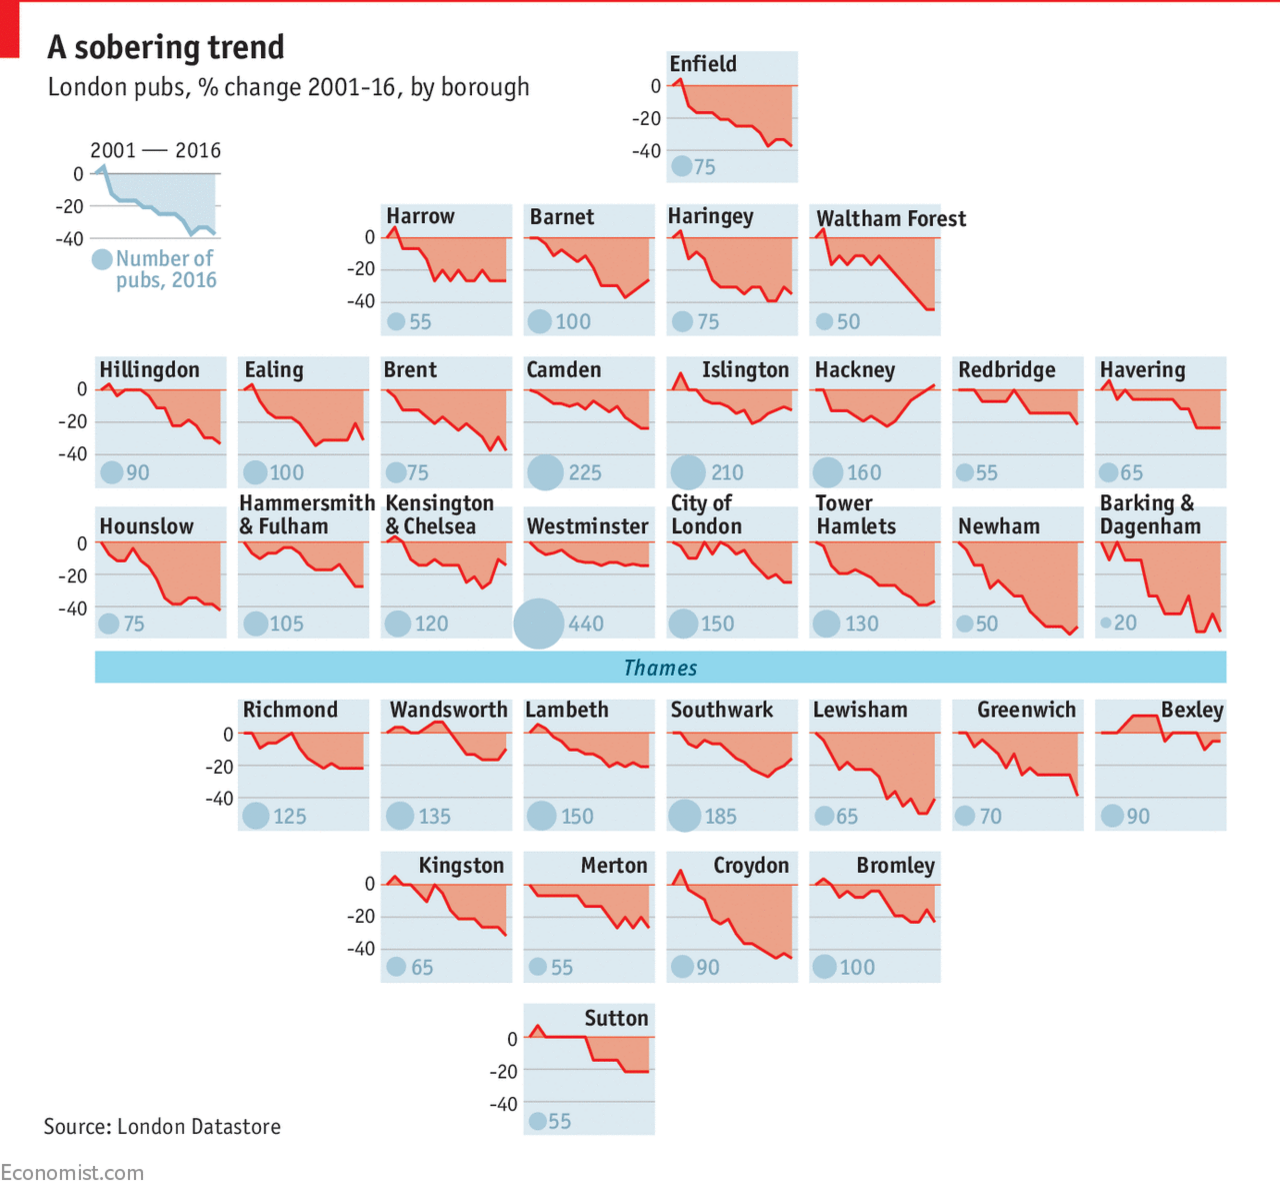
You all know that I love small multiples. And we have been seeing them more often as representations of the United States. But today we look at a small multiple map of London. The piece comes from the Economist and looks at the declining numbers of pubs in London. With the exception of the borough of Hackney, boroughs all across London are seeing declines, though the outer boroughs have seen the largest declines.

Mini London
Mini London

The only thing that does not work for me is the bubble in each tile that represents the number of pubs. That gets lost easily among the blue backgrounds. Additionally, the number itself might suffice.

Credit for the piece goes to the Economist graphics department.

Not Alone for Trivia

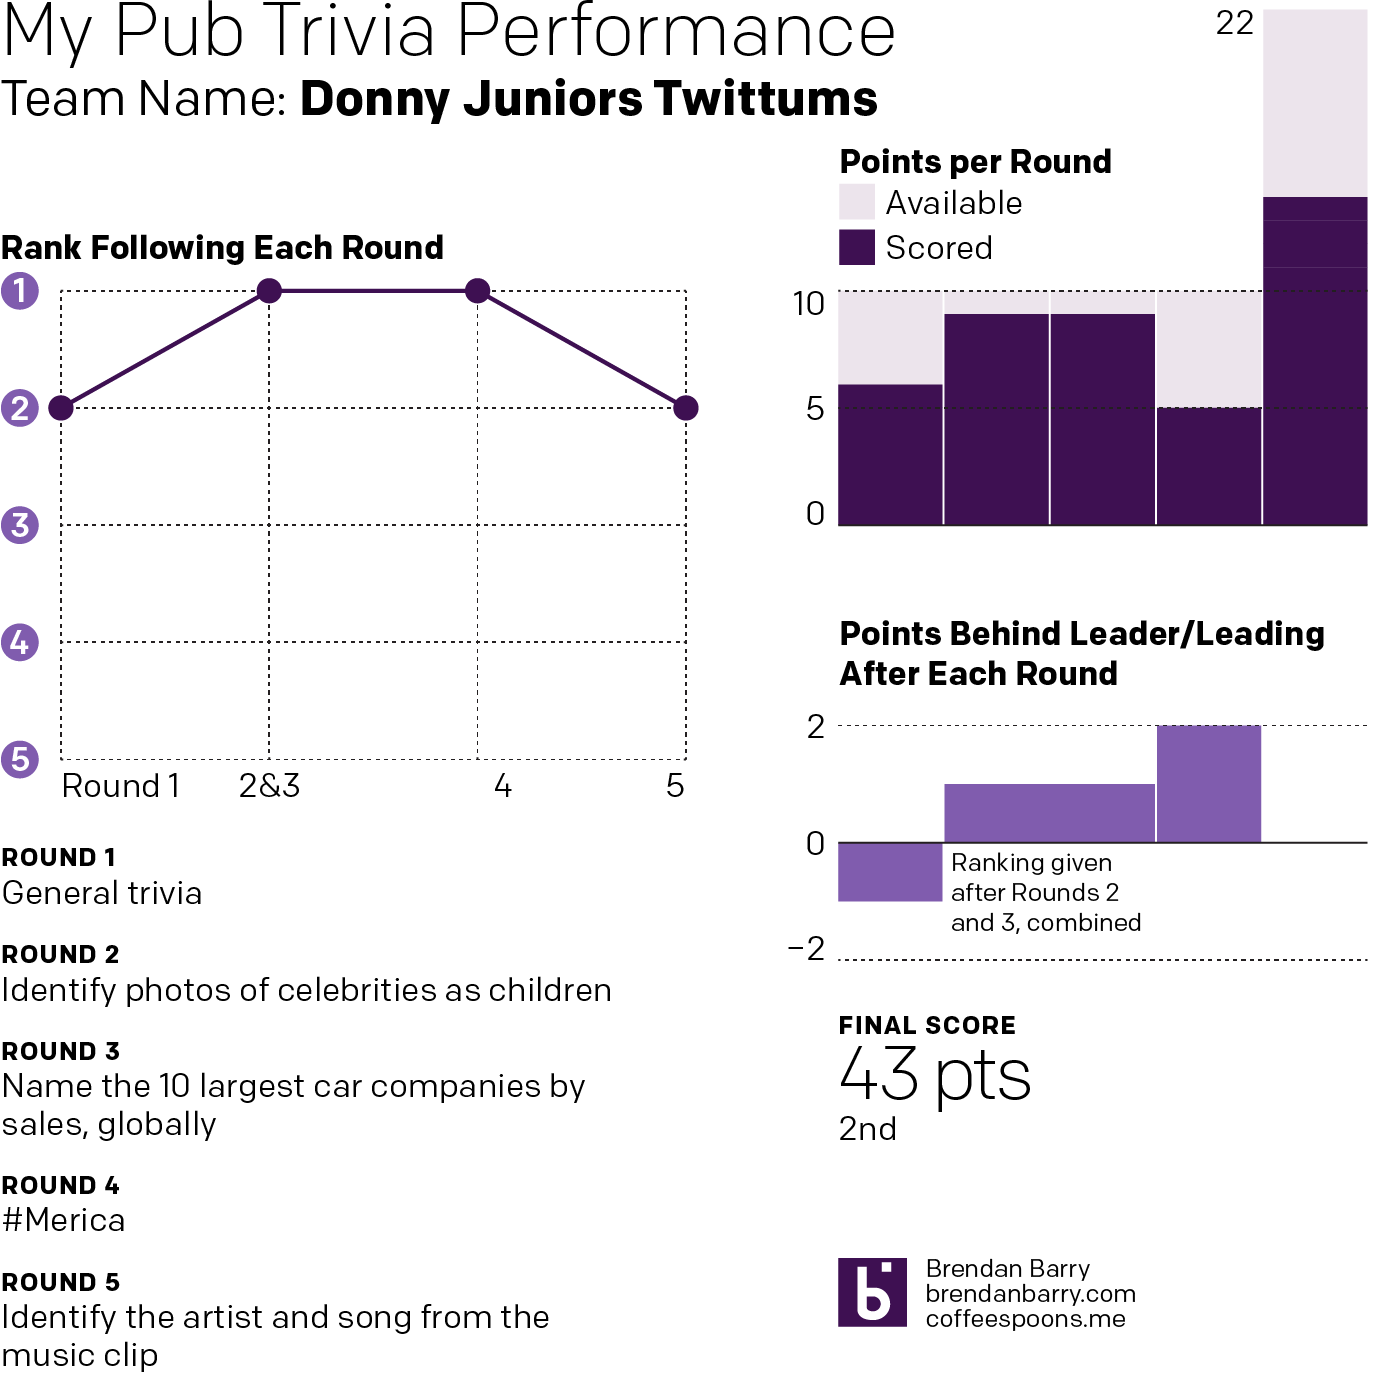
Well after the last two weeks of recording solo trivia performances, I decided that this week I would showcase a team effort.

A non-solo performance

And we finally placed, ending the performance tied for first place. But if you look closely you will see the final score has us at second. Why when we were tied with the same number of points? Because tiebreaker. And after I was selected to represent the team, I needed to respond, within three seconds, with the names of Tom Hanks films in a back-and-forth response.

I could name only Saving Private Ryan and Castaway. My competitor, she named three. They won.

Another Solo Pub Trivia Performance

This past Wednesday I once again ended up playing trivia at the pub solo. Once again, I decided over the final pint that I would attempt to visualise my performance.

One thing to keep in mind is that on Wednesday there were fewer teams competing—five instead of nine. And while I never placed higher than tied for third, this week’s bar charts show how I was incredibly competitive until the final music round.

Music and celebrity are clearly not my strong suits

Despite an abysmal performance at naming celebrities as they were as children, my near-perfect second round kept me only five points behind first place. And a perfect fourth round meant heading into that final round I climbed back to being only three points back. Thankfully I knew more of the songs this past week. And enough to not finish last. But, I was close enough that a perfect round would have been enough to still place first.

Super helpful that Lord of the Rings questions appeared a few times.

The Donald and The Donald Subreddit

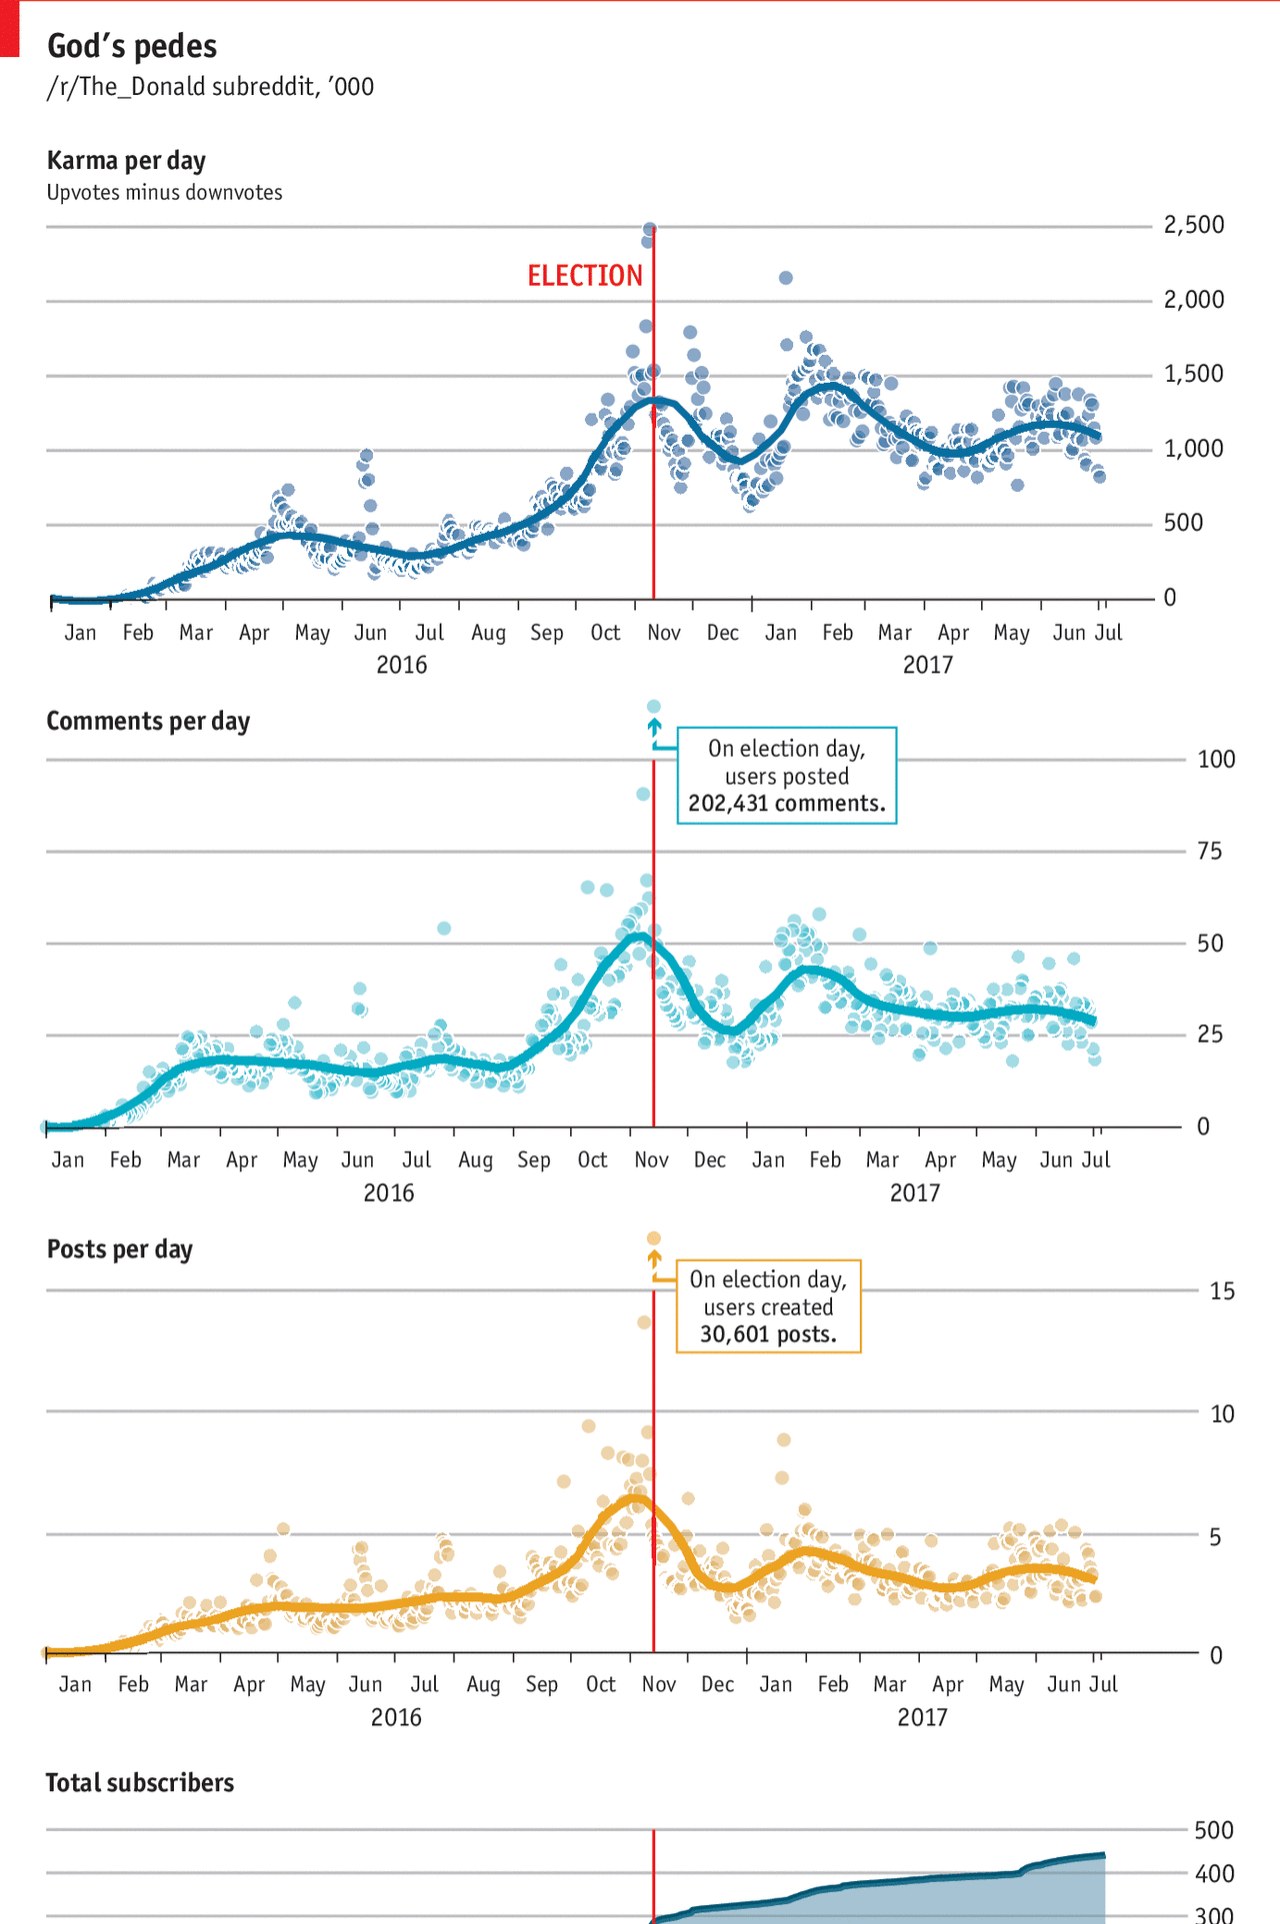
I don’t use Reddit. But things begin to made sense for me in this article from the Economist as it explained the origins behind Trump’s weird tweet of himself beating up a CNN-headed wrestler.

Unfortunately I don't understand how Reddit works well enough to make full sense of these
Unfortunately I don’t understand how Reddit works well enough to make full sense of these

I think the thing perhaps lacking from the graphic is a line that tracks Trump’s approval or popularity. The article mentions that explicitly and it would be interesting to see that track over time. Although I certainly understand how stacking so many line charts above each other could become difficult to compare.

And my final critique are the Election Day outliers. They are above the y-axis maximum. But I wonder if there couldn’t have been a way of handling the outlier-ness of the datapoints while remaining true to the chart scales.

Credit for the piece goes to the Economist graphics department.

Pub Trivia Performance

Wednesday night I had the dubious honour of playing the weekly pub trivia solo. Accordingly my team name was Hats Solo. (After I opted not to wear my fedora one night, another regular team called itself Where’s Your Hat?) I started strong, had a second wind, but still faded to a seventh place (of nine) finish. As I finished my G&T, I decided I would visualise the results. Here, two days later, are my results.

History and geography are usually my strong suits

Credit for the highlights, mine. The lowlights, someone else.

Rising Rate of US Drug Deaths

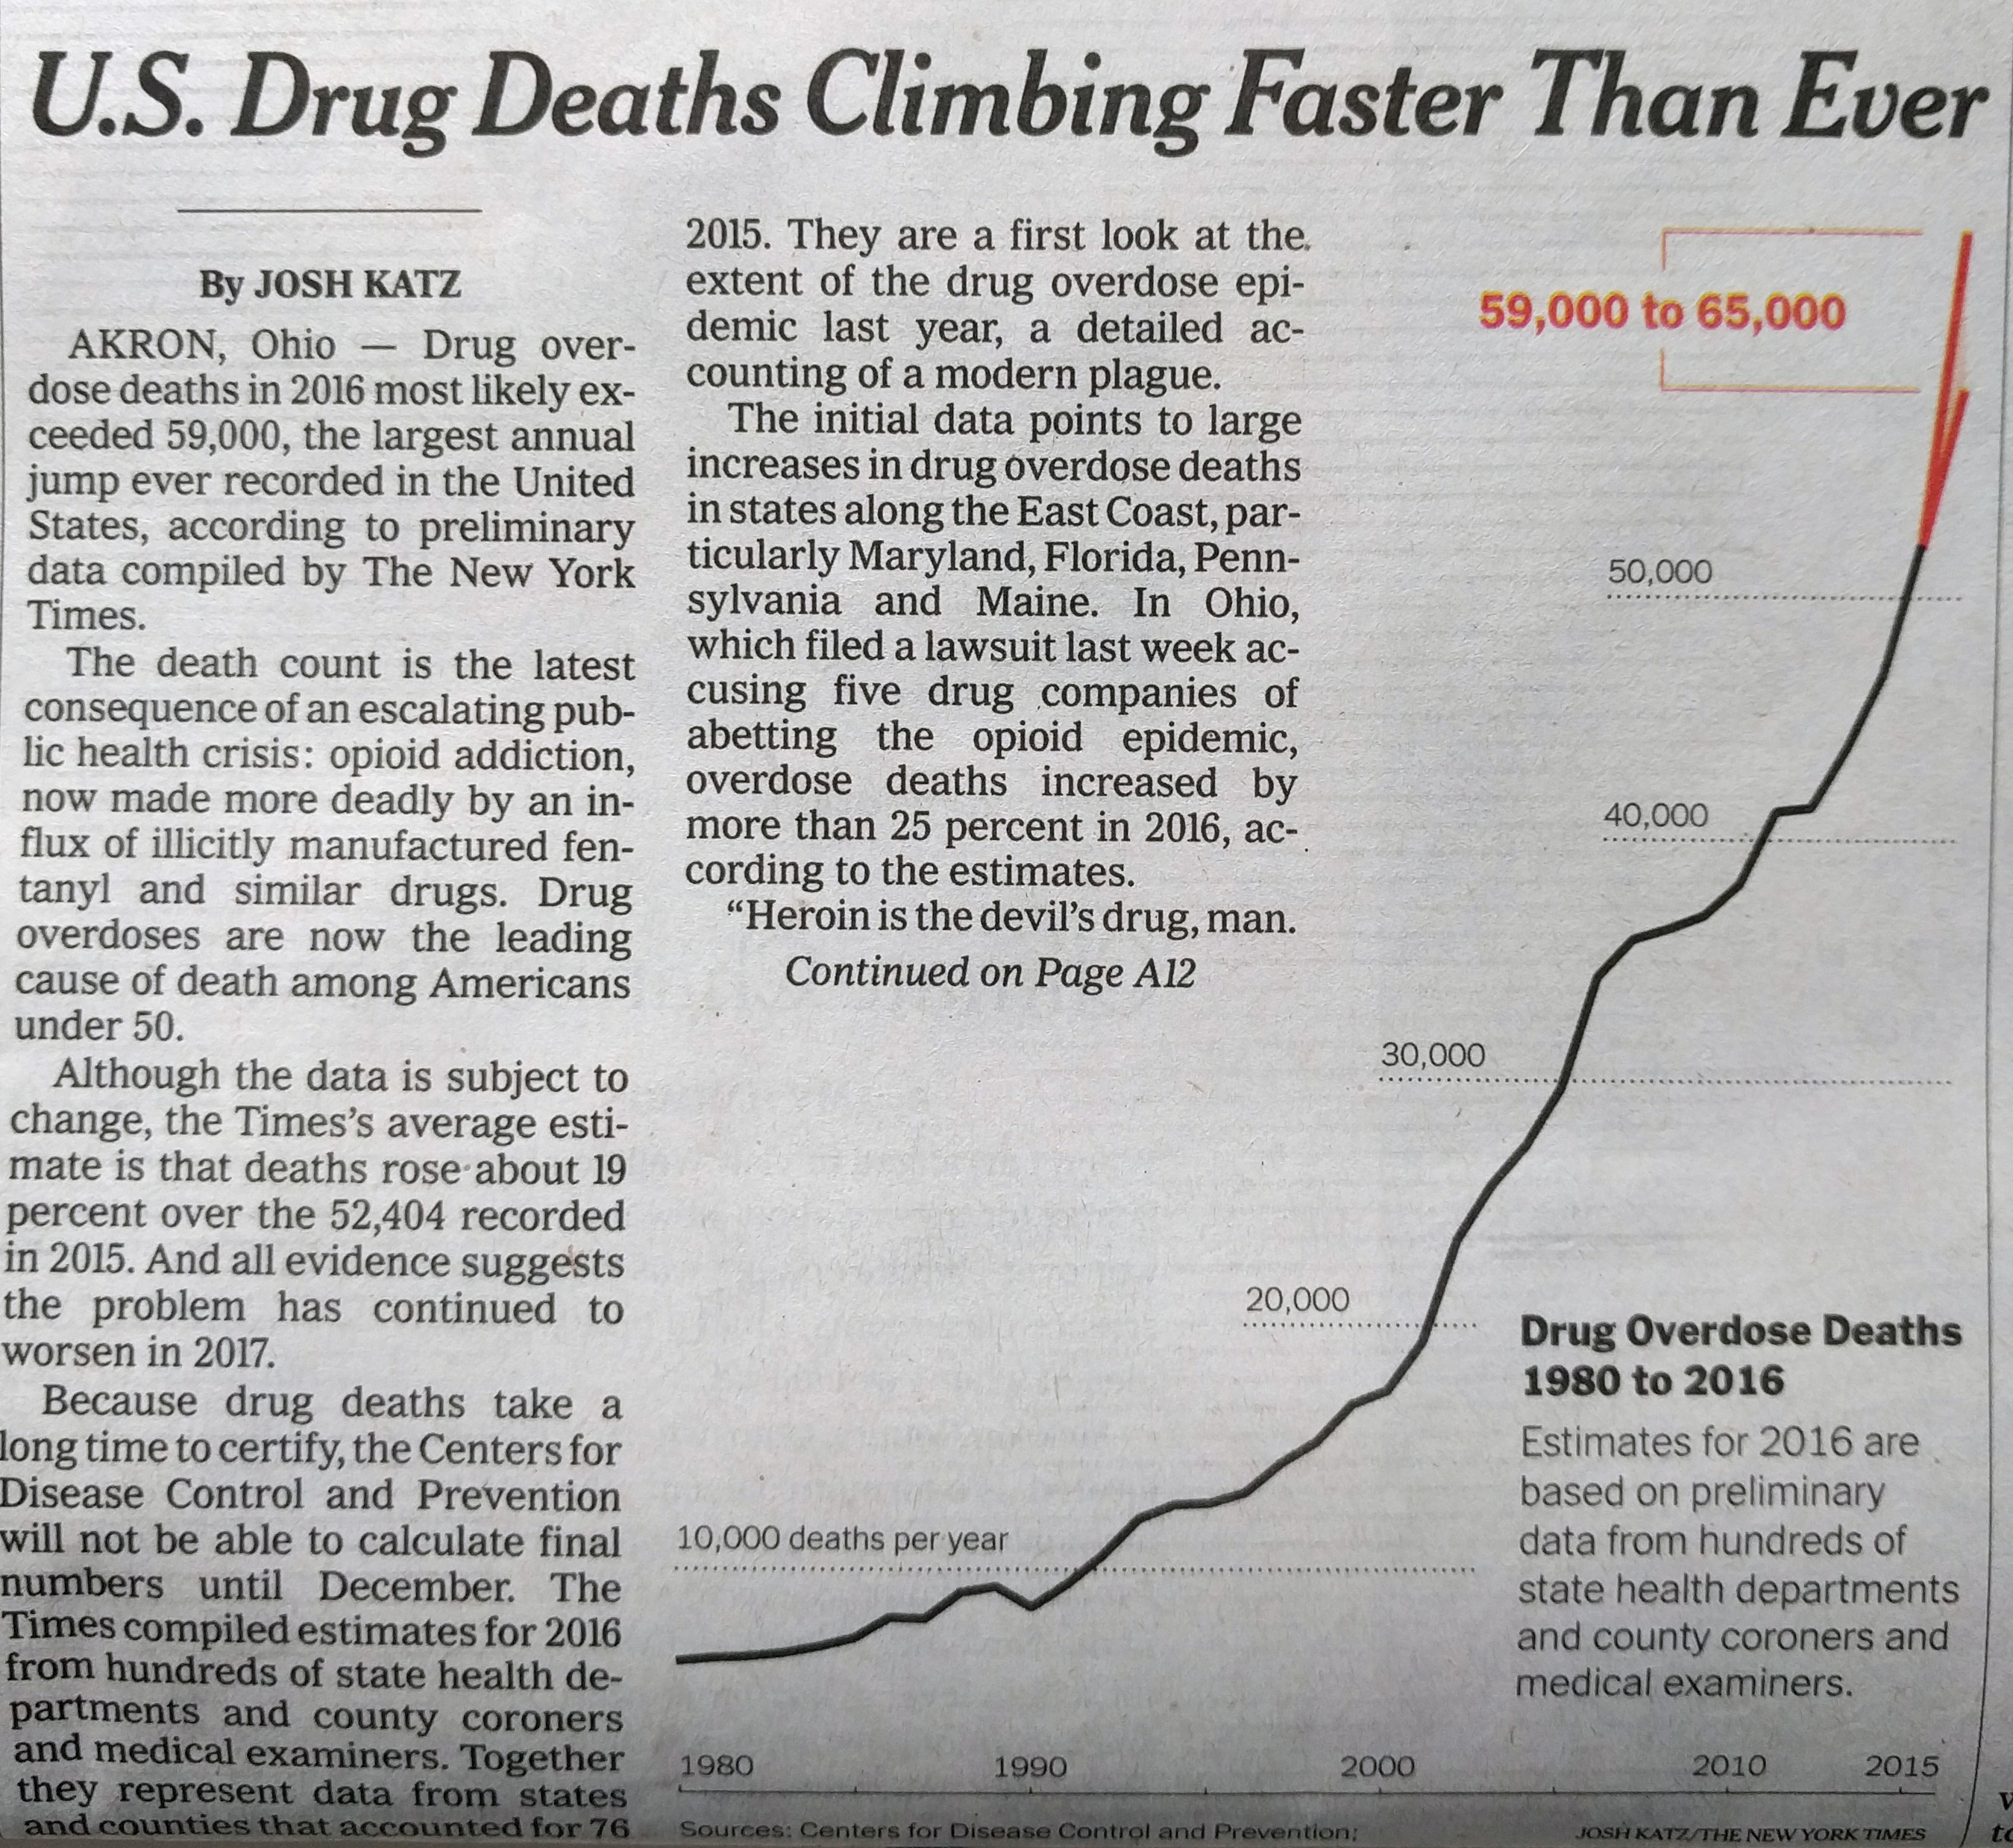
While today’s post is not an uplifting story, I did find it remarkable in its presentation. Nothing too fancy or revolutionary to be certain, but remarkable nonetheless. What was it? This morning when I picked up the Times there was a chart in black and red, above the fold, below the cover photo.

The story is about the rising number of deaths in the United States attributed to drugs. And, no, the line chart is not groundbreaking—though I do love the way the designers cut into the space to efficiently set copy and annotations. But as an above-the-fold graphic this morning, it did the trick.

Again, I like the layout of the piece

Credit for the piece goes to Josh Katz.

Energy Production in Pennsylvania

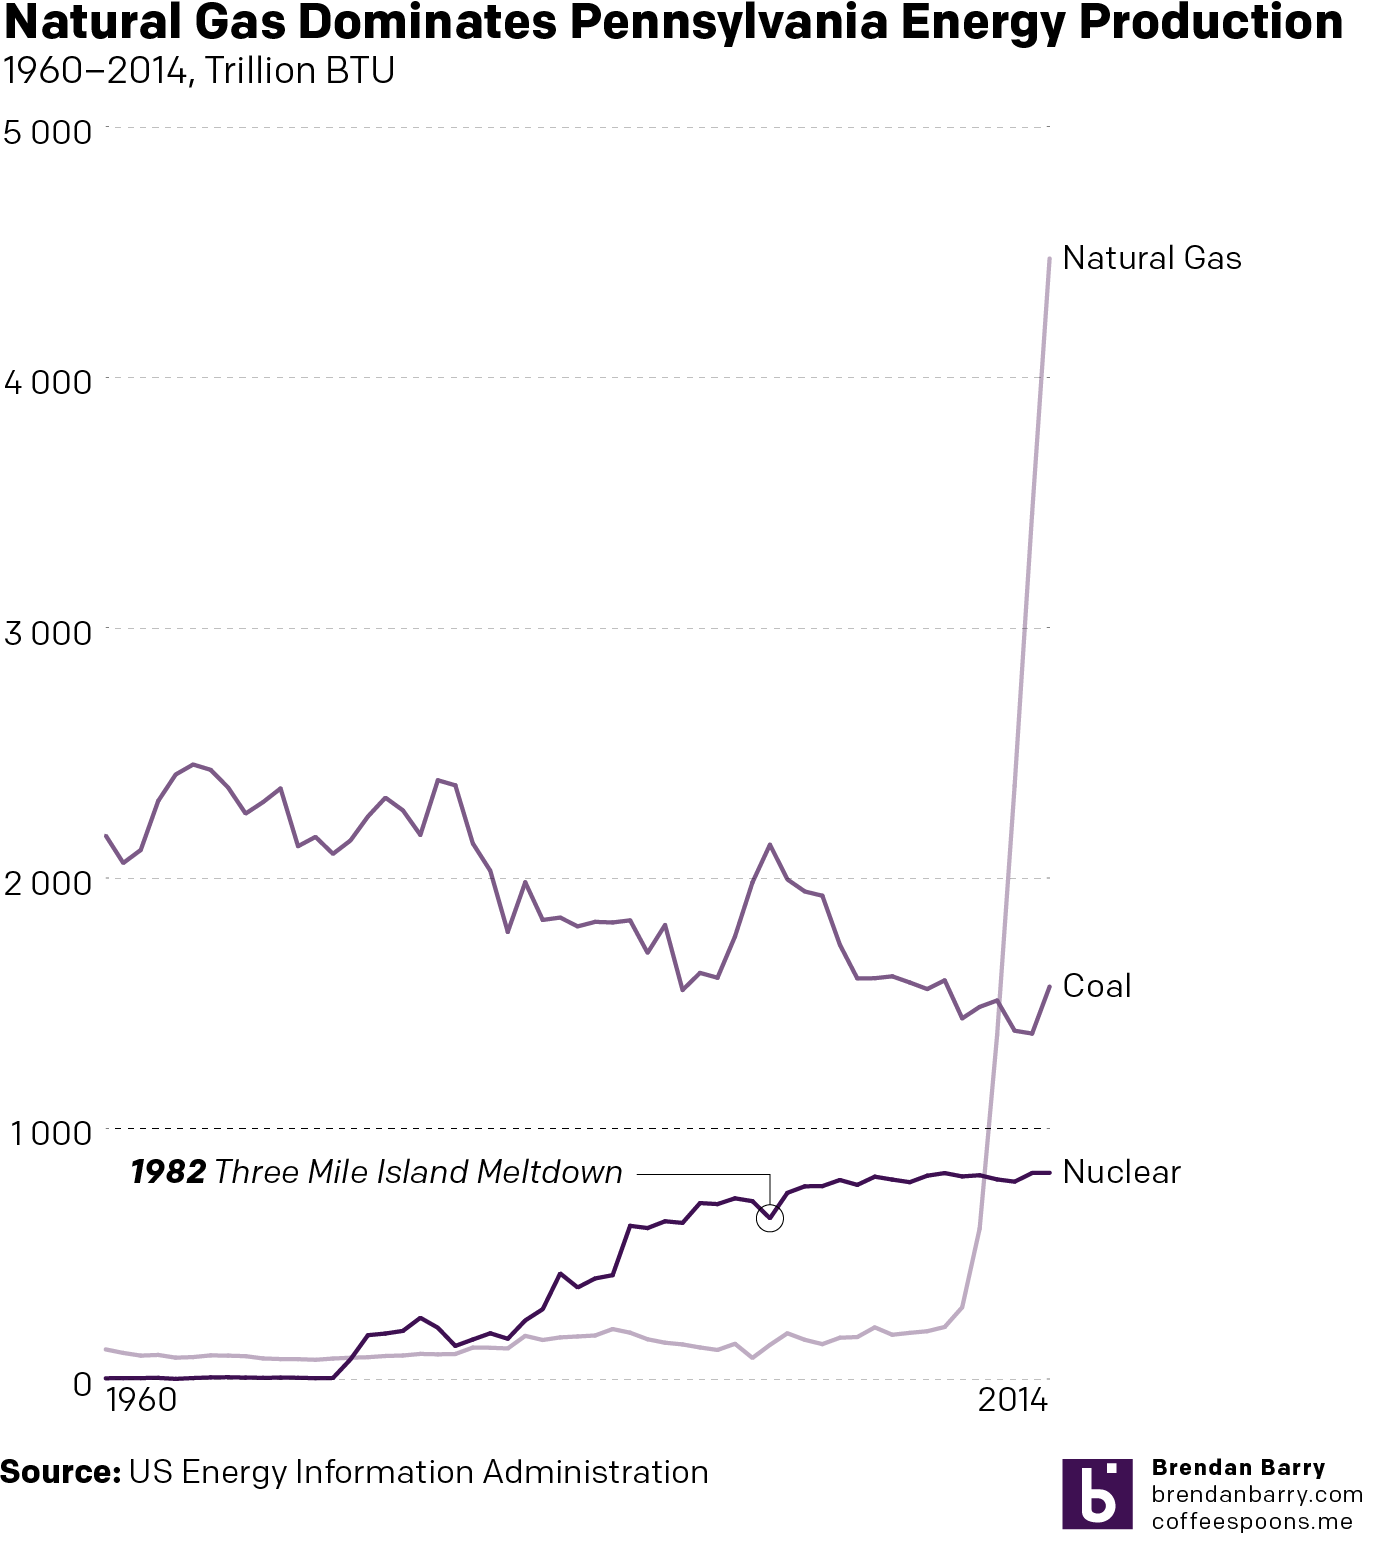
Pennsylvania was the country’s first state to operate a nuclear power plant for electricity generation and is today the second-largest nuclear-generated electricity state after Illinois. But in recent years the triple threat of the Pennsylvania Marcellus Shale natural gas boom, wind power subsidies, and solar power subsidies have hit the state’s nuclear industry hard. Consequently the power company Exelon has announced plans to shutdown the generating station at Three Mile Island—yes, that Three Mile Island—in 2019 if Pennsylvania does not rescue the industry as have the states of Illinois and New York, each facing similar challenges.

I wanted to take a look at the electricity generated by nuclear power in Pennsylvania, but had to settle for energy produced. And while the data was only as recent as 2014, it did extend back to 1960 thereby dating back almost as far back as nuclear power in Pennsylvania—it began in 1957.

The subject has always been of interest to me and was the focus of one of my first data visualisation pieces back at university. And so while the data is not quite the same, nor over the same geographic area, it is interesting to see the spike since even 2008. (Worth noting that even in a coal state the long, slow decline of coal even before President Obama is self-evident.)

The rise of Marcellus Shale natural gas has been quick and dramatic

Unfortunately the EIA data came through a .pdf and not a more accessible data file so I spent most of my time recreating the data. Consequently, I had little time to do more than track these changes. But even still, I think you would agree the message is clear: natural gas has quickly disrupted the market. (Let’s again ignore the fact I could not plot renewable energy sources.)

Small disclaimer I suppose, I have always supported nuclear power as part of a non-carbon energy portfolio. But I also grew up within sight of and fascinated by the Limerick Generating Station steam clouds, so call me biased.

Credit for this graphic is mine.

Trump’s Polling

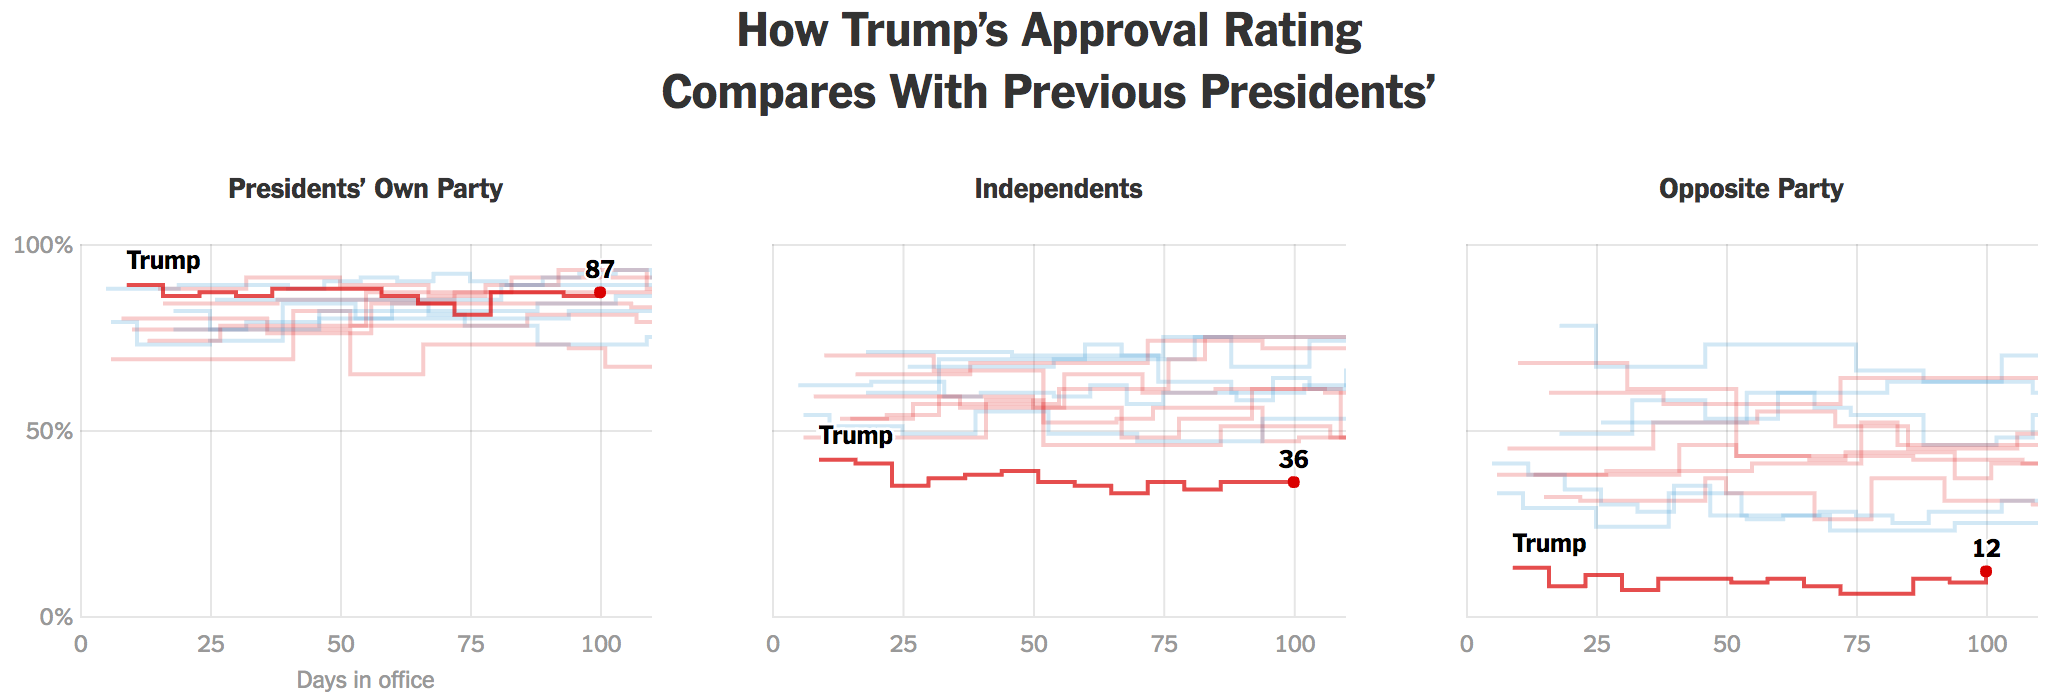
My battery is about to die this morning and I don’t have my charger so this is going to be a shorter piece than usual. But I wanted to look back on the 100 Day polling that the New York Times posted. It does paint an interesting picture of somebody so polarising that Trump is probably safe despite being one of the least favourably viewed presidents in modern times. Why? Because his supporters are so fervently loyal.

Not only is Trump low, he's low historically
Not only is Trump low, he’s low historically

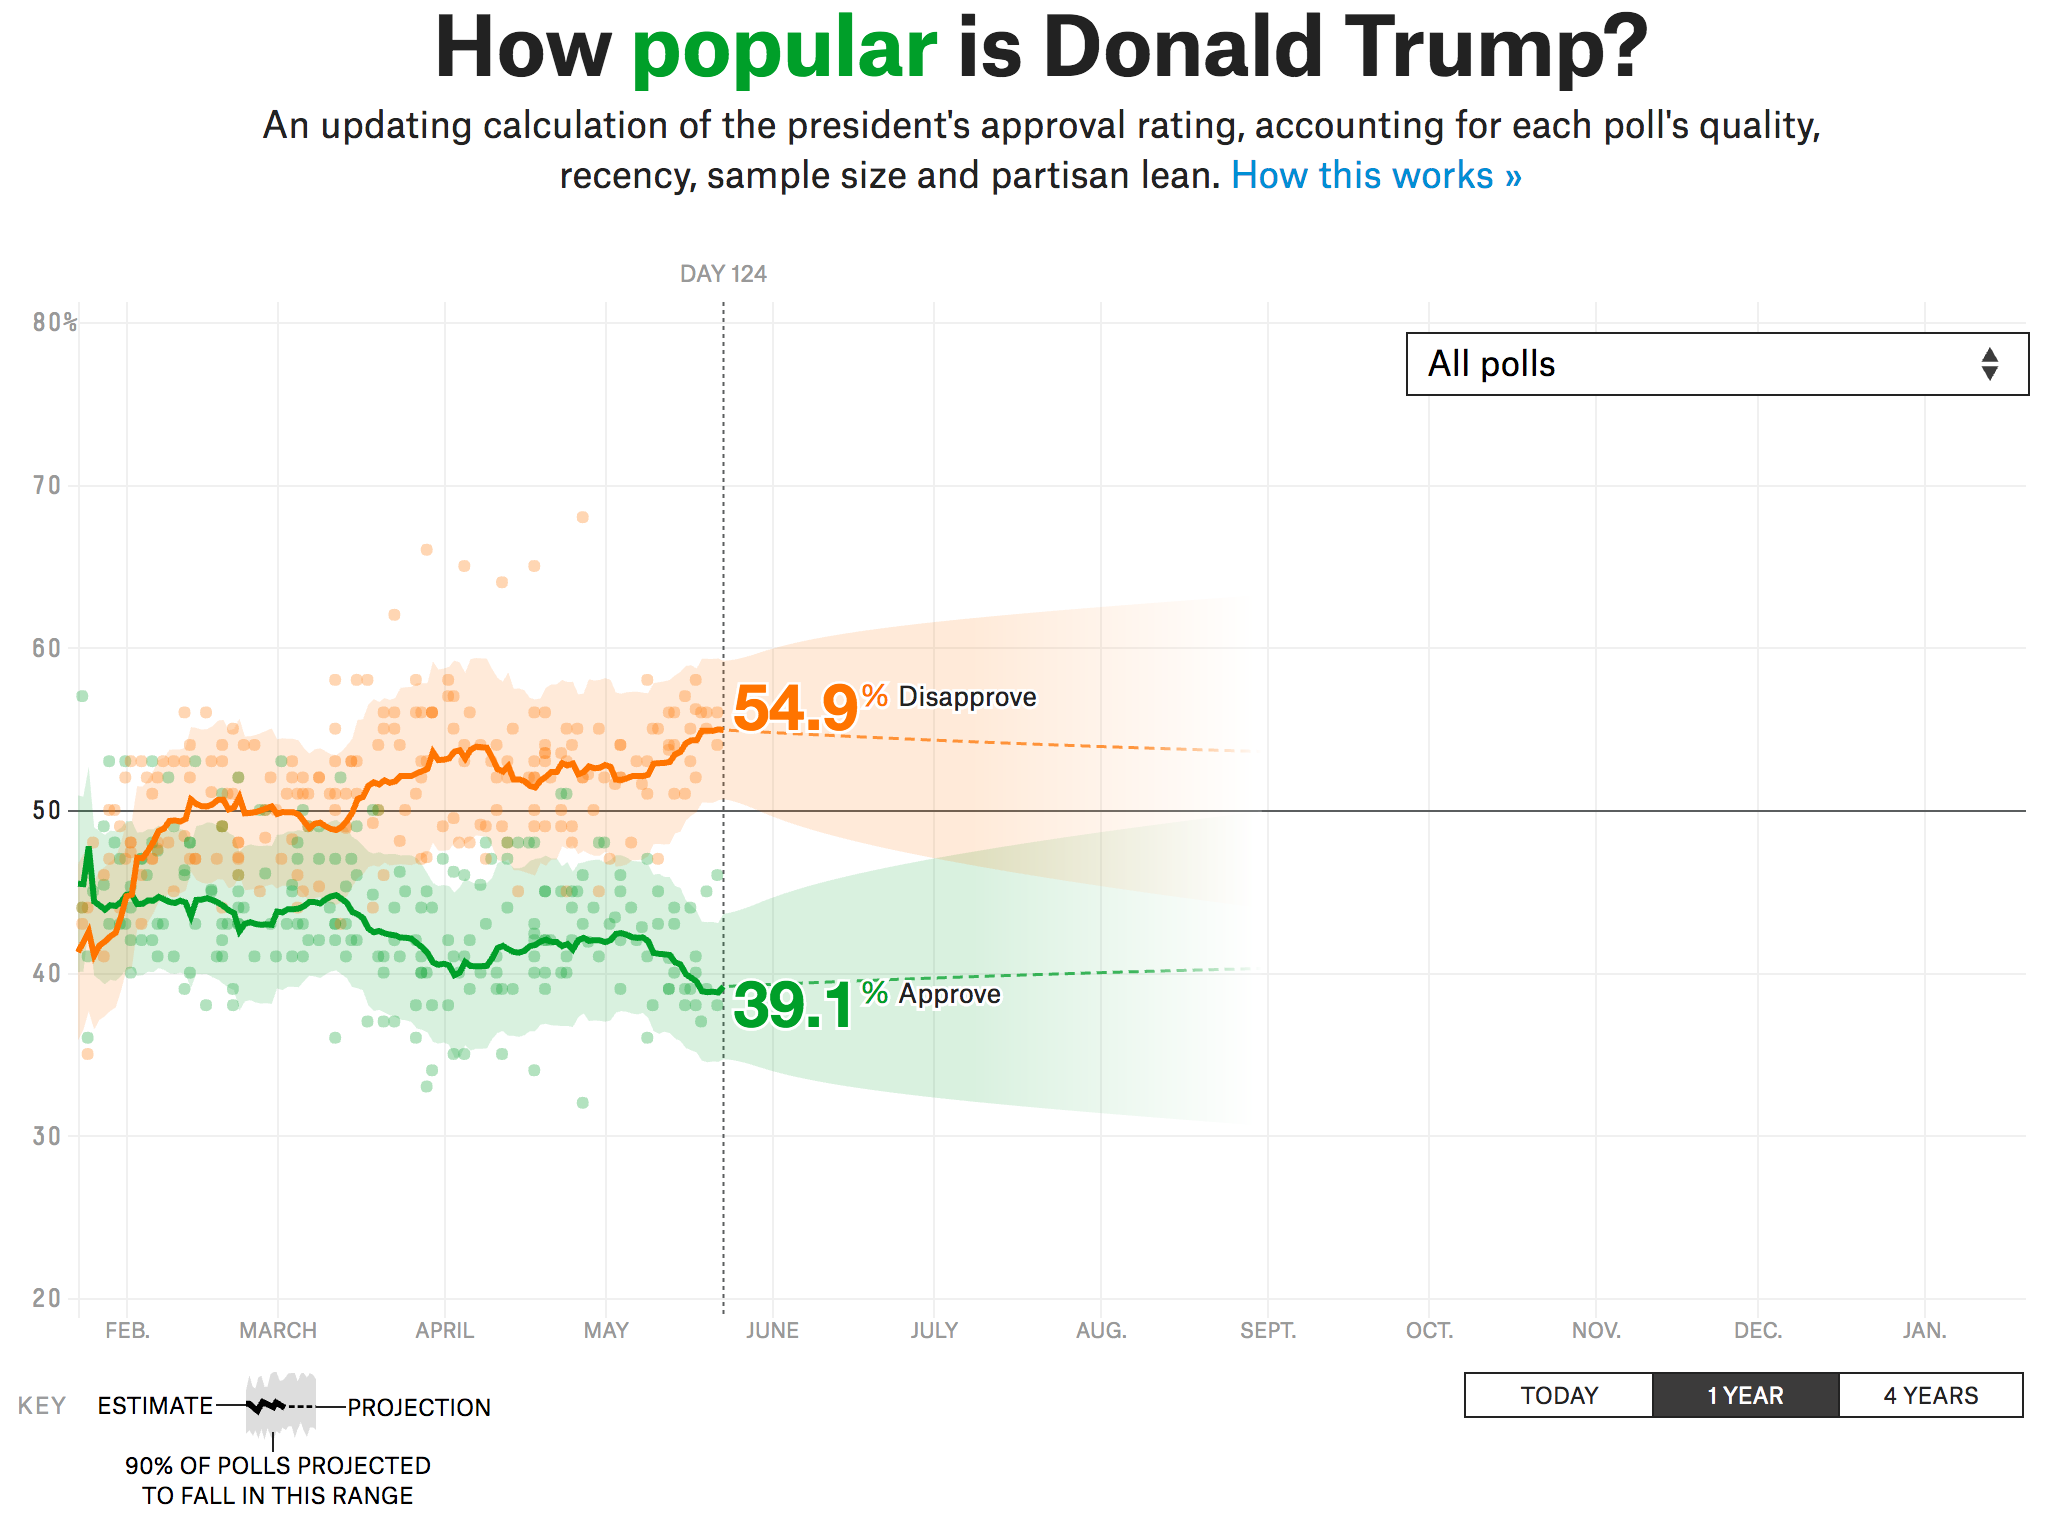
But that piece is almost a month old now. And so I wanted to point out something that FiveThirtyEight is doing—a running tracker of Trump’s polling. I am sure I will return to it in the future, after all we have over three and a half years to go until the next four year presidential term begins.

Trump is pretty low…

Credit for the piece goes to Karen Yourish and Paul Murray for the Times and Aaron Bycoffe, Dhrumil Mehta, and Nate Silver for FiveThirtyEight.

Life Expectancy in the US and All Its States

Happy Monday, all.

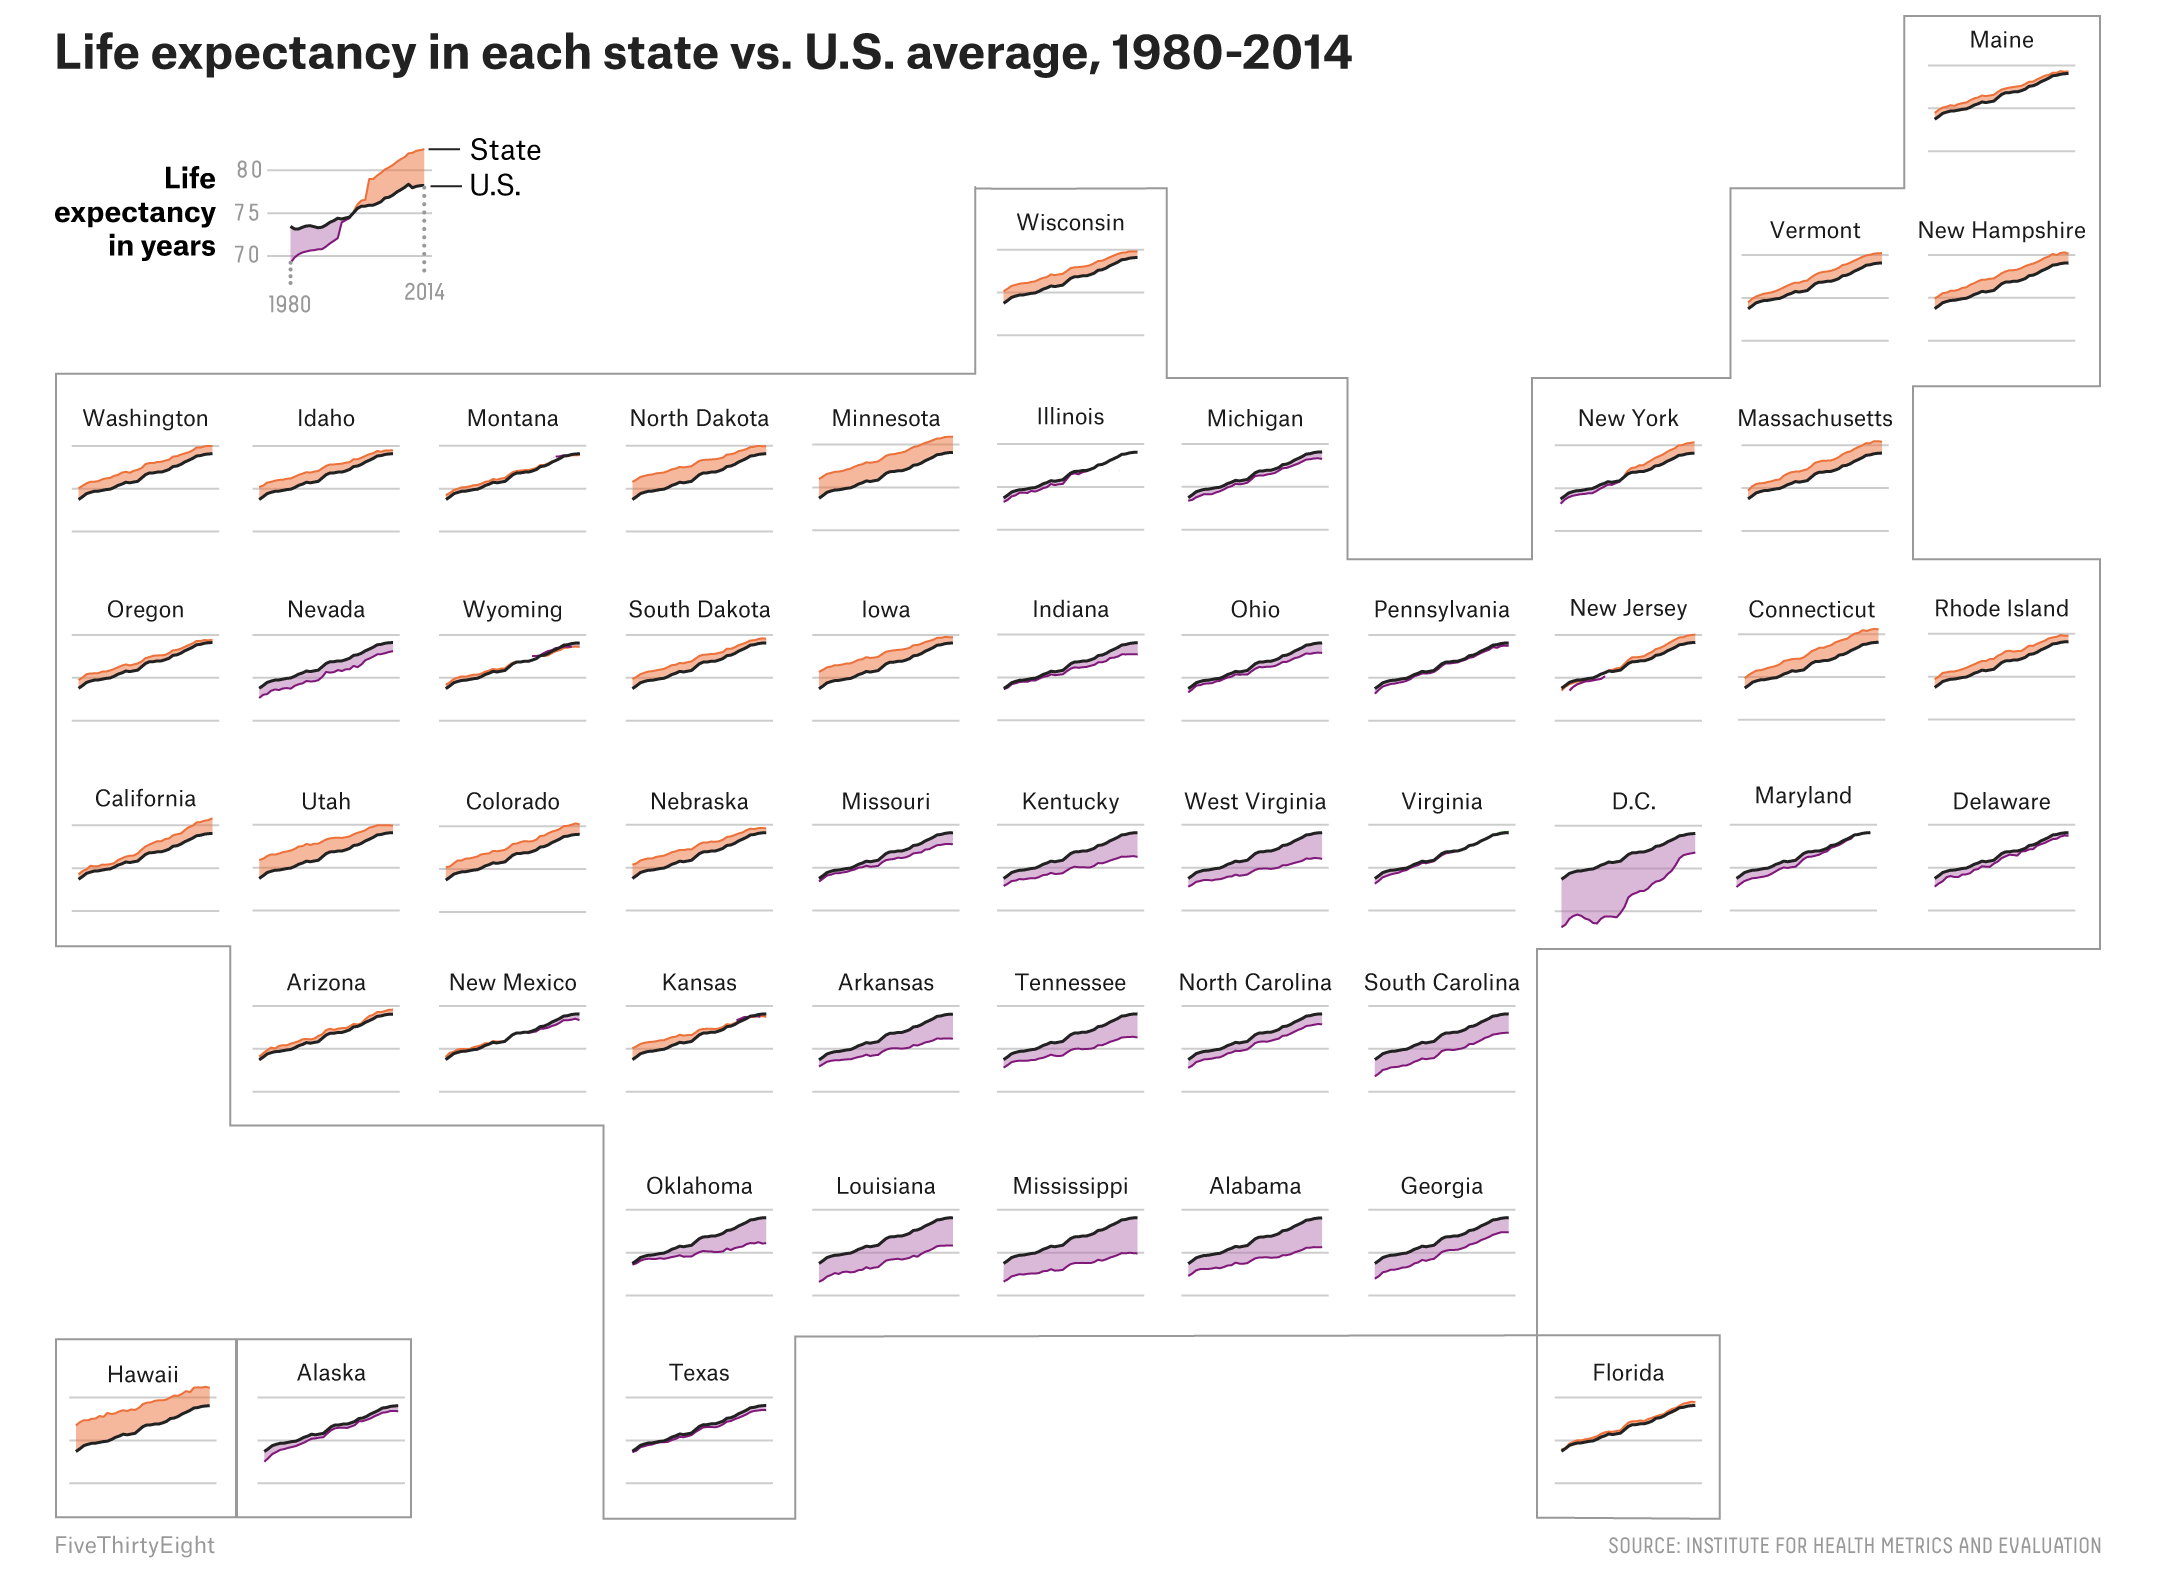
If this week’s news cycle cooperates, I am going to try and catch up on some things I have seen over the last several weeks that got bumped because of, well, Trump usually. Today we start with a piece on life expectancy from FiveThirtyEight.

The piece begins with a standard choropleth to identify, at county levels, pockets of higher mortality. But what I really like is this small multiples map of the United States. It shows the changes in life expectancy for all 50 states. And the use of colour quickly shows, for those states drastically different than the national average, are they above or below said average.

Look at all the little boxes

Credit for the piece goes to the FiveThirtyEight graphics department.