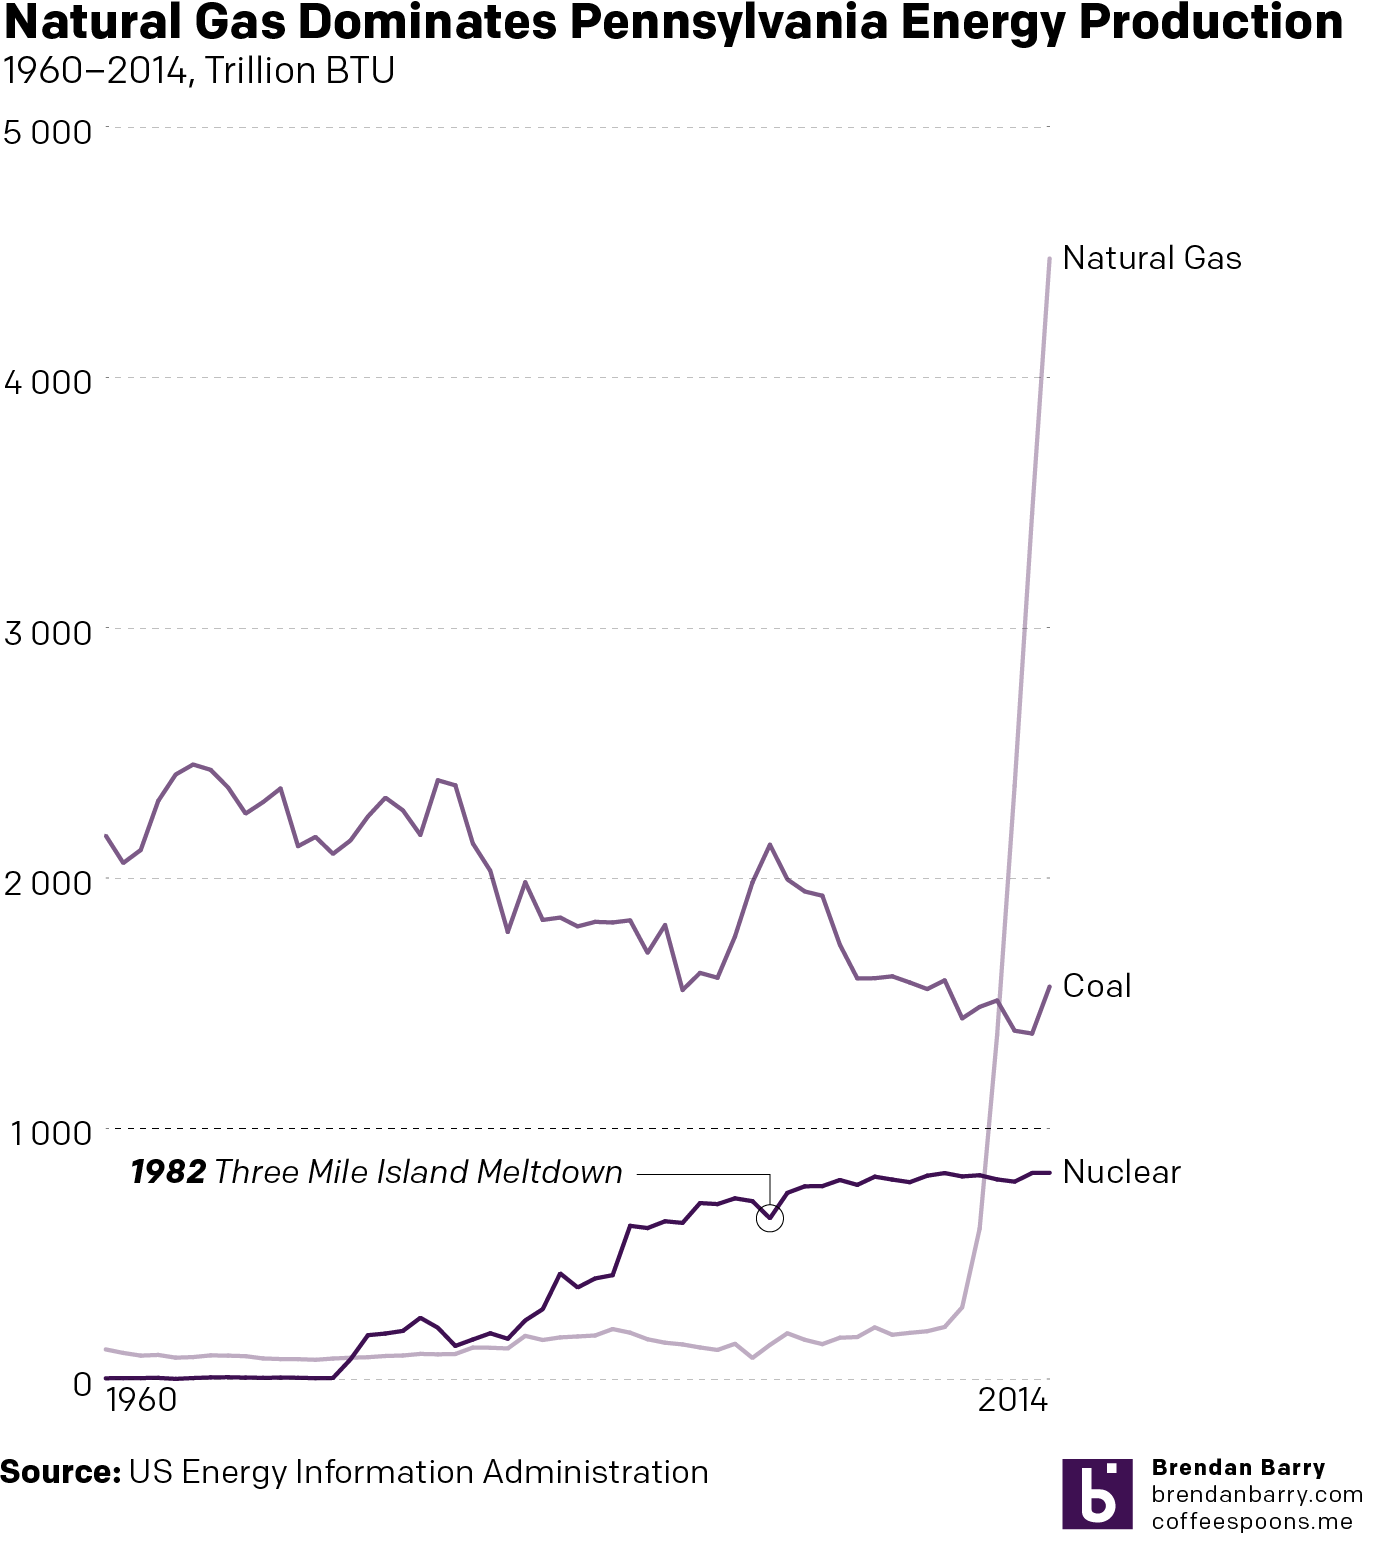
Pennsylvania was the country’s first state to operate a nuclear power plant for electricity generation and is today the second-largest nuclear-generated electricity state after Illinois. But in recent years the triple threat of the Pennsylvania Marcellus Shale natural gas boom, wind power subsidies, and solar power subsidies have hit the state’s nuclear industry hard. Consequently the power company Exelon has announced plans to shutdown the generating station at Three Mile Island—yes, that Three Mile Island—in 2019 if Pennsylvania does not rescue the industry as have the states of Illinois and New York, each facing similar challenges.
I wanted to take a look at the electricity generated by nuclear power in Pennsylvania, but had to settle for energy produced. And while the data was only as recent as 2014, it did extend back to 1960 thereby dating back almost as far back as nuclear power in Pennsylvania—it began in 1957.
The subject has always been of interest to me and was the focus of one of my first data visualisation pieces back at university. And so while the data is not quite the same, nor over the same geographic area, it is interesting to see the spike since even 2008. (Worth noting that even in a coal state the long, slow decline of coal even before President Obama is self-evident.)

Unfortunately the EIA data came through a .pdf and not a more accessible data file so I spent most of my time recreating the data. Consequently, I had little time to do more than track these changes. But even still, I think you would agree the message is clear: natural gas has quickly disrupted the market. (Let’s again ignore the fact I could not plot renewable energy sources.)
Small disclaimer I suppose, I have always supported nuclear power as part of a non-carbon energy portfolio. But I also grew up within sight of and fascinated by the Limerick Generating Station steam clouds, so call me biased.
Credit for this graphic is mine.
