
Continuing with election-y stuff, I want to share a fascinating map from the Washington Post. The article came out last week, and it is actually incredibly light in terms of data visualisation. By my count, there were only two maps. The article’s focus is on interviews with Trump voters in 2016 and how their opinions of the president have changed over the last year or so. If you want to read it, and you should as it is very well written, I will warn you that it is long. But, to the map.
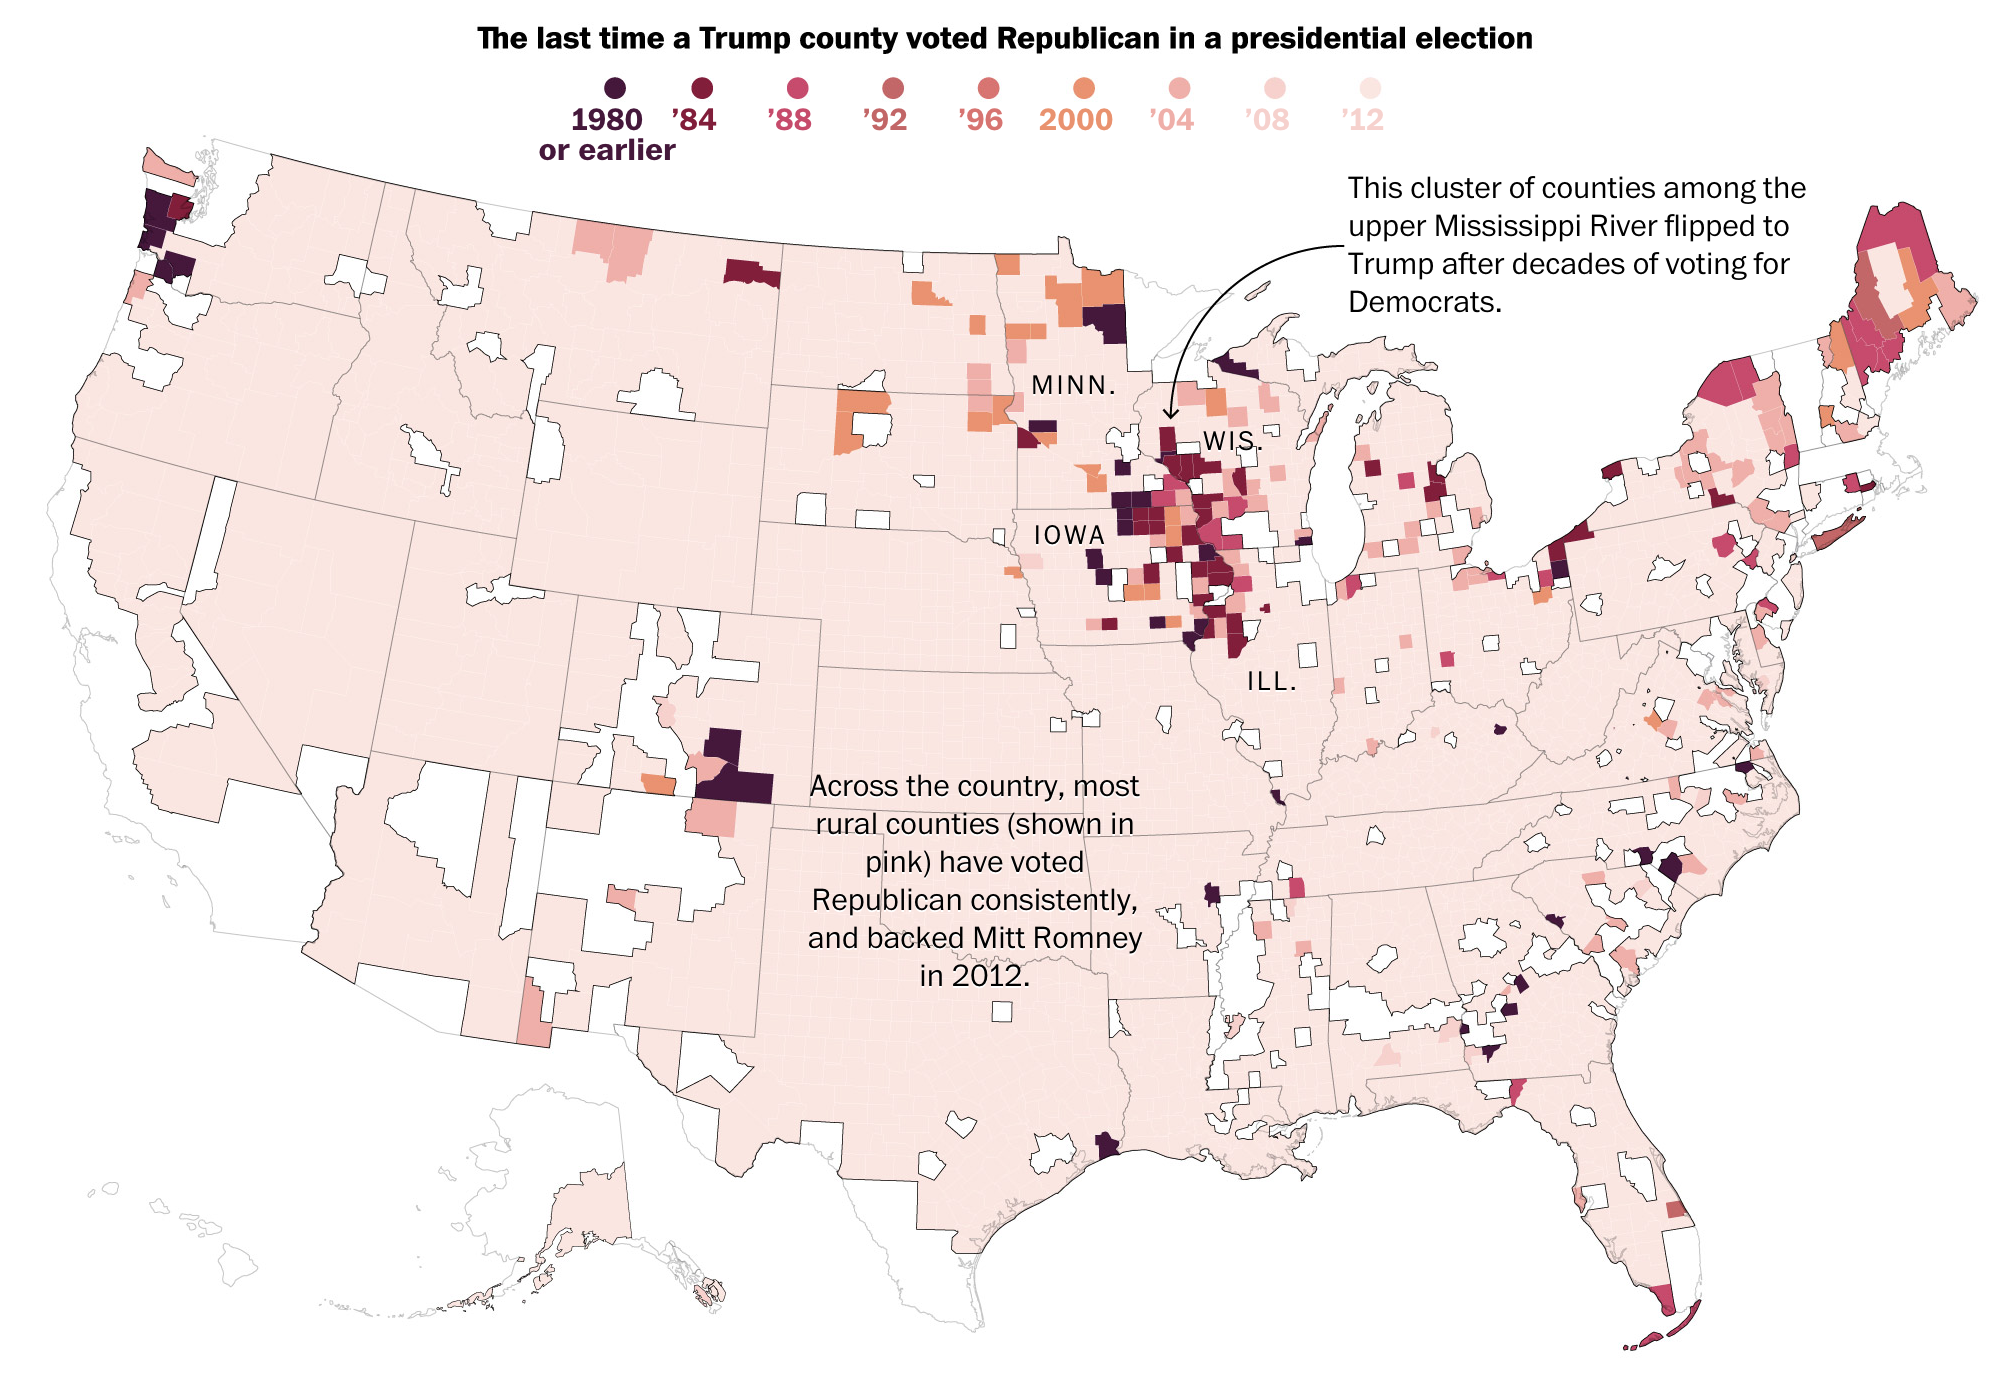
What I loved about this map is how it flips the usual narrative a bit on its head. We talk about how much a candidate won a county in 2016, or even how much the vote shifted in 2016. And anecdotally we talk about “ancestral Democrats” flipping to Trump. But this map actually tries to chart that. It reveals the last time a county actually voted for a Republican presidential candidate—the darker the red, the further back in time one has to go.
Counties that vote Democratic are white, because why do we need them for this examination. Omitting them was a great design decision. Much of the country, as we know or can intuit, voted Republican in 2012 for Mitt Romney. But what about before then? You can see how the upper Midwest, along the Mississippi River, was a stronghold for Democrats with some counties going as far back as the 1980s or earlier. And then in 2016 they all flipped and that flipping was most significant there—of some additional interest to me are the counties in Maine, the Pacific Northwest, and along Lake Erie near Cleveland.
In short, this was just a brilliantly done map. And it sets the tone for the rest of the article, which is interviews with residents of those counties called out on the map.
Credit for the piece goes to Andrew Braford, Jake Crump, Jason Bernert and Matthew Callahan.
One thought on “Turning the Midwest Red”