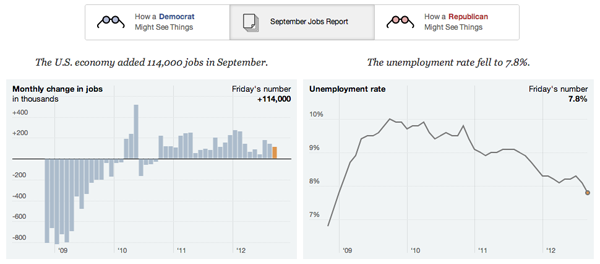
On Friday we received the monthly jobs report. And the furore that arose with it. Principally the anger stemmed from right-leaning commentators who believed that the non-partisan Bureau of Labor Statistics, a government agency tasked with collecting data on employment among other metrics, “cooked the books”/ “massaged the figures”/ flat-out lied to show a significant drop in the unemployment rate that could not be attributed to people who had stopped looking for work—a cause of some earlier drops over the last few years. As someone who works with data originally collected from national statistics offices across the world on a daily basis, those claims touched a nerve. But I shall leave that rant for another time.
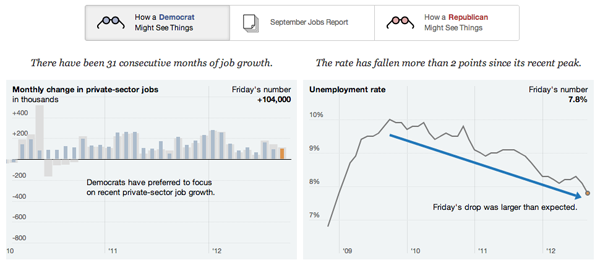
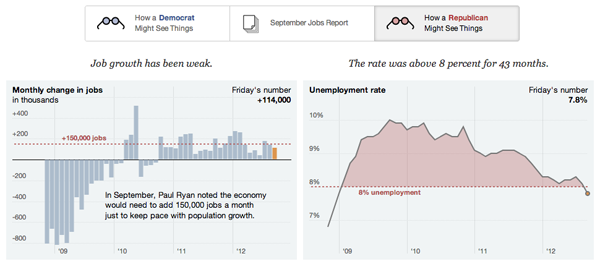
Instead let’s look at the New York Times piece that quickly followed on the outrage of fools. We can look at and analyse the data in different ways—the origin of the phrase lies, damned lies, and statistics—and surely the Republican and Democratic parties would do just that. They did. This New York Times piece shows how that can be—and was—done. It involves points of reference and context.
First the facts:

Then how the Democrats spin them:

Finally how the Republicans spin them:

But the facts themselves do not lie. 114,000 non-farm jobs were added to payrolls. The unemployment rate fell to 7.8%, the lowest rate since January 2009.
Credit for the piece goes to Mike Bostock, Shan Carter, Amanda Cox and Kevin Quealy.
