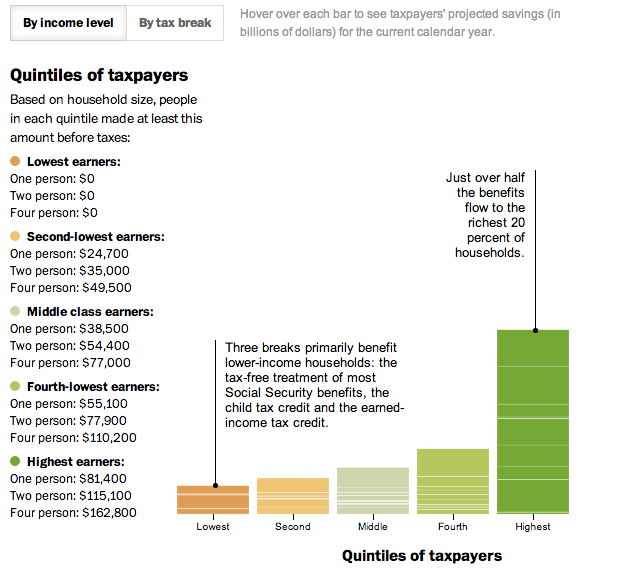
In today’s post we look at a small interactive piece from the Washington Post. Everybody pays taxes. And everybody seeks to find ways to pay less in taxes. This interactive stacked bar chart (and bar matrix) examines how much the different available tax benefits help Americans, grouped into income quintiles. The measure is dollars, not percentage of income (either personal or national), so clearly highest income Americans are the big winners in tax benefits while low income Americans lose out. For example, most low income people do not make enough money to invest in the stock market. Therefore they cannot reap the benefit of preferential tax treatment of dividend income as opposed to wage income.

Credit for the piece goes to Darla Cameron.
