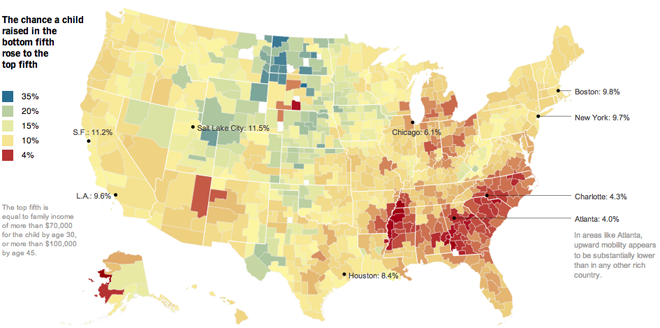
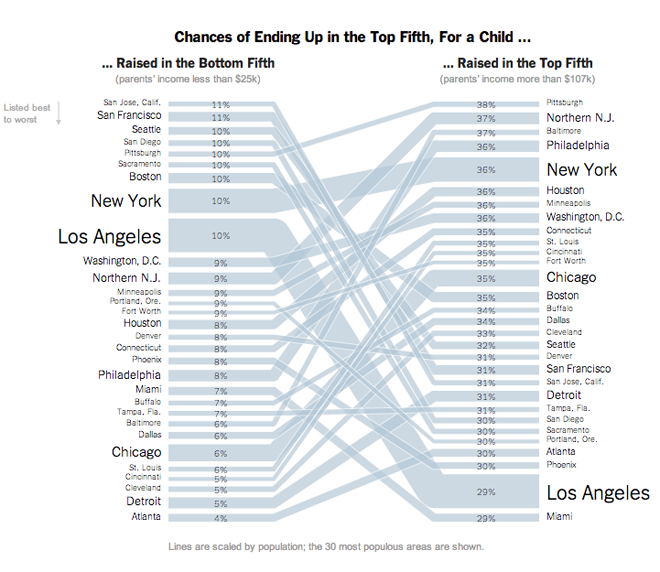
After two weeks out of the country, I come back and find early this morning (thanks, jet lag) an interactive article published by the New York Times on income mobility. What does that mean? From a medium side, a long narrative interspersed with charts and graphics with which the user can interact to uncover specific data about specific elements in the dataset. From a content side, income mobility means the movement of an individual from one group of money earned to another, e.g. a poor person becoming a millionaire. The piece is fantastic and you should take the time to go read and interact with it.

For some time now I have harped on about the need to annotate and contextualise datasets. Too often, large datasets paralyse people; their eyes glaze over and they simply gaze at a graphic without seeing the data, the story, the information. Little notes and blurbs of text can help people synthesise what they see with what they read with what they know to gain better understanding. But in this piece, by combining a lengthy article—very well written although that is not the focus of this post—with powerful interactive maps and graphics, the New York Times has created a powerful piece that states and then proves the point of the article. And while doing all of that, by making the datasets explorable, the Times also allows you to find your own stories.

Lastly, in the credits section at the end you will see this piece required the input of eight individuals (though I know not in what particular capacities). Clearly, for the Times this is not about to become a regular type of infographic/datavis/journalism piece. But when will skill sets be democratised or dispersed enough that smaller teams can create similar scale projects? That will be interesting to see. However, the Times certainly leads the States if not the world in some of the best information design pieces and undoubtedly this will push other publishers of similar content in this direction.

Credit for the piece goes to Mike Bostock, Shan Carter, Amanda Cox, Matthew Ericson, Josh Keller, Alicia Parlapiano, Kevin Quealy, and Josh Williams.
http://www.nytimes.com/2013/07/22/business/in-climbing-income-ladder-location-matters.html?smid=pl-share
