Back to the Iowa Caucus results for a moment. A lot of the day-of forecasting for elections is done by entrance and exit polls. So in this piece from the Washington Post, we take a look at entrance poll results. This is basically a two-parter. The first is showing each candidate and the group they won and a number indicates by how much they won the demographic group.

If you click on any of the demographic groups in particular, you are brought to the part of the page with the actual full results for the demographic. The format is simple a basic heat map with table. Nothing fancy, but nothing fancy is required for that type of data. Interestingly, the colour denotes not the share, but the result. I am not sure I would have done that, but it is a minor quibble.
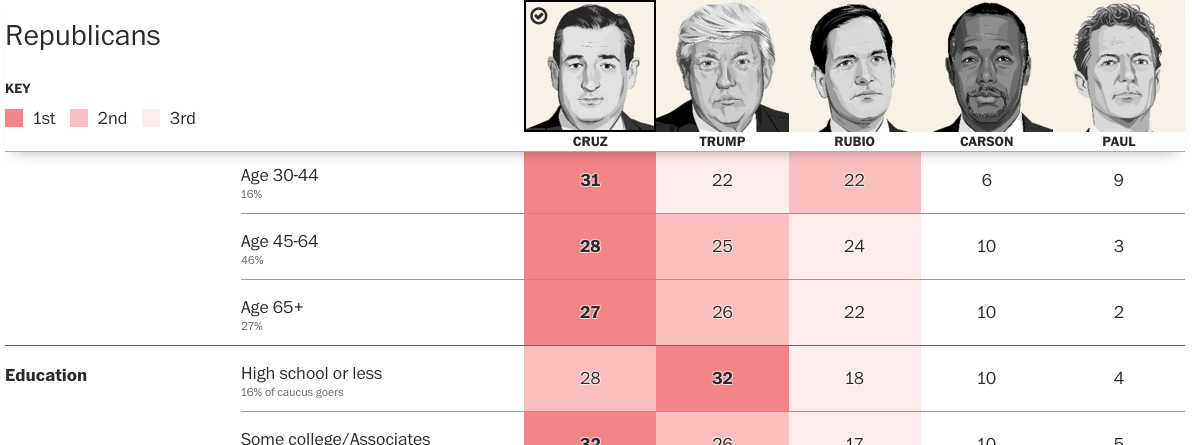
Credit for the piece goes to Lazaro Gamio and Scott Clement.
Leave a Reply
You must be logged in to post a comment.