On Saturday Ireland announced the results of a referendum on changing its constitution to remove Article 8, which had made abortion illegal except in the case of risk of death to the mother. And that was it, none of the usual rape or incest clauses. I want to look at a little coverage of the results and we will start with the Irish Times.
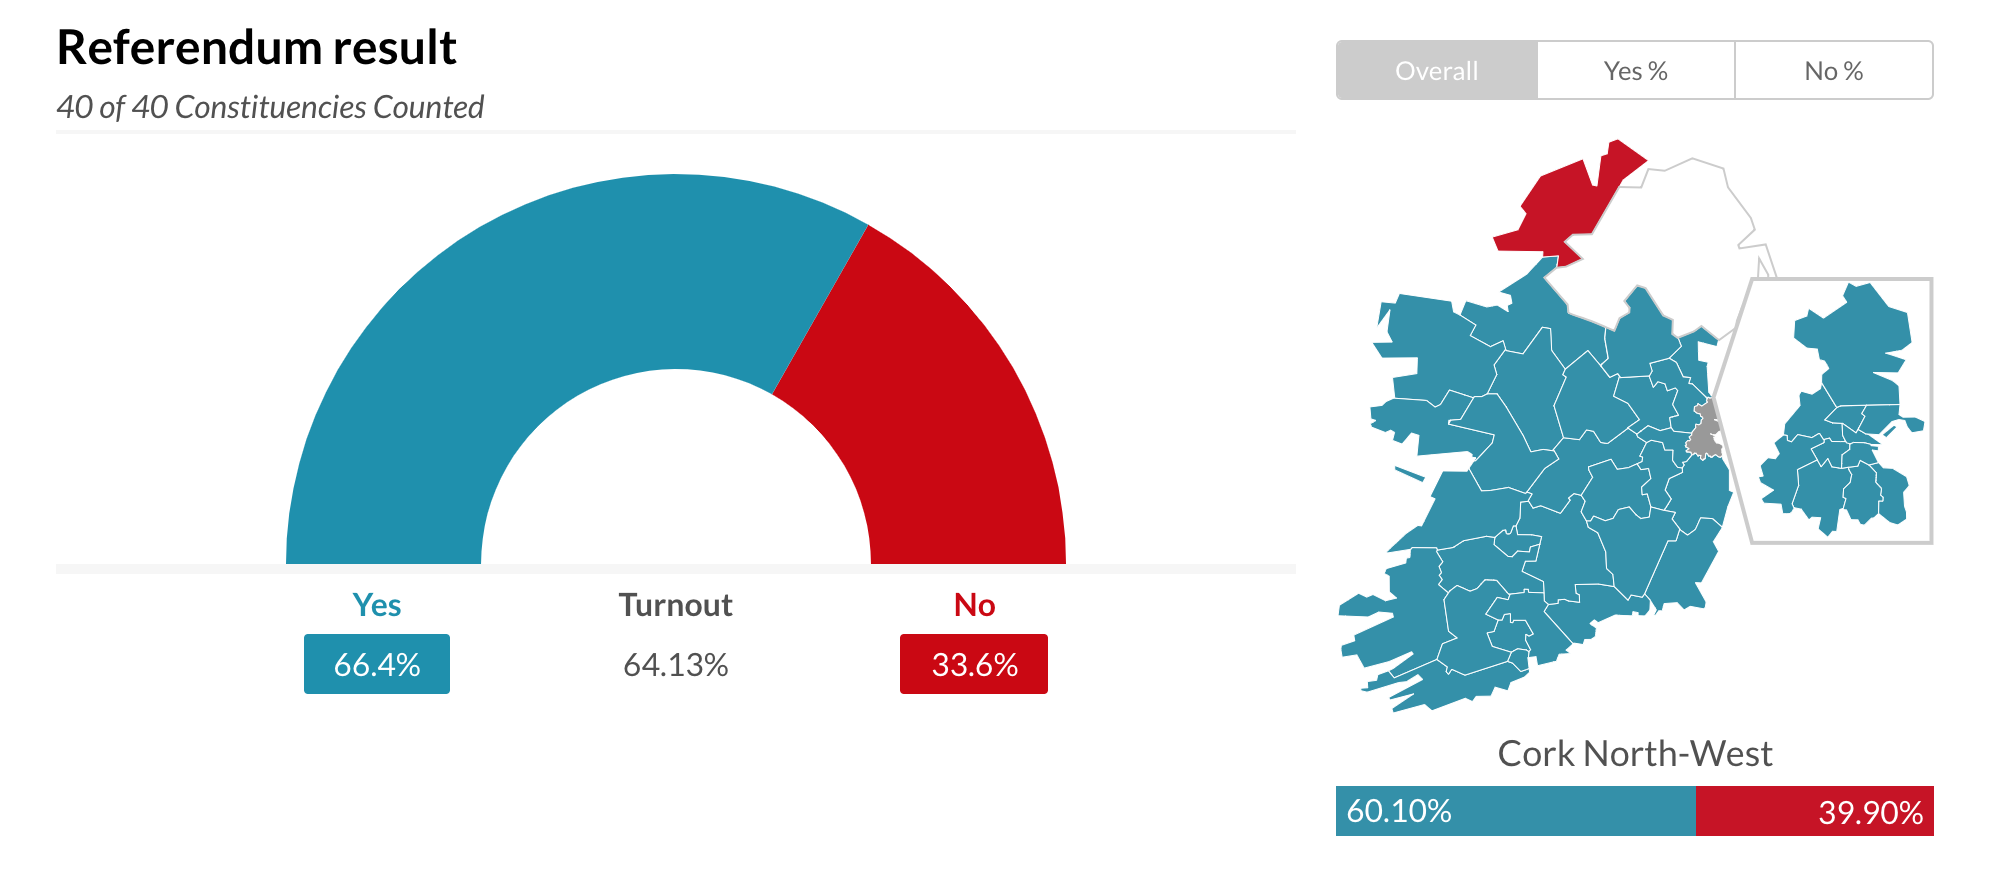
Their presentation is straightforward, a parliamentary-like slider and a small choropleth. All the colours link to each other and you will note that at first glance there is no variation in the colours on the map. Instead they present the binary choice, yes or no. To get the details of the vote, the user needs to select the Yes% or No%. From those we see not a lot of variation—probably not unsurprising given the overwhelmingness of the vote—as the Dublin area had the most yes, the rest of Ireland fairly solidly yes, and only Donegal in the northwest voting no, and even then, barely so.
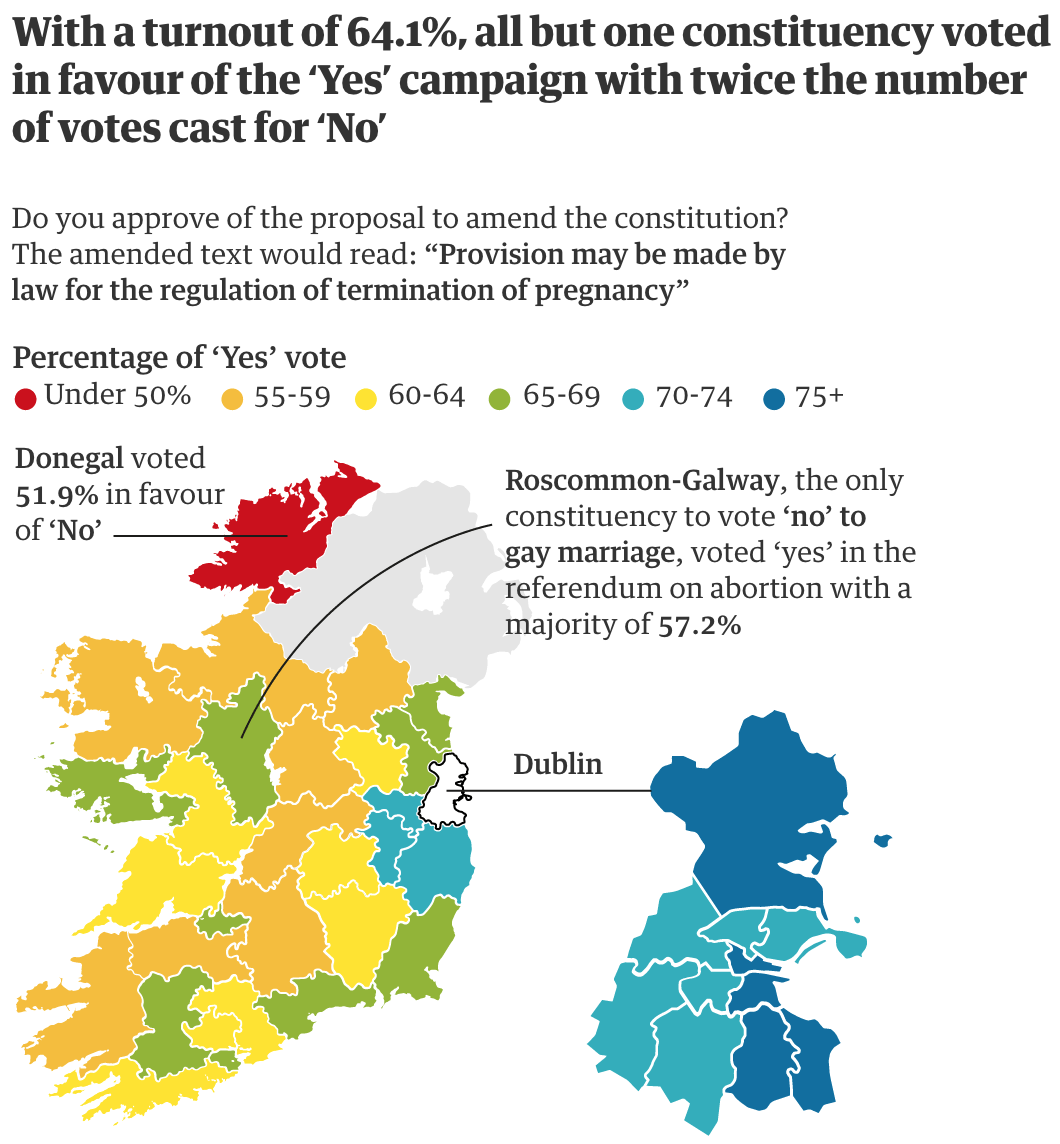
But then we have the Guardian’s results map. And I am a wee bit lost. The bin definitions offer a bit more granular detail and so the sweeping results from the Irish Times results can here be seen as a bit more simplified. I probably would have shifted the colours and kept the yes on one side of the spectrum and not mixed the yellows and oranges into the positive, or yes, side. The stunning part of the result was, after all, that only Donegal voted no. So I would expect the colour of the choropleth to reflect that sharp break and less the gradation seen here. It’s a curious choice.
But more importantly, I am left wondering about the data, the titles, or the descriptions—I cannot be sure. The key bit is the callout of Roscommon-Galway. The text says the constituency voted 57.2% yes. But the colour would seem to indicate that it voted 65–69% no. A simple mistake? Perhaps. But then I look at the wording of the legend and maybe not. Could percentage of yes vote mean something more like the expected total or the percentage of registered voters? Probably not, but I cannot quite figure out what is going on in Roscommon-Galway. And if it is a data error, it is only made more noticeable because they point out that is one of only two constituencies described in the text.
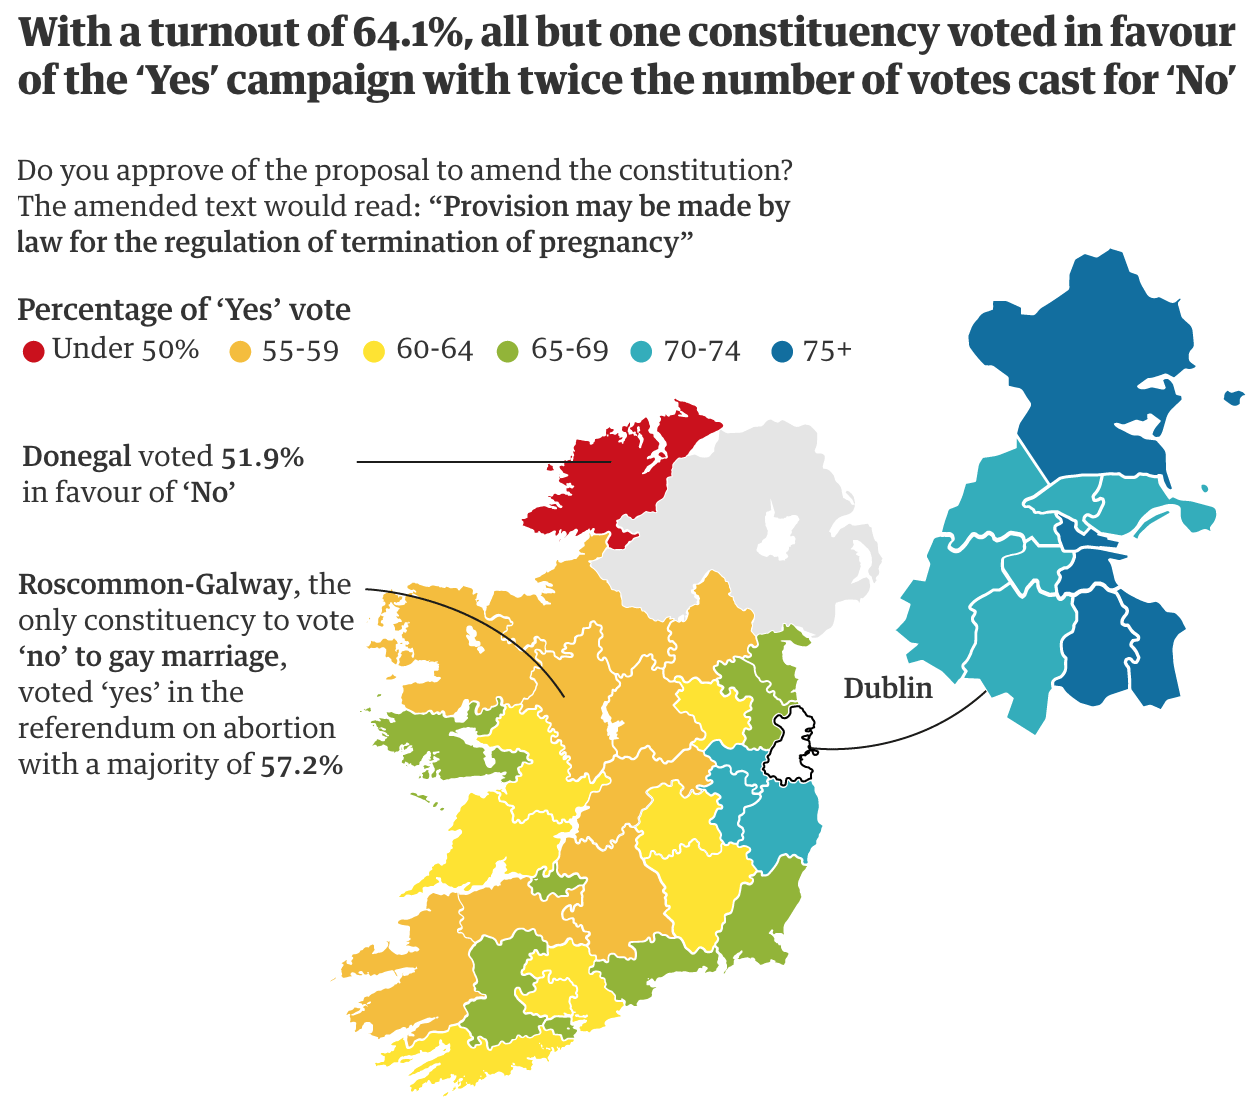
Post script: After writing this and doing some more investigation over the long holiday weekend, I found a different map that appears to be more in sync with the results. The above was probably a mistake that just didn’t get pulled down and replaced. Below is the correct one. But it goes to show you how an incorrect graphic can cause confusion.
Credit for the Irish Times piece goes to the Irish Times graphics department.
Credit for the Guardian piece goes to the Guardian graphics department.
Leave a Reply
You must be logged in to post a comment.