The World Cup has had some impressive matches and some stunners. (And the two are not mutually exclusive.) But if you are like me and have to work during most of the broadcasts, how can you follow along? Well thankfully FiveThirtyEight put together a nice statistical model that provides the probability of a team winning—or drawing—in real time.
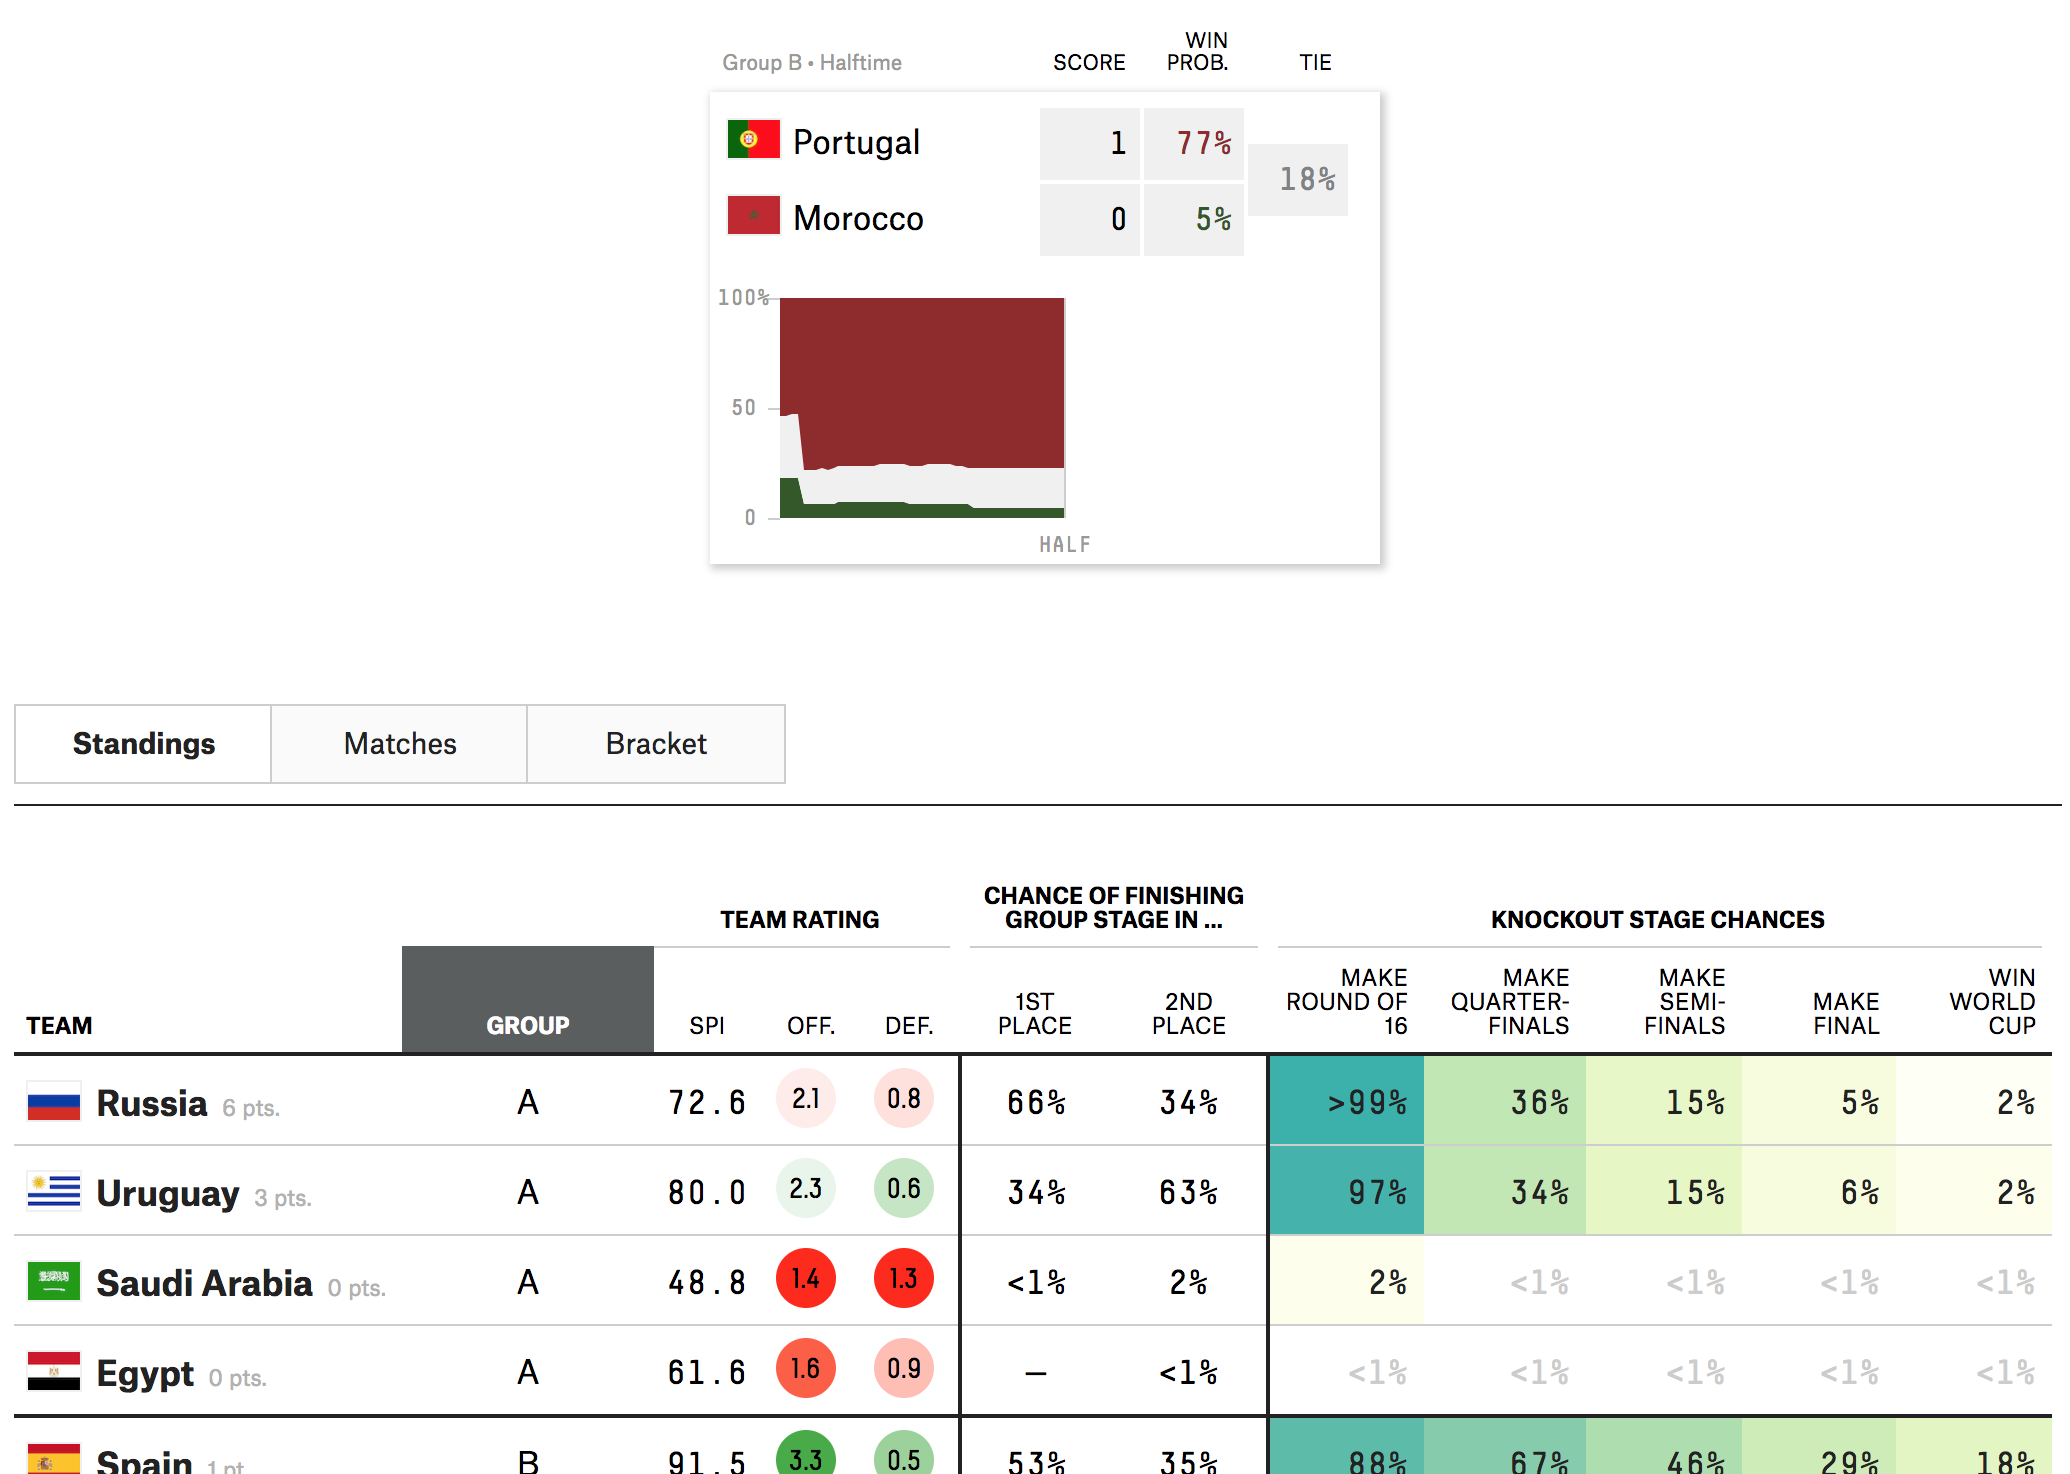
The design is fairly simple: a small table with the score and probability followed by a chart drawn as the match goes on. (Clearly I took this image at the half.)
I included a snippet of the table below to show the other work the FiveThirtyEight team put out there. You can explore the standings, the screenshot above, as well as the matches and then the brackets later in the competition.
The table makes nice use of the heat map approach to show is likely to make easy of the different stages of the competition. Like I said the other day, they are high on Brazil, because Brazil. But a little lower on Germany. But never count Germany out.
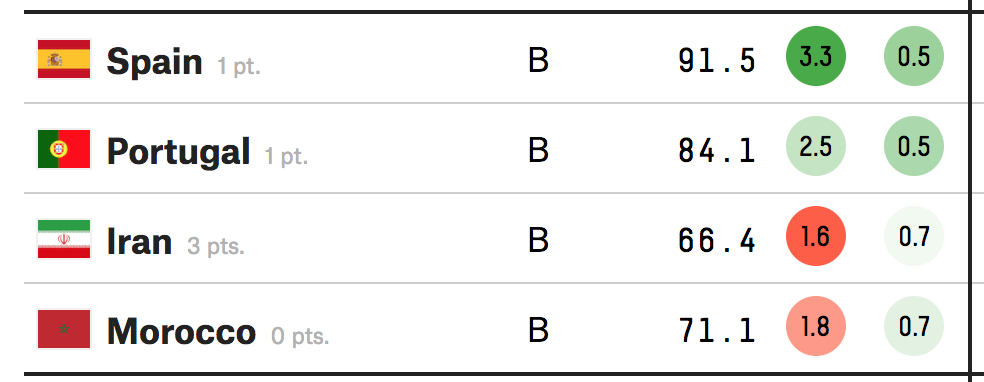
The only unclear thing to me in the table? The sorting mechanism. In Group B, at least whilst the Portugal match is ongoing, should probably have Iran at the top. After all, as of writing, it is the only team in the group to have won a match. The only thing I can guess is that it has to do with an overall likelihood to advance to the next round. I highly doubt that Iran will defeat either Spain or Portugal. But as with many knockout-style championships, anything can happen in a single match sample size.
Credit for the piece goes to Jay Boice, Rachael Dottle,Andrei Scheinkman, Gus Wezerek, and Julia Wolfe.
Leave a Reply
You must be logged in to post a comment.