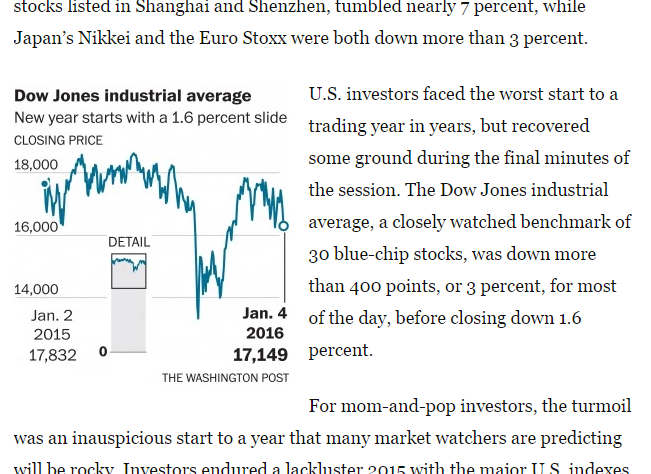
Today we are looking at a smaller piece from the Washington Post. The graphic fits within an article about US stock prices. What the graphic does is show the total scale, i.e. starting the chart on the 0 axis, and then showing in detail the fluctuations near the maximum end of the scale. And yet all of this done as an inset graphic. It need not be a full-width graphic, because the data does not demand it.
Credit for the piece goes to the Washington Post graphics department.
Leave a Reply
You must be logged in to post a comment.