
Okay, so we’re going to post some more of my work today, but it’s not about cases and deaths. Instead, I took some data produced by my colleagues and thought that it could do for a small transformation from a table into a chart. The original table can be found in their report on consumer payment options during the Covid-19 pandemic.
After setting the kettle on for some tea this morning we started on their Table 1. Thirty minutes later and a cup of Irish Breakfast consumed, I had transformed it into this:
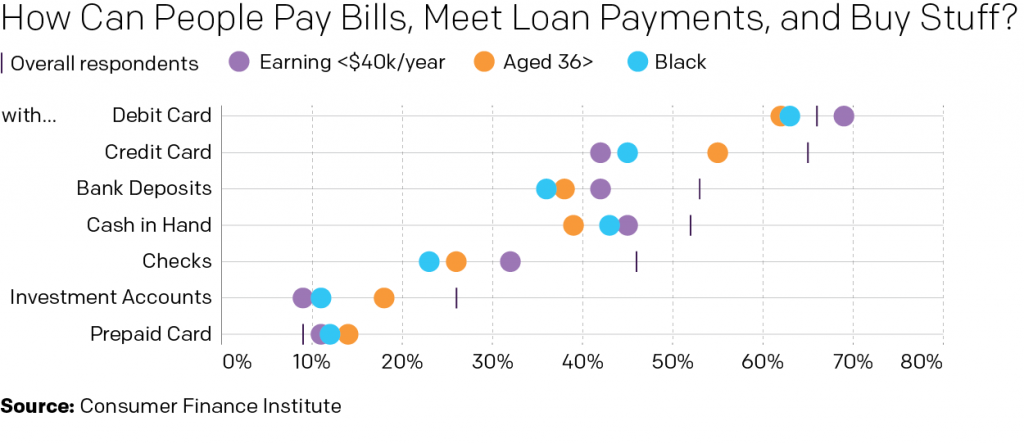
Obviously I changed the language/title a little bit. But the original was too long and didn’t fit. Also this is my blog, so my rules. The visualisation improves upon the table in a number of ways, but tables do have their place. Tables are great for organising information. Find a column header and a row header and you can get any specific data point. But, if you want to make a comparison between two data points or several of them, a chart is the way to go. Now, you may lose some precision. For example, do I know to the decimal point or to the tenths even what one of those dots represents? Nope. But at a glance, can I see which dots are below the overall respondents? Yep. It’s abundantly clear that those earning less than $40,000 per year have a greater availability of debit cards than the other groups shown.
And after all, I couldn’t have made this graphic without that table.
Full disclosure, as alluded to above, I work at the Federal Reserve Bank of Philadelphia. But I had nothing to do with the data, report, or presentation thereof.
Credit for the graphic is mine. The data to the folks over at the Consumer Finance Institute.
One thought on “Consumer Payment Methods During the Corona Times”