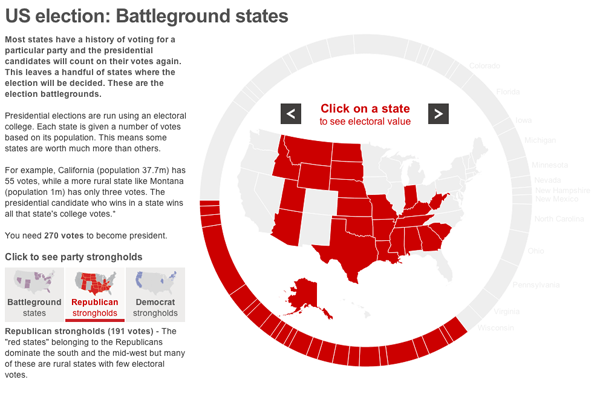
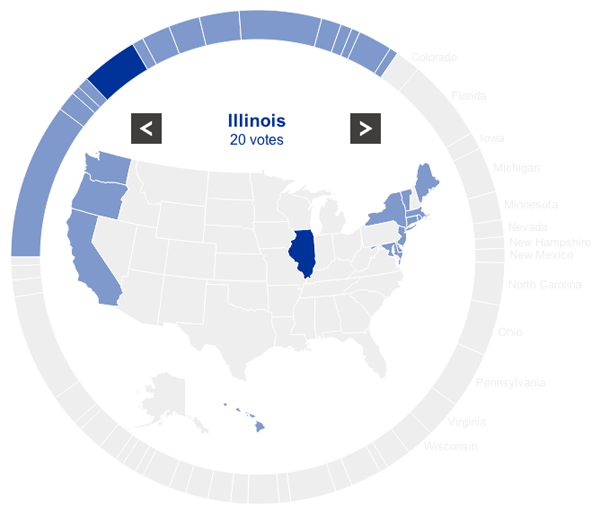
The BBC provides an interactive tool to explore the battleground states in the forthcoming election. A giant donut chart with 50 segments maps a segment to a state and its total number of electoral votes. The larger the electoral vote, e.g. California, the larger the segment. Beyond just a giant chart, however, the BBC has placed the states into different camps, the Democrats, the Republicans, and the Battleground states.

Selecting either the Democrat strongholds or the Republican strongholds highlights the states for each respective party. Not a lot of functionality is to be had. Clicking on a state merely displays its name and number of votes. But this is not the main function of the piece.

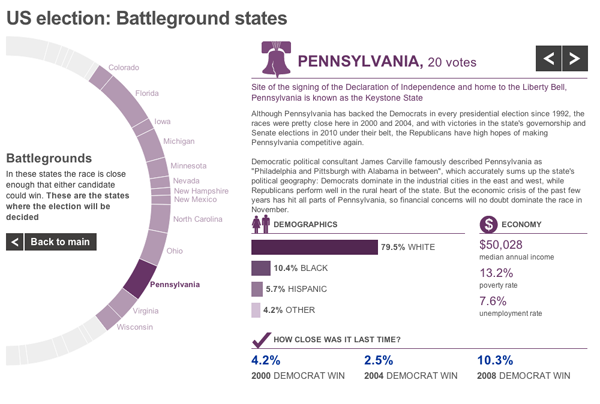
The main goal of the piece is to explore the Battleground states. When the user selects one, he or she is presented with a new view that moves the chart partially off-screen—while keeping the Battlegrounds in view—and moves a profile piece on-screen. This view contains both a text summary of the state and its challenges along with important demographic statistics.

For an American audience, there is probably little to be gained from the piece unless one is wholly unfamiliar with American politics. But for the more international part of the BBC News audience, this piece gives them quick insights into the various states that will be so important over the course of the next few months.
