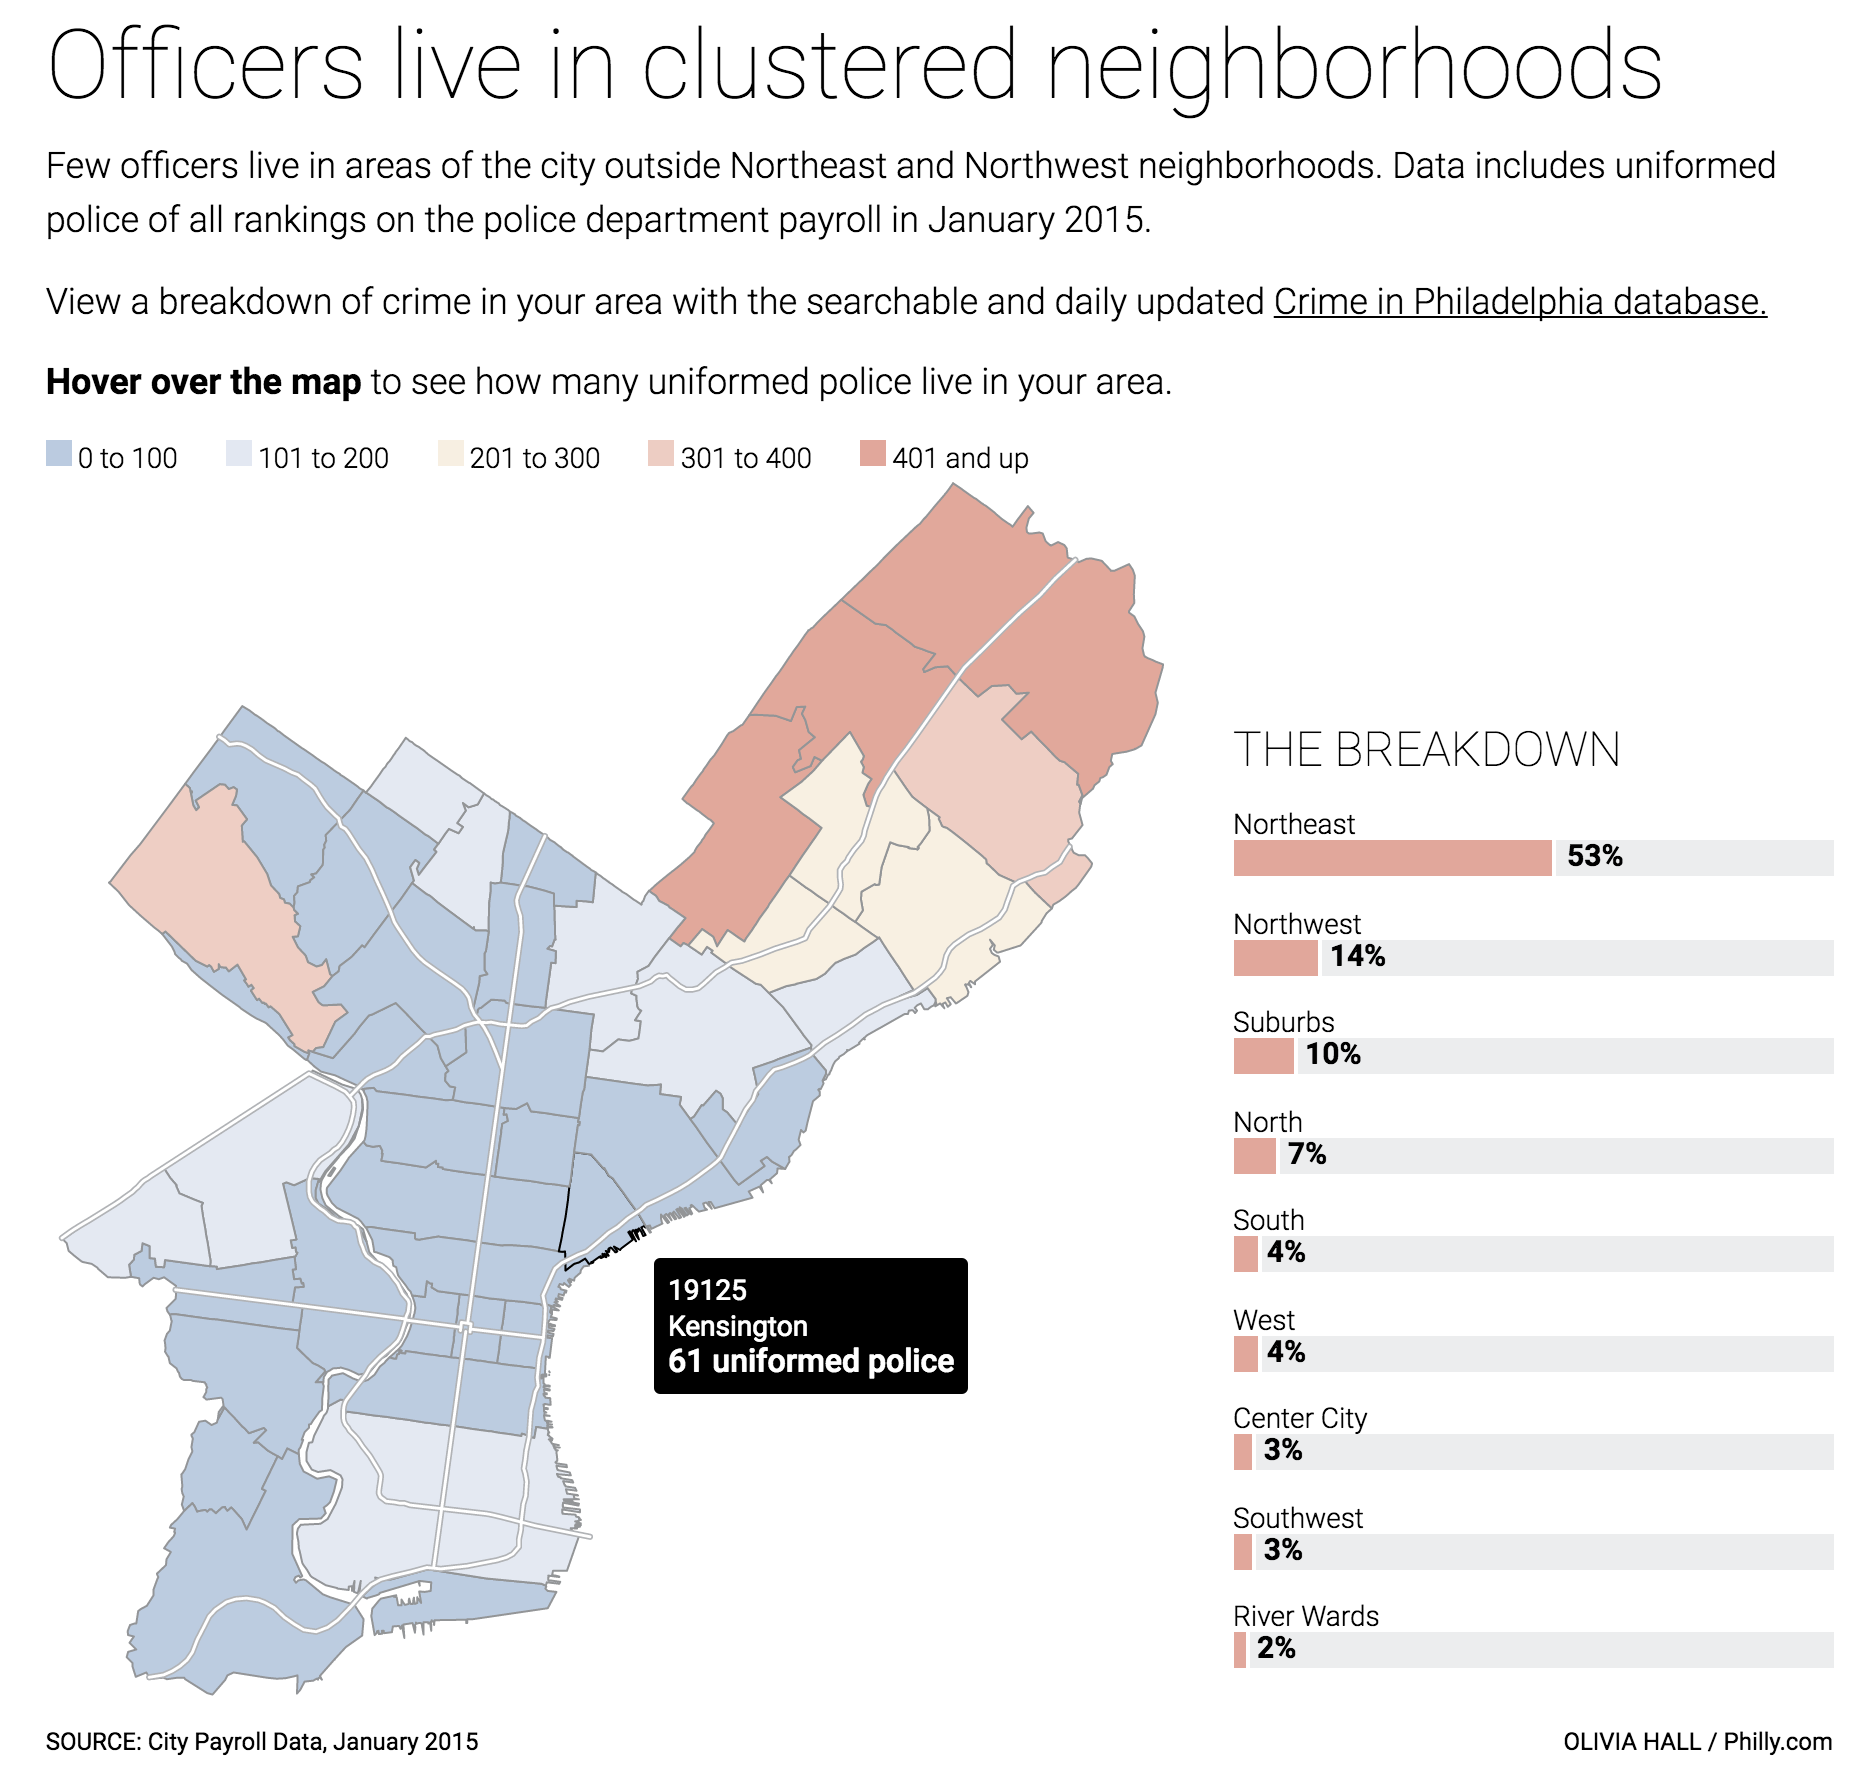
I am on holiday for a few days and am visiting Philadelphia. So what better time to cover some Philadelphia-made content? This interactive piece came out last year from Philly.com alongside coverage of the Philadelphia mayoral contest.

I want to call out the colour palette for the choropleth in particular. We can see a blue to red system with a stop at yellow in the middle—a divergent palette. With this kind of a setup, I would expect that yellow or the light blue to be zero or otherwise straddle the point of divergence. Instead we have dark blue meaning 0 and dark red meaning 401+. The palette confuses me. It could be that the point of divergence—something around the 200 number—could be significant. It could be the city average, an agreed upon number for good neighbourhood relations, or something. But there is no indication of that in the graphic.
Secondly the colour choice itself. I often hesitate using red (and green) because of the often-made Western connotation with bad. Blue here, it works very well with the concept of the thin blue line, NYPD blue, blue-shirted police. If we assume that there is a rationale for the divergent palette, I would probably place the blue on the high-end of the spectrum and a different colour at the negative end.
Lastly, from the perspective of the layout, Philly has a weird shape. And so that means between the bar chart to the right and the city map on the left the piece contains an awkward negative space. The map could be adjusted to make better use of the space by pointing north somewhere other than up.—why is north up?—to align the Delaware River with the bars. Or, the bars could abut West Philly.
The interactions, however, are very smooth. And a nice subtle touch that orients the reader without distracting them is the inclusion of the main roads, e.g. Broad Street. The white lines are sufficiently thin to not distract from the overall piece.
Credit for the piece goes to Olivia Hall.
