Well the 2017 season ended yesterday afternoon for my Boston Red Sox as we lost 5–4 to the Houston Astros and they took Game 4 of the ALDS. So this morning we will surely see the critiques and hot takes on what to do to improve the team begin to make the internet rounds.
But before we get into all of that, I wanted to take a look at the 2017 season from a data perspective. At least, the regular season. After all, we can see how Sale in Game 1 and Kimbrel in Game 4 just had poorly timed bad days. But what about the other 162 games? After all, we will need to win a lot of them if we want to make it back to the playoffs in 2018.
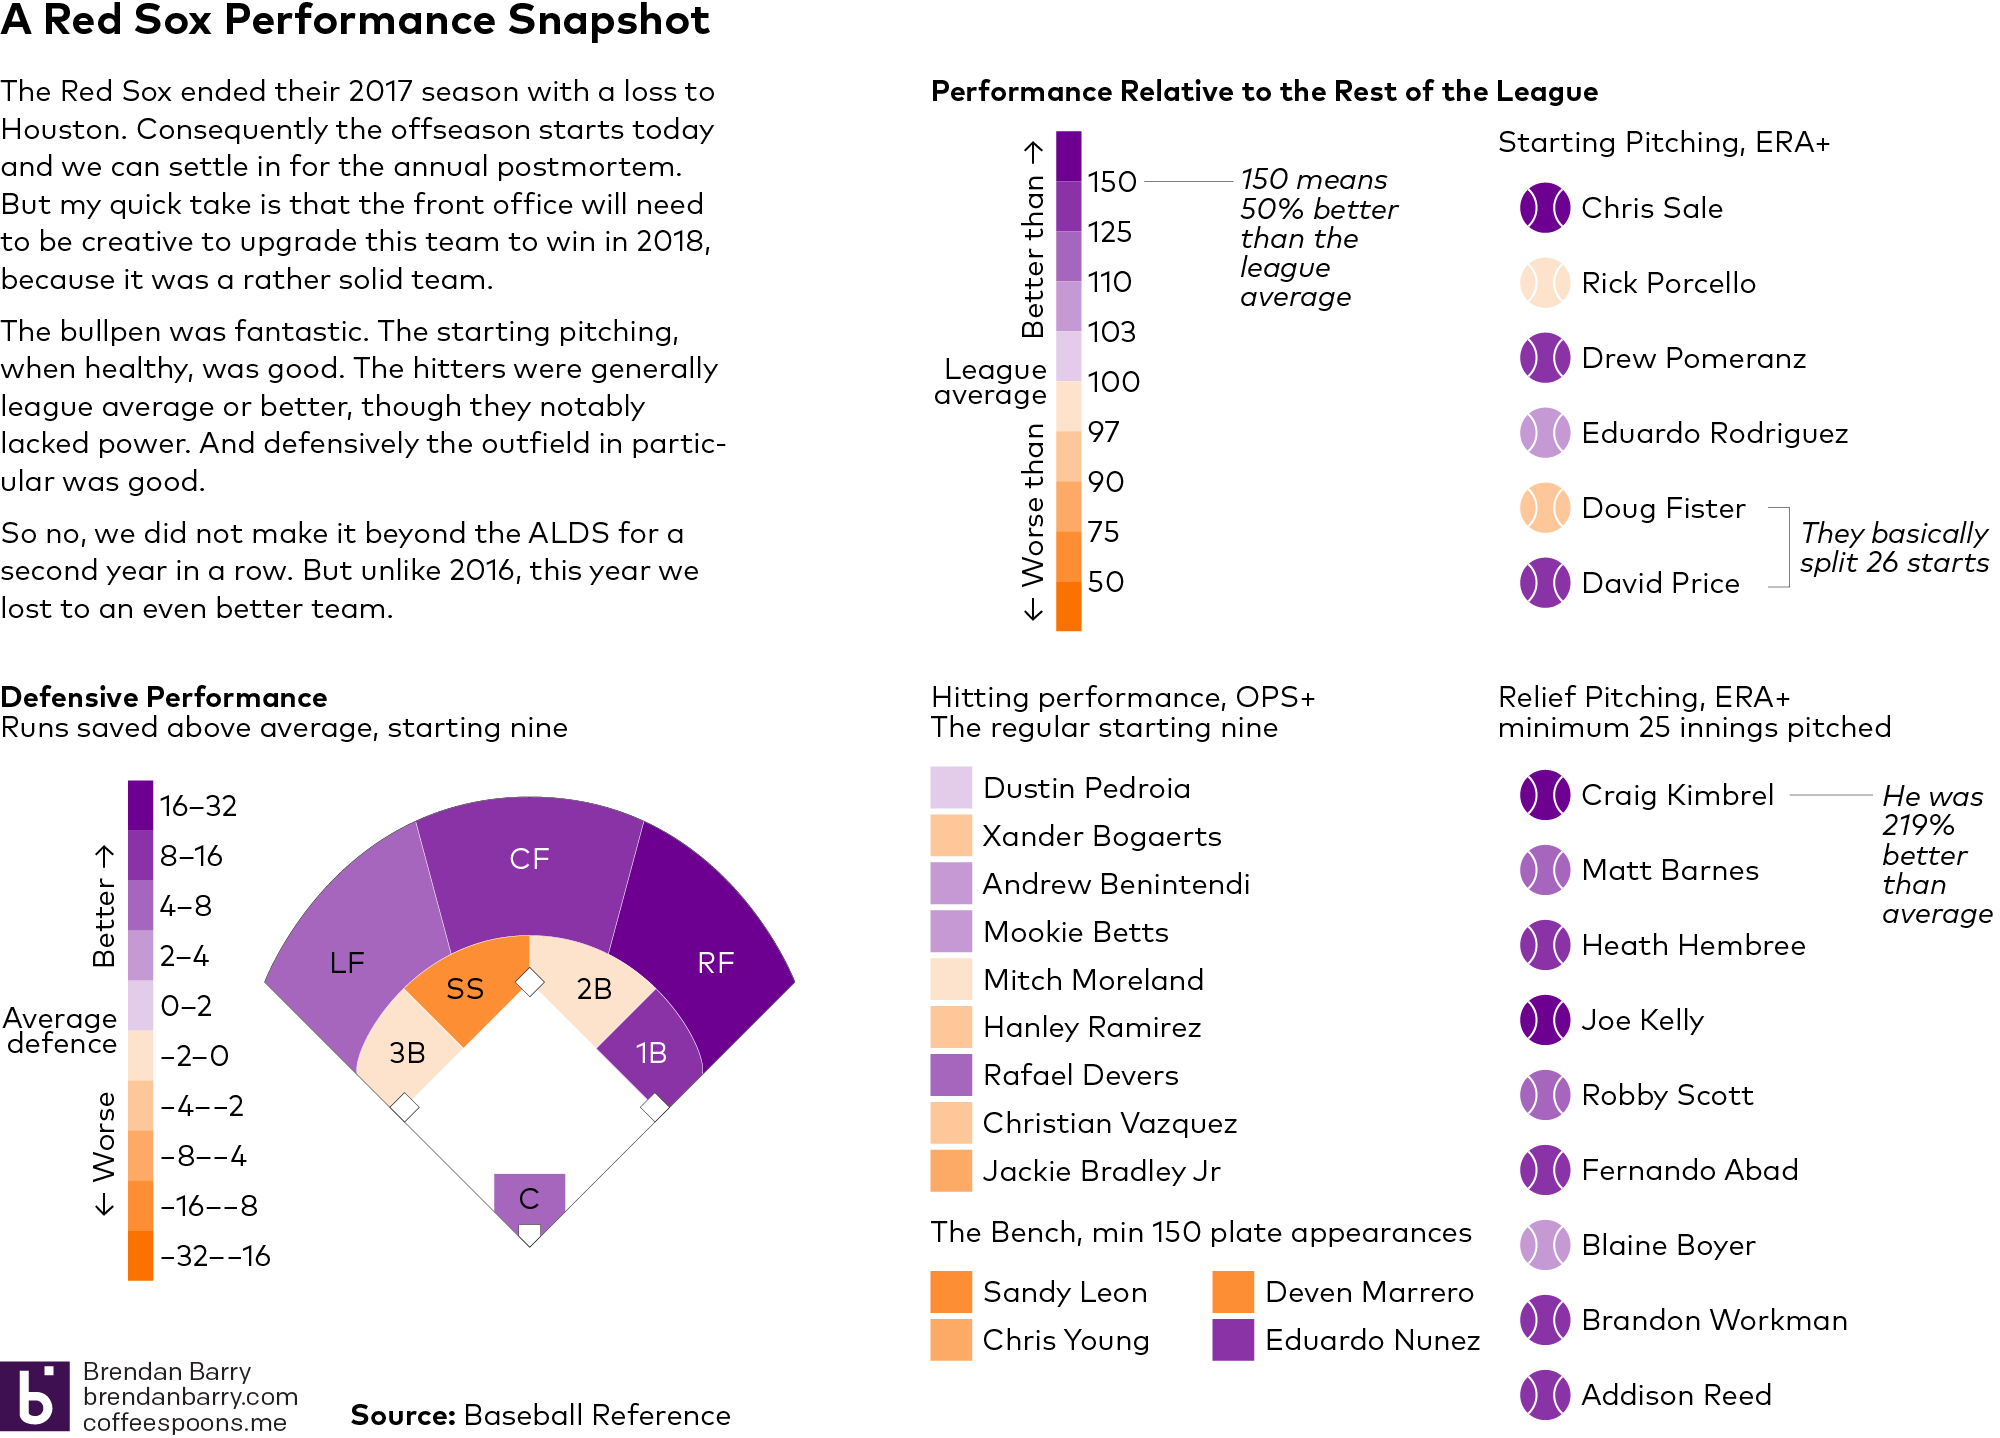
I just pulled a couple quick stats from Baseball Reference. Now we can quibble about which stats are best another time, but from my experience the more sabremetric datapoints are lost on a general audience. So here we are using OPS, basically a hitter’s average combined with his power/slugging ability, and ERA, the amount of runs a pitcher can be expected to allow every nine innings. I also threw in defensive runs saved above average, i.e. is the player saving more runs than an average player.
You can read the graphic for the details, but the takeaway is that Boston, we need not panic. The 2017 Red Sox were a good team. Far from perfect—here is looking at you lack of middle-of-the-order power—but a solid lineup, good rotation, good defence, and a fantastic bullpen. How can we add without subtracting too much?


One thought on “A Brief Review of the Boston Red Sox Season”