My initial plan for today was that I was not going to run anything light-hearted and focus instead on next week’s elections. But I still love xkcd so I checked that out and…well, here we go.
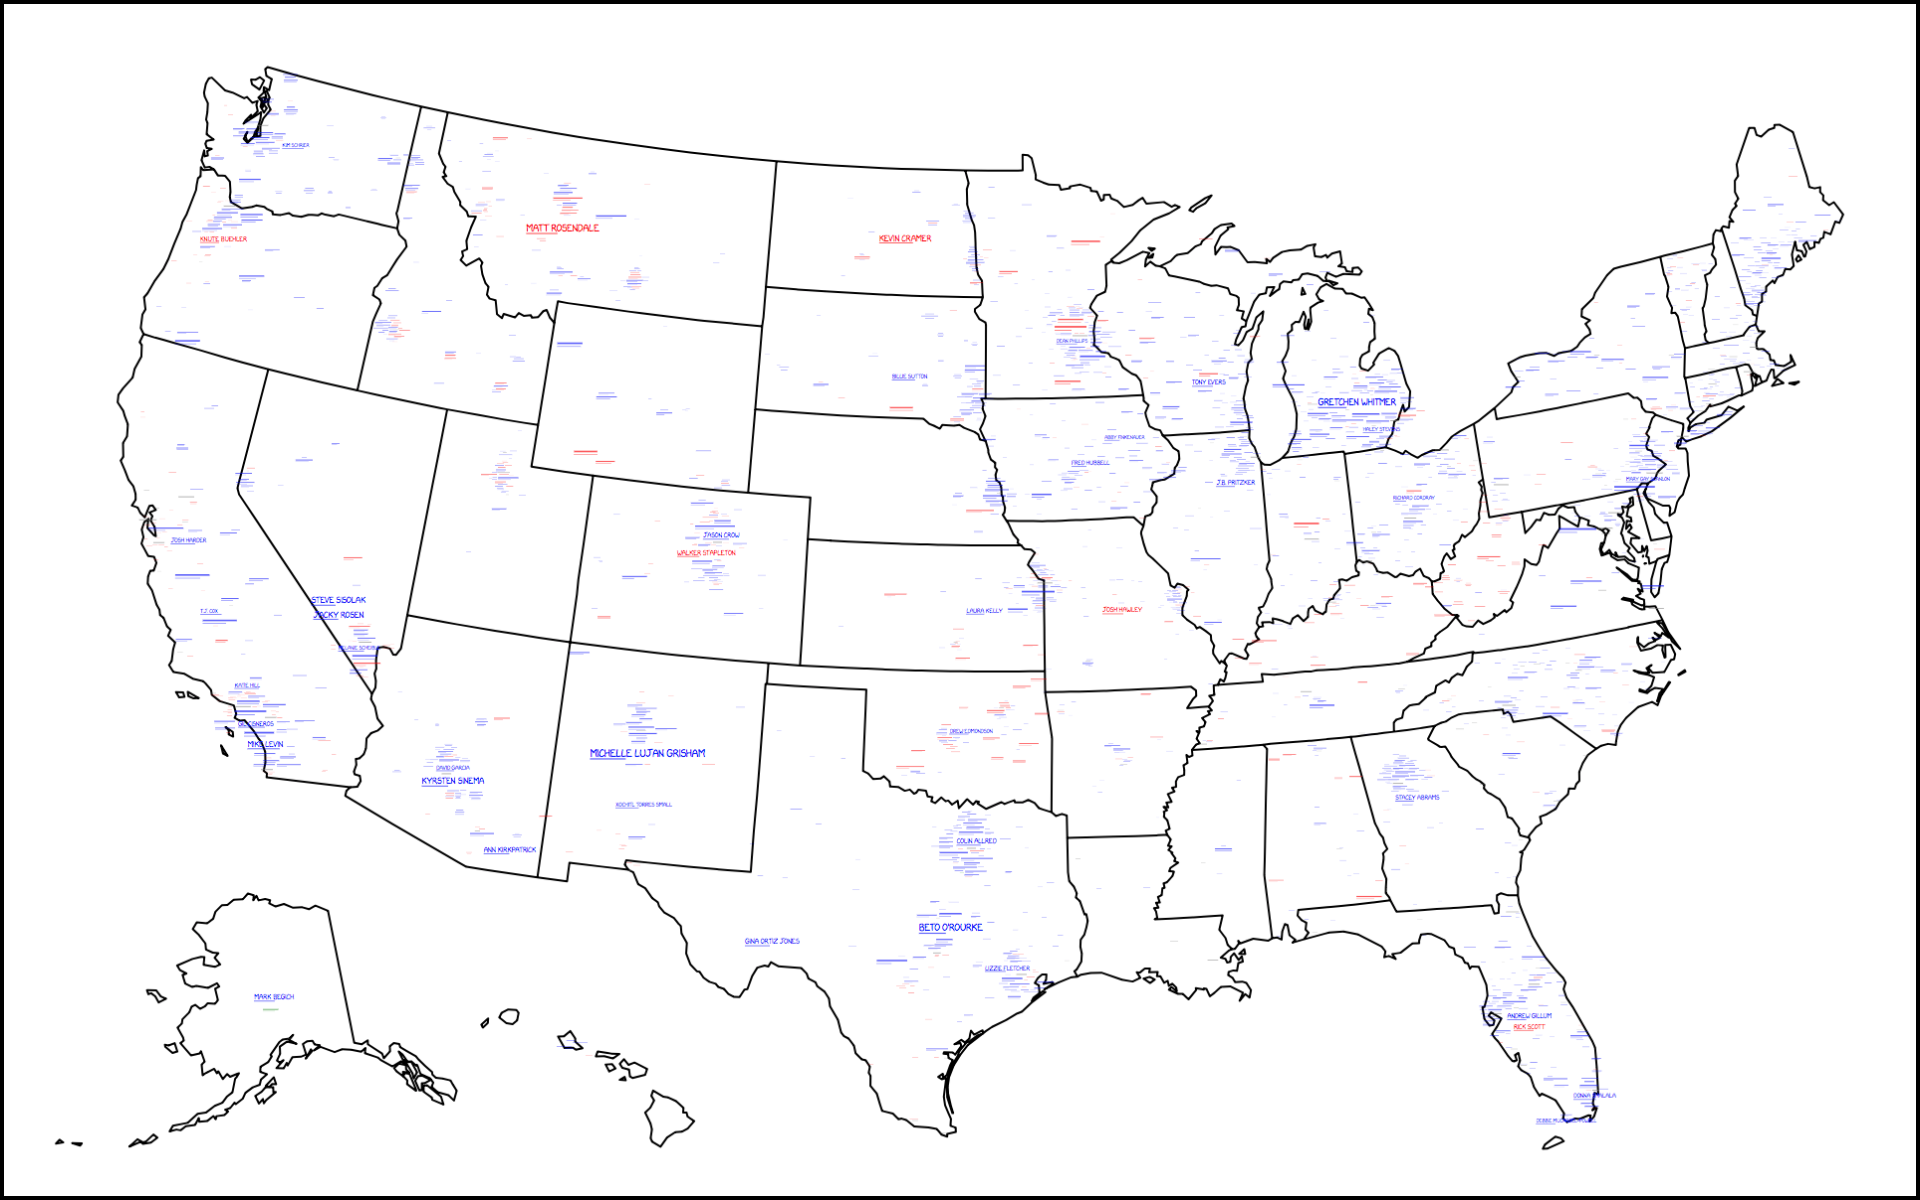
At the broadest view, much is unintelligible on the map. But, you can see a lot of blue, or in other words, there are a lot of Democratic challengers to a Republican House, Senate, and state governments. That’s right, it’s also covering state races, e.g. gubernatorial races. But at this level, the difficulty is in seeing any of the details.
The one problem I had with the map was the zoom. On a computer you can double-click or mouse scroll for the zoom, but I was looking for little buttons. Admittedly it took me a few moments to figure it out until I moused over the map to get the tooltip, which of course provided the instructions.
Once you zoom in, however, you can see the details of the map. This here is focused on southeastern Pennsylvania.
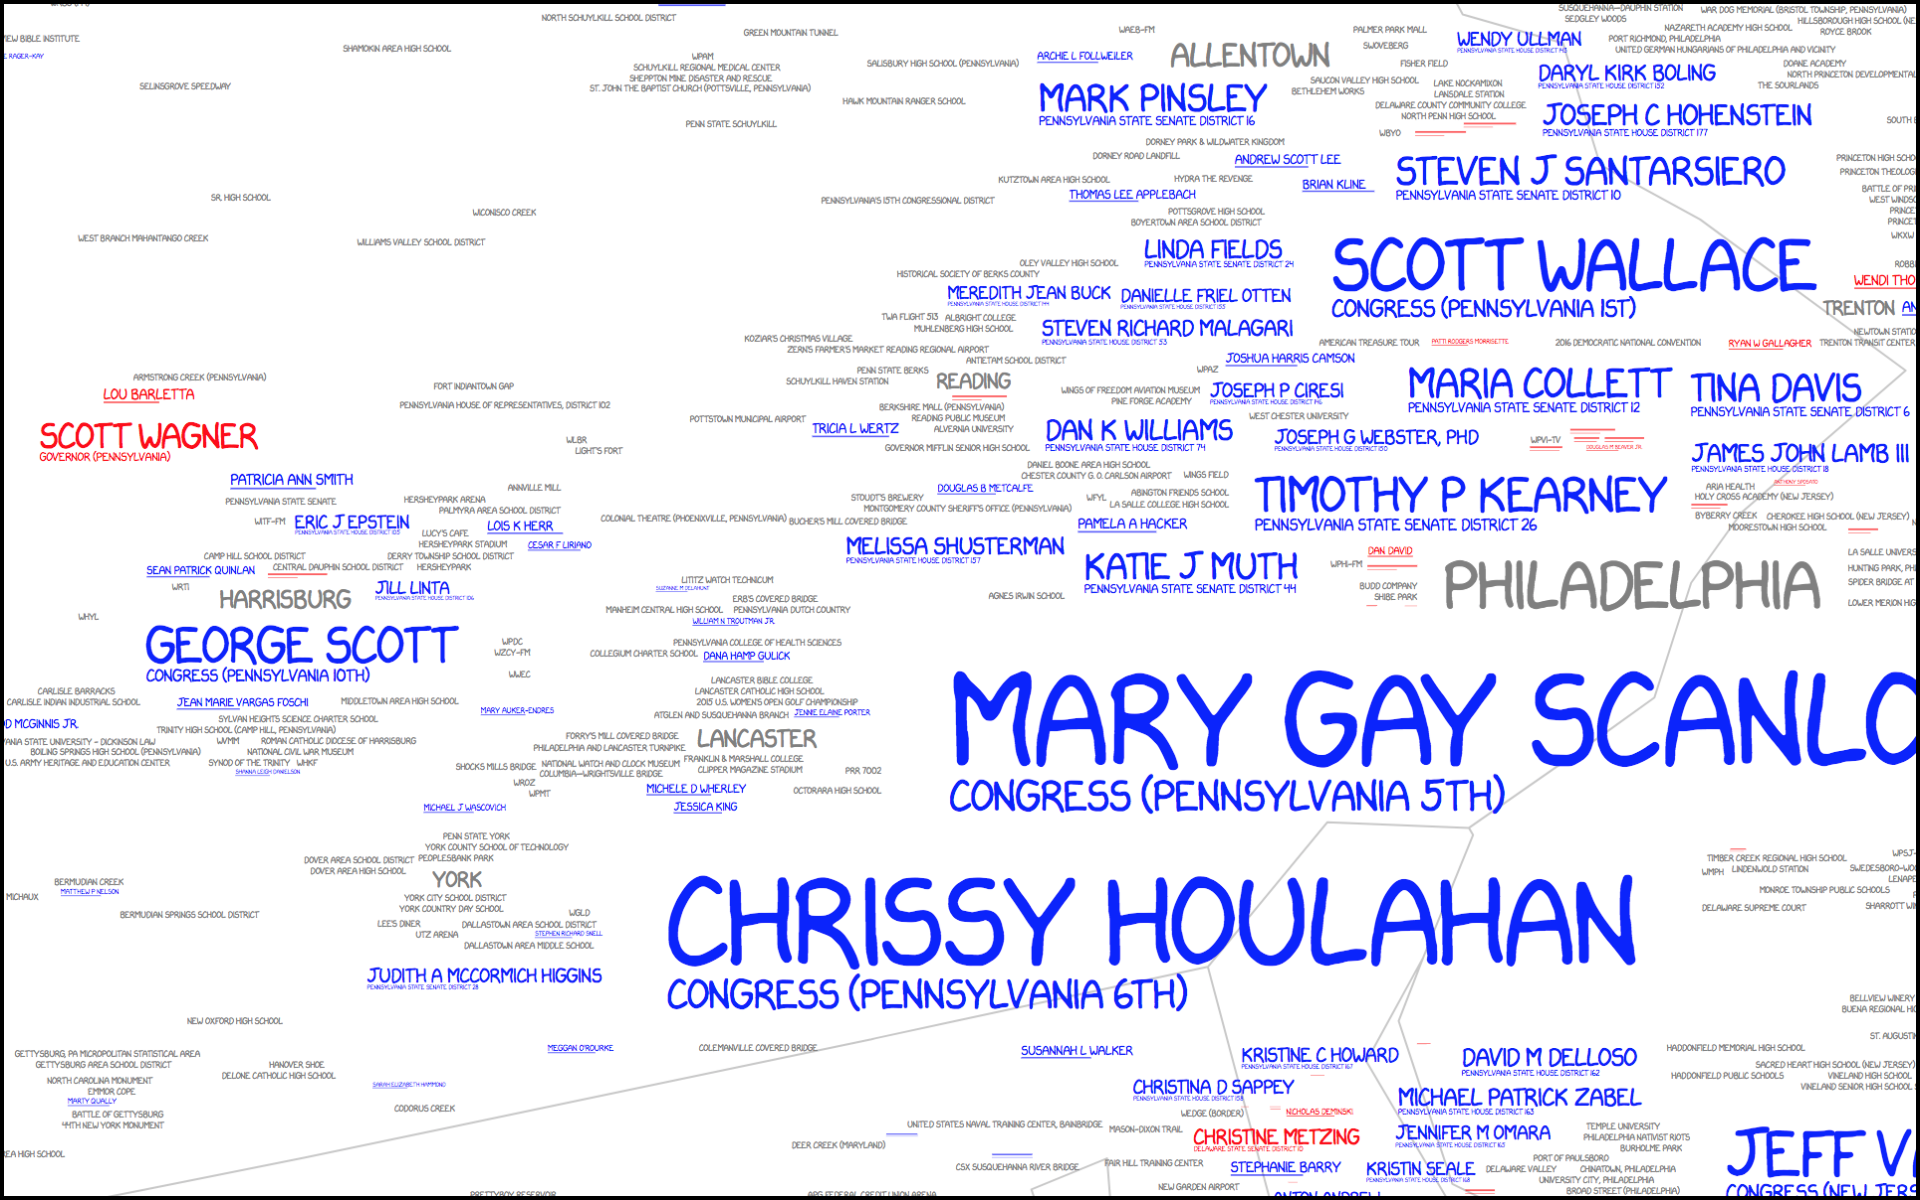
The key to the map is an interesting mix of values as the typographic size of the candidate is related to both their odds of success as well as the importance of their office. So in this view we can see an interesting juxtaposition. Chrissy Houlahan and Mary Gay Scanlon, for example, are running for suburban Philadelphia congressional districts. However, Scott Wagner is running for the arguably higher office of Pennsylvania governor. But his name is fairly small compared to the two women. And just above Scott? Lou Barletta. He is running for one of Pennsylvania’s two senate seats, challenging incumbent Bob Casey Jr. Clearly neither is forecasted to have great success whereas Houlahan and Scanlon are.
Of course the map lacks a scale to say what represents breakeven odds. It is also difficult to isolate the degree to which a level of office influences the size of a challenger’s name. That makes the map less useful as a tool for looking at potential outcomes for Tuesday.
The tooltip that revealed the instructions, however, also had one more big tip. If you found the map needed an update, the instructions were to submit your ballot on 6 November.
Anyway, this is just a reminder to find your polling place over the weekend and get prepared to vote on Tuesday. In the meantime, have a good weekend.
Credit for the piece goes to Randall Munroe, Kelsey Harris, and Max Goodman.
Leave a Reply
You must be logged in to post a comment.