The last time we checked in on Covid-19 in the states of Pennsylvania, New Jersey, Delaware, Virginia, and Illinois, things were peaking across the five states. As I said then:
If you look at the very tippy tip top of the curves in the other four states, we might just be seeing an inflection point.
And in the month since, my highly scientific term of “tippy point” appears to have been correct. New cases did begin to drop and by the start of the Christmas holiday we began to see real improvement. I should point out that deaths continued to rise, however, but we should expect that because deaths lag new cases by sometimes as many as four to six weeks.
So how are things now, a month hence?
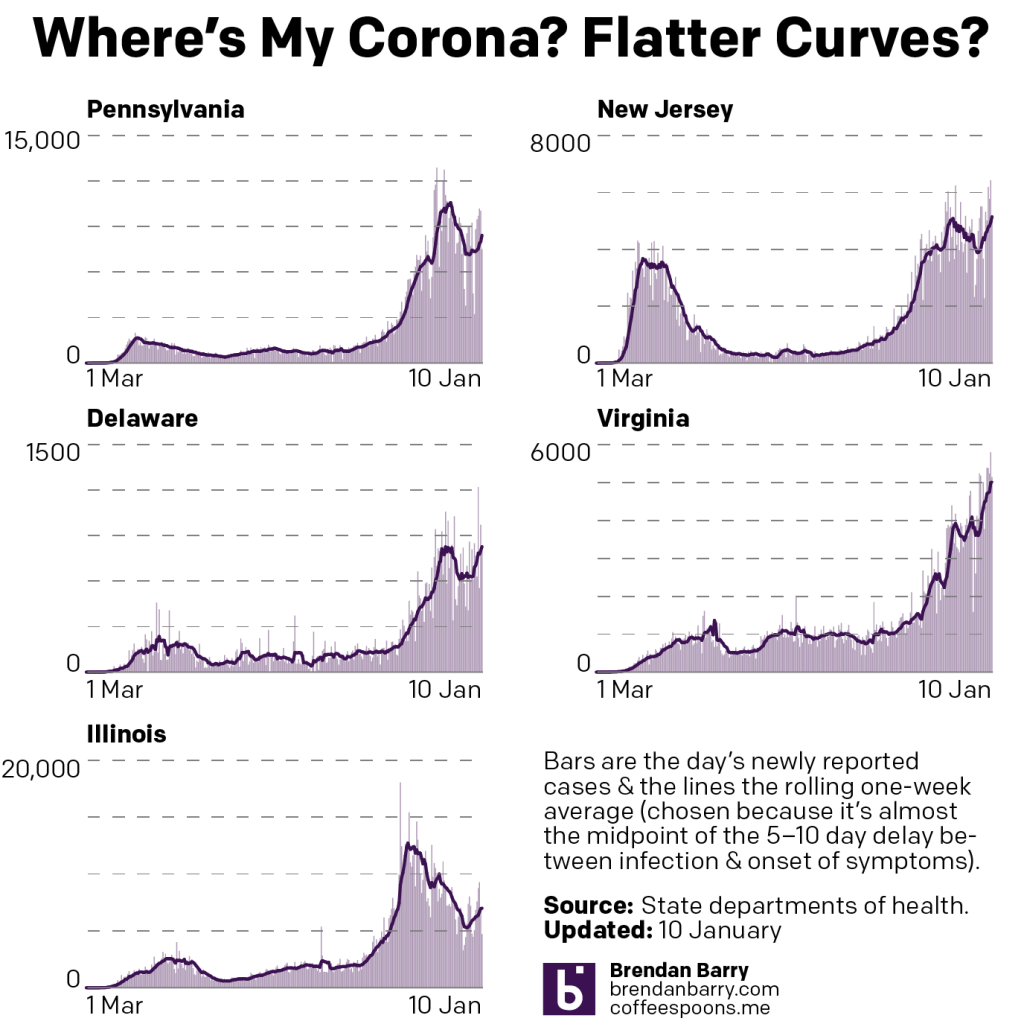
Well as you can see with new cases, not great and getting worse. Pennsylvania, New Jersey, Delaware, and Illinois all bottomed out prior to the holidays, and since then have been rising. It speaks to a surge in new cases likely caused by gatherings centred on the holidays.
The good news—if you can call it that—is that in Pennsylvania and Illinois, whilst cases rebound, they have not yet reached their mid-December peak in Pennsylvania and mid-November peak in Illinois. It’s worth pointing out that Chicago and separately Illinois instituted lockdowns earlier than the other four states prior to the holidays. That may account for the more dramatic reduction in those states.
The bad news is that in New Jersey and Delaware, the rebounds have now surpassed the peaks we saw in mid-December and cases continue to climb with new daily records pointing towards escalation of new cases in those states.
But the really bad news is in Virginia, where the inflection point was there—note the little mini “W” at the top of the chart—but that new cases declined neither significantly long nor in significant numbers such that there was no real holiday decline. Instead, at best we could describe it as numbers paused for two weeks before resuming their upward trends.
How about deaths?
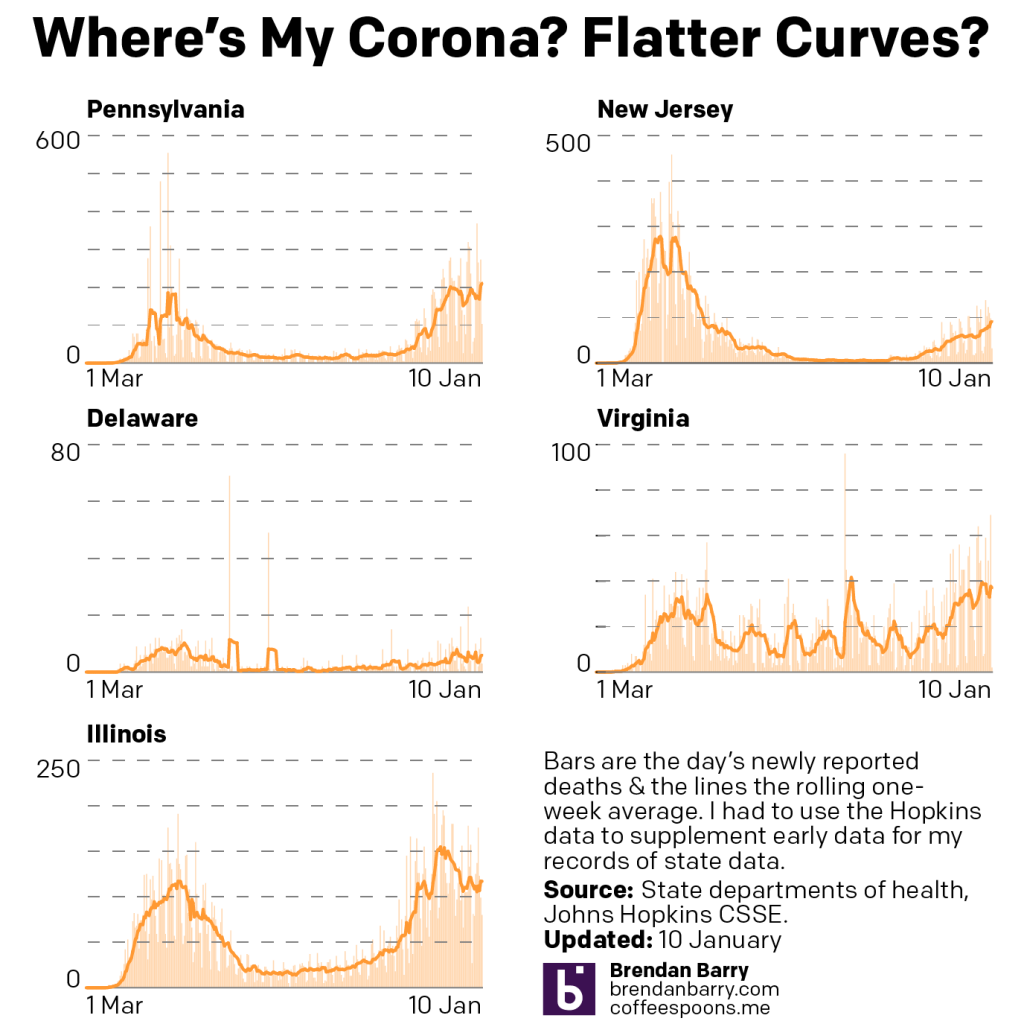
Again, fairly grim news here. A month ago we were talking about rising rates of deaths in all but Illinois. And in fact, Illinois is the only state where the death rate is significantly lower than what it was in mid-December.
In New Jersey and Virginia, we see two states where the rising death rate perhaps slowed, but it never really entered into decline. Pennsylvania and Delaware offer perhaps static death rates. In fact, Pennsylvania just yesterday surpassed its mid-December peak level.
But keep in mind that deaths lag new cases by somewhere between two to four weeks, sometimes longer. What this means is that with new cases now rebounding and in fact surpassing their peaks from a month ago, we can expect that the end of January and beginning of February could be particularly deadly.
The situation is dire in the United States and things are going to get worse before they get better.
Credit for the piece is mine.
Leave a Reply
You must be logged in to post a comment.