Last week I wrote about some signals indicating a potential stagnation in terms of declining numbers of new cases. I also wrote about some potential signs of reversals, or increasing numbers of new cases.
This week, what we saw signs of came to pass.
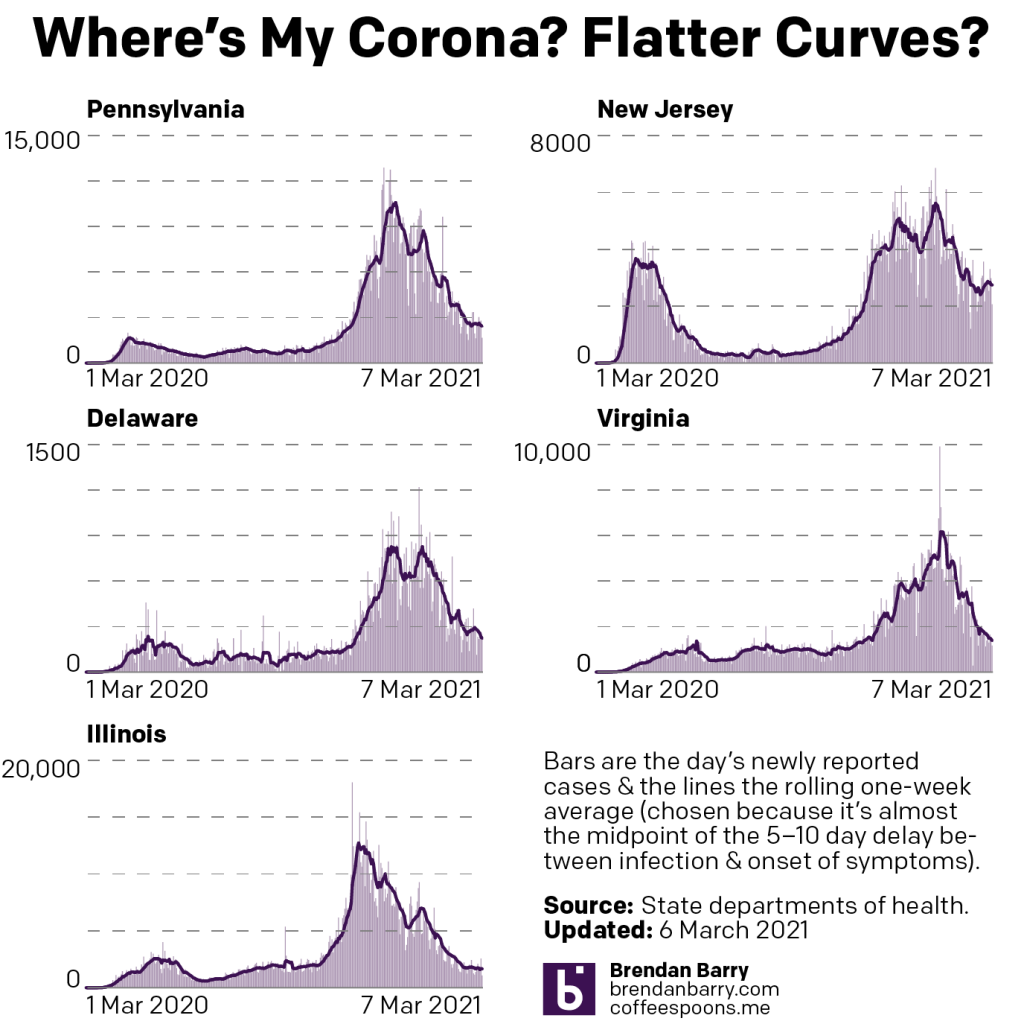
At the tail ends of each chart, you can see that the last week was broadly stagnant. In Pennsylvania and Illinois the seven-day average was itself remarkably flat. Delaware is now where it was this time last week; a slight rise in new cases was met with an equal magnitude decline.
In reversals, we have New Jersey. New case numbers there increased throughout the week. With lower weekend data, those numbers have fallen slightly.
Only in Virginia did we see good numbers in new cases. Numbers there fell over the last week, though notably at a slower pace than in previous weeks.
Deaths presented broadly good news. Last week we had mixed signals with increasing numbers in Delaware and Virginia. We knew the increase in Virginia was due to the state processing a backlog of death certificates with Covid.
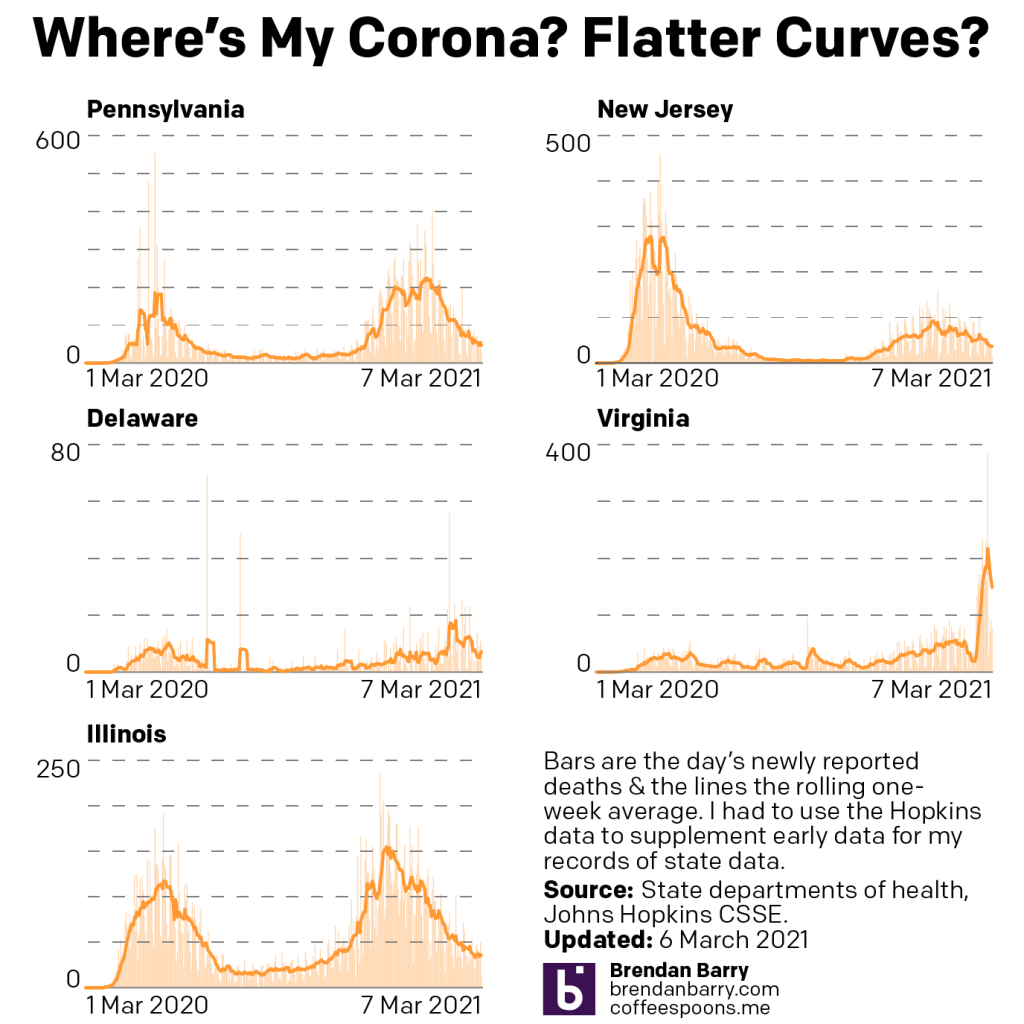
But in the last few days, those numbers have also fallen though the state reports it is still processing the backlog. And in Delaware, the daily number of deaths has also fallen again. I think it’s too early to say this peak has crested, but it could well be.
And in the other states, we continue to see slowly falling numbers of deaths. There are some potential signs of that bottoming or stalling out in Illinois, but we’ll have to see how this week pans out.
Finally, the best news we had over the course of last week was with vaccinations.
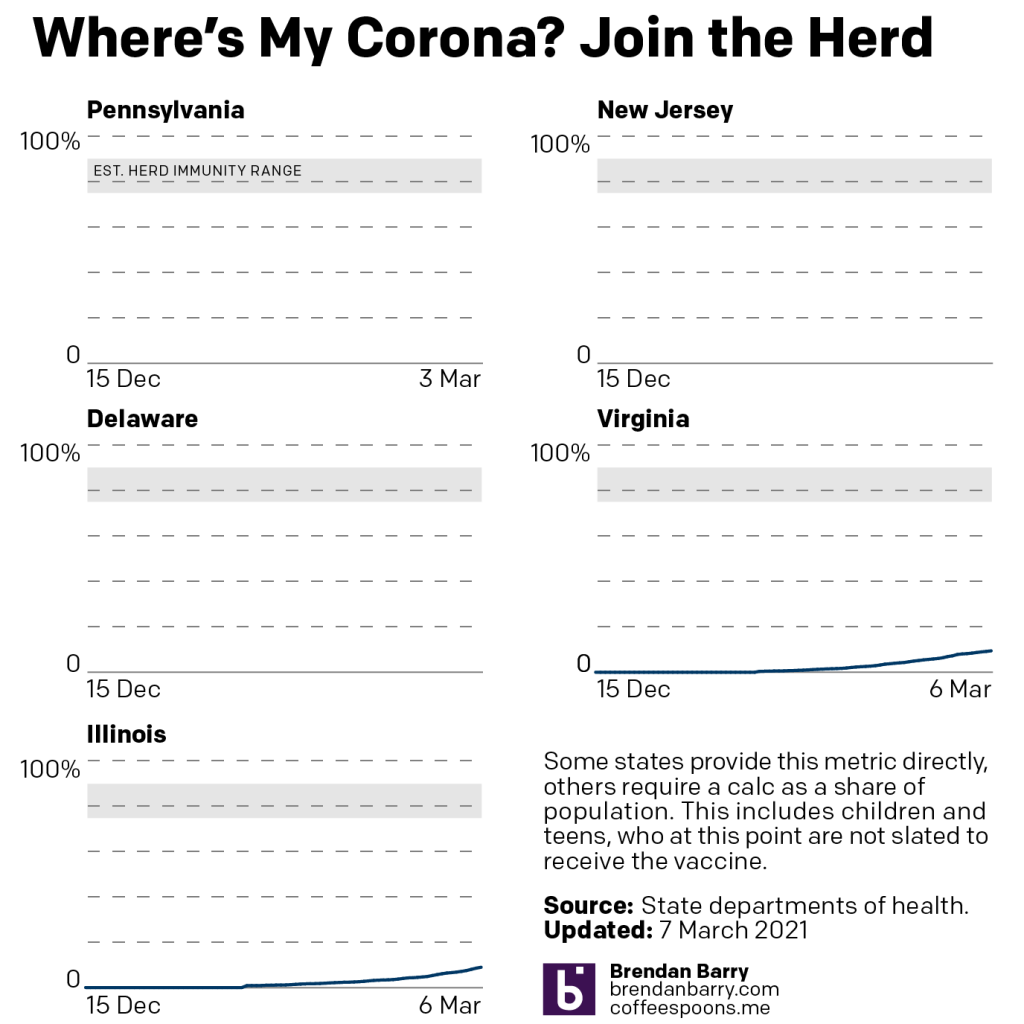
Last week I mentioned that we can see the lines moving upwards as we approach 10% fully vaccinated in Pennsylvania, Virginia, and Illinois.
This week, well let’s start here: as I’ve pointed out in the past, Pennsylvania does not have a centralised reporting system. Most notably the state reports figures for all but Philadelphia county (coterminus with the city). The city reports its own figures. I aggregate the two. But for the last several days, the Philadelphia data site has been broken, so we don’t know the progress of vaccinations in the city. And as the largest city/county in the state, Philadelphia is an enormous part of figuring out the statewide numbers.
So looking only at Virginia and Illinois, the numbers look good. Virginia is at nearly 9.5%. Illinois is on 8.92%.
But we really need Philadelphia to get its act together.
Credit for the piece is mine.
Leave a Reply
You must be logged in to post a comment.