We start this work week with something that the young people use, but in a different way than older people do, including elder millennials like myself: social media. Of course, as an elder millennial, I remember Facebook when it was The Facebook when it expanded access to Penn State, which I attended for a single year.
Pew Research conducted a study of teenagers that revealed they use social media more than ever before, but that they use new (sort of) platforms more than the venerable paragon of the past: Facebook.
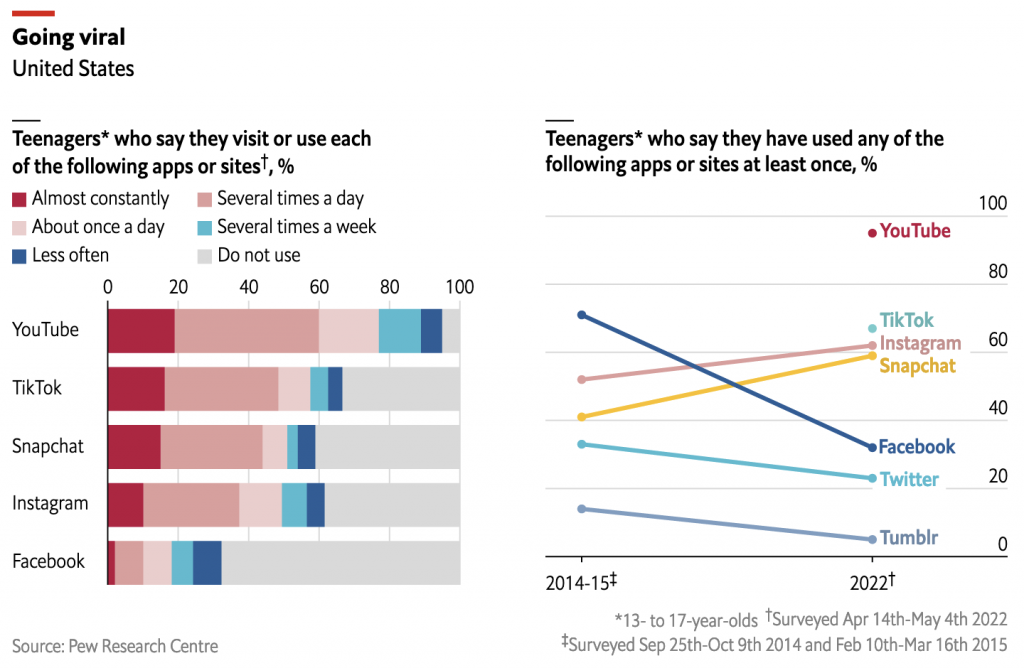
The Economist’s Data Team looked at the data and created this graphic showing the trends.

We see stacked bar charts on the left and then a line chart on the right. The left-hand chart shows the frequency with which teenagers use various social media platforms. What I don’t understand is how someone uses a social media application “almost constantly”. But that’s probably why I’m an elder millennial.
Get off my lawn, you whippersnappers.
On the right we see the percentage of teenagers who have used an application at least once. The biggest winners? Applications primarily featuring image over text. The losers? Those that use words.
Now longtime readers know that I am not terribly fond of stacked bar charts, especially because they make comparisons between, in this case, social media platforms very difficult. And I feel like we have a story in the occasional use responses, but it’s tough teasing it out from this graphic.
On the right, well, this is one I enjoy. You can tell just how much the social media environment has evolved in the last 7–8 years because TikTok did not exist and YouTube was not thought of as a social media platform.
I wonder if different colours were truly needed for the line chart. The lines do not really overlap and there is sufficient separation that each line can be read cleanly. If the designers wanted to highlight the fall of Facebook or another story line, they could have used accent colours.
But overall a solid graphic.
Now to check my feeds.
Credit for the piece goes to the Economist’s Data Team.
