Last month the Philadelphia Inquirer published an article examining the geographic distribution of Teslas and Cybertrucks and whether or not your car is liberal or conservative. The interactive graphics focused more on a sortable table, which allowed you to find your vehicle type.
The sortable list offers users option by brand and body type—not model. But whilst the newspaper claims to include 11 million vehicles in Pennsylvania, its classifications are lacking. For example, I drive a Ford Focus hatchback, but the list includes only 1400 hatchbacks, of the Toyota four-door variety in the entire Commonwealth.
More interesting to me was the geographic map of Tesla electric vehicles and Cybertrucks. The screenshot below is of the Tesla.
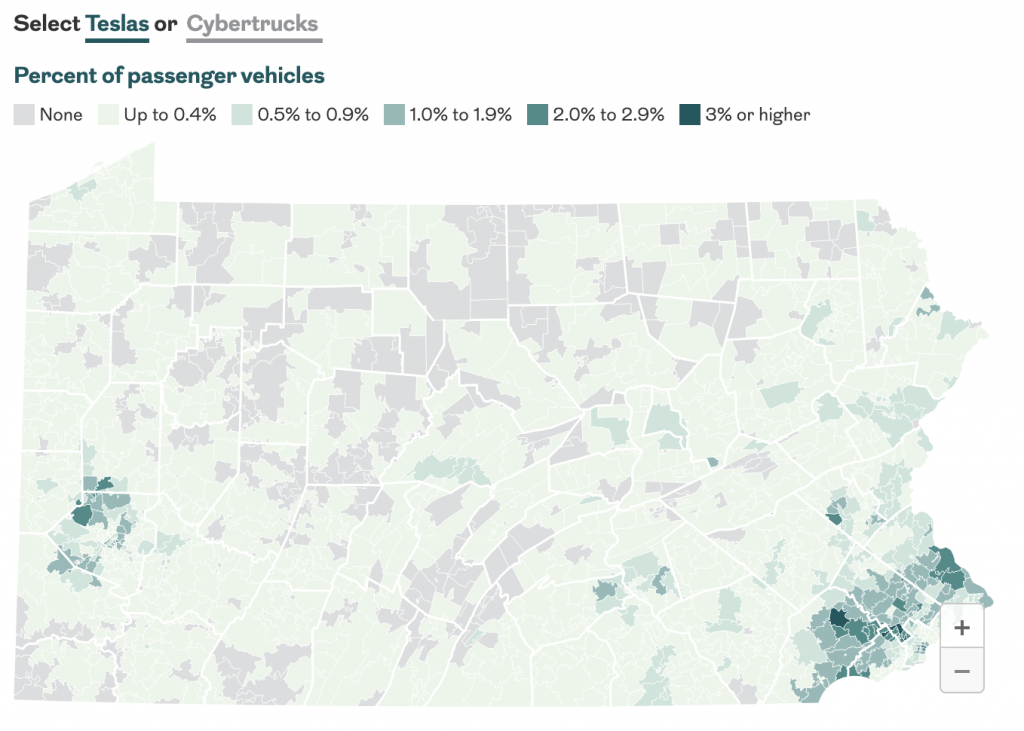
The choropleth maps use shades of green to indicate the share of vehicles in the particular zip code. Teslas represent relatively small shares of the market across Pennsylvania, but their limited presence is concentrated in the more affluent communities surrounding the big cities of Philadelphia and Pittsburgh. Cybertrucks are even less popular in Pennsylvania and barely register statewide.
Overall the graphics work, but I wish the data was a bit more robust. I would be curious how political my vehicle choice is. Of course choice is relative here. I purchased my car back in 2010 and I cared little for the brand. I just wanted something small to drive and park in Chicago and that could lug cargo. Of course 2010 was a less polarised time when the outrages of the day centred upon tan suits.
Credit for the piece goes to Lizzie Mulvey and Dylan Purcell.