Gowanus, Brooklyn

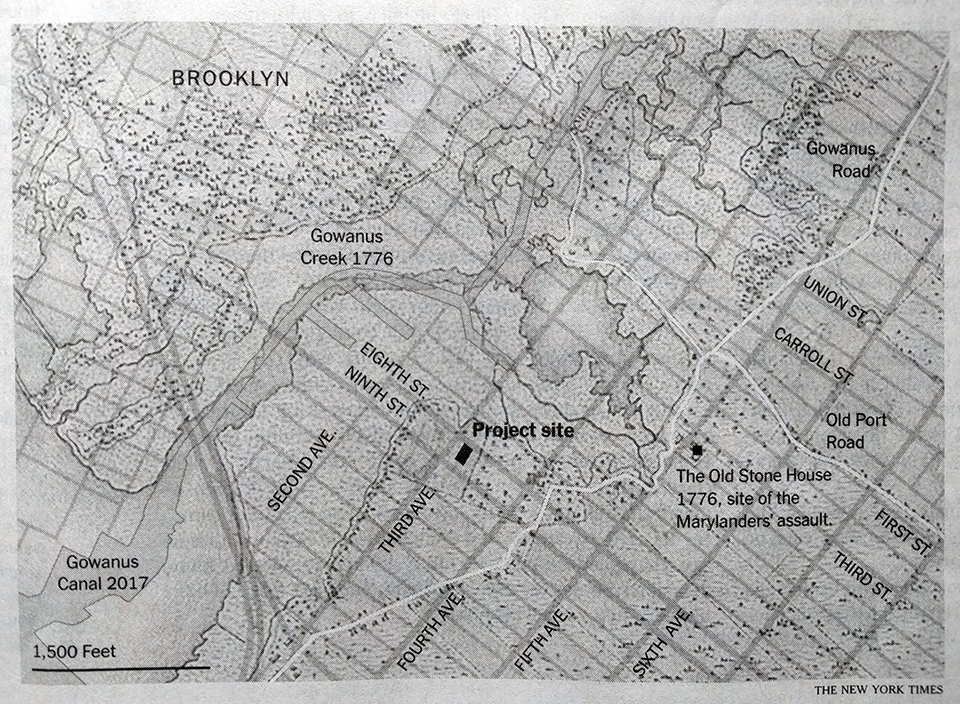
This past weekend I was reading an article in the New York Times about how a diary from the 19th century may indicate a plot in Gowanus Brooklyn destined for development may contain an old slave burial ground. You may recall how this author’s hobbies include genealogy and family history—how I would love to find a 19th century diary. Then, given this interest and the article, it was fantastic to find a map in the article.
Brooklyn in black and white

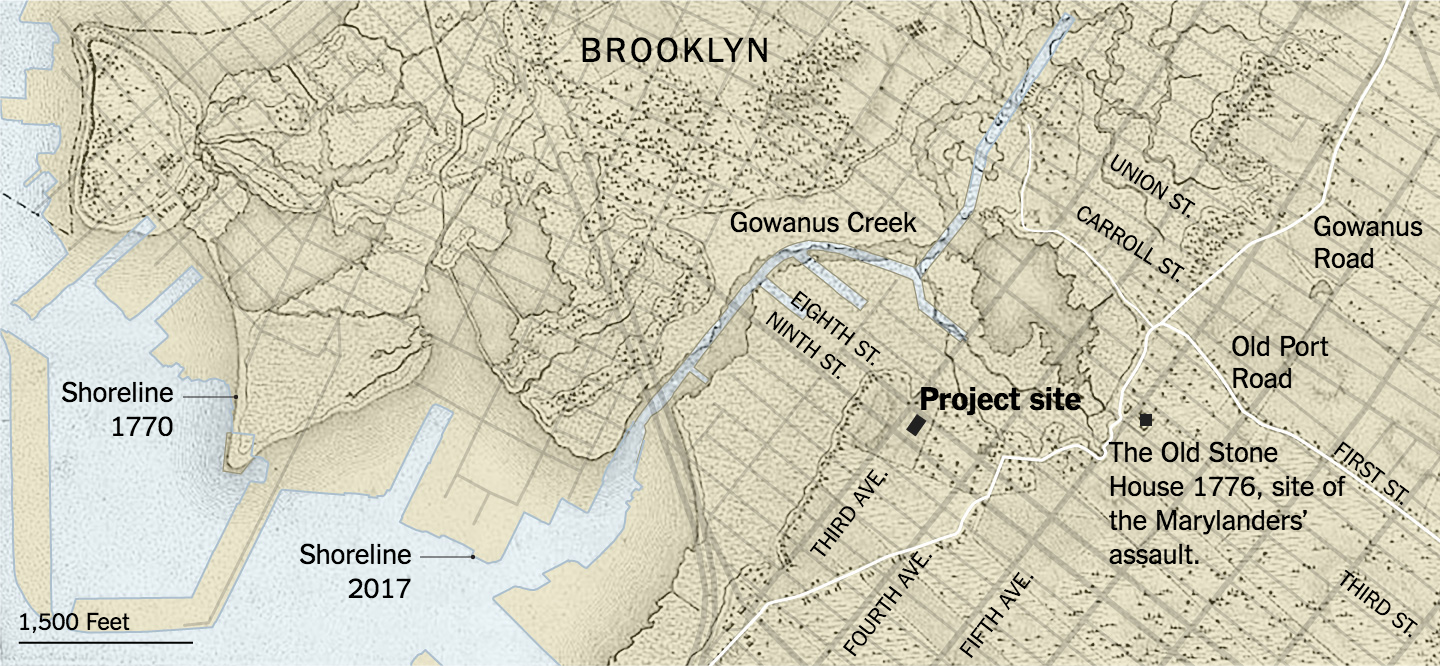
Suffice it to say the map held my fascination for long enough that I saved the paper to post about it today. I was curious about two things, however, one, did the graphic have a credited author—it did not in the print edition—and two, was there a neat interactive version in the online version? The online version is simply a colour version of the map.
Brooklyn, now in colour

But the colour version does one thing that really helps make the graphic complete. In the print edition, there is no clear idea what the different layers are and it did take me a moment or two to understand the overlay. But the online version calls out specifically the map of the area from two different time periods.

Maps like these are my favourite. They blend history and the present. After all the places we live have often been lived in for centuries and they bear the marks of that inhabitance.

As to the first question, credit for the piece goes to Joe Burgess.

Man vs. Shark vs. Marlin vs. Every Other Animal

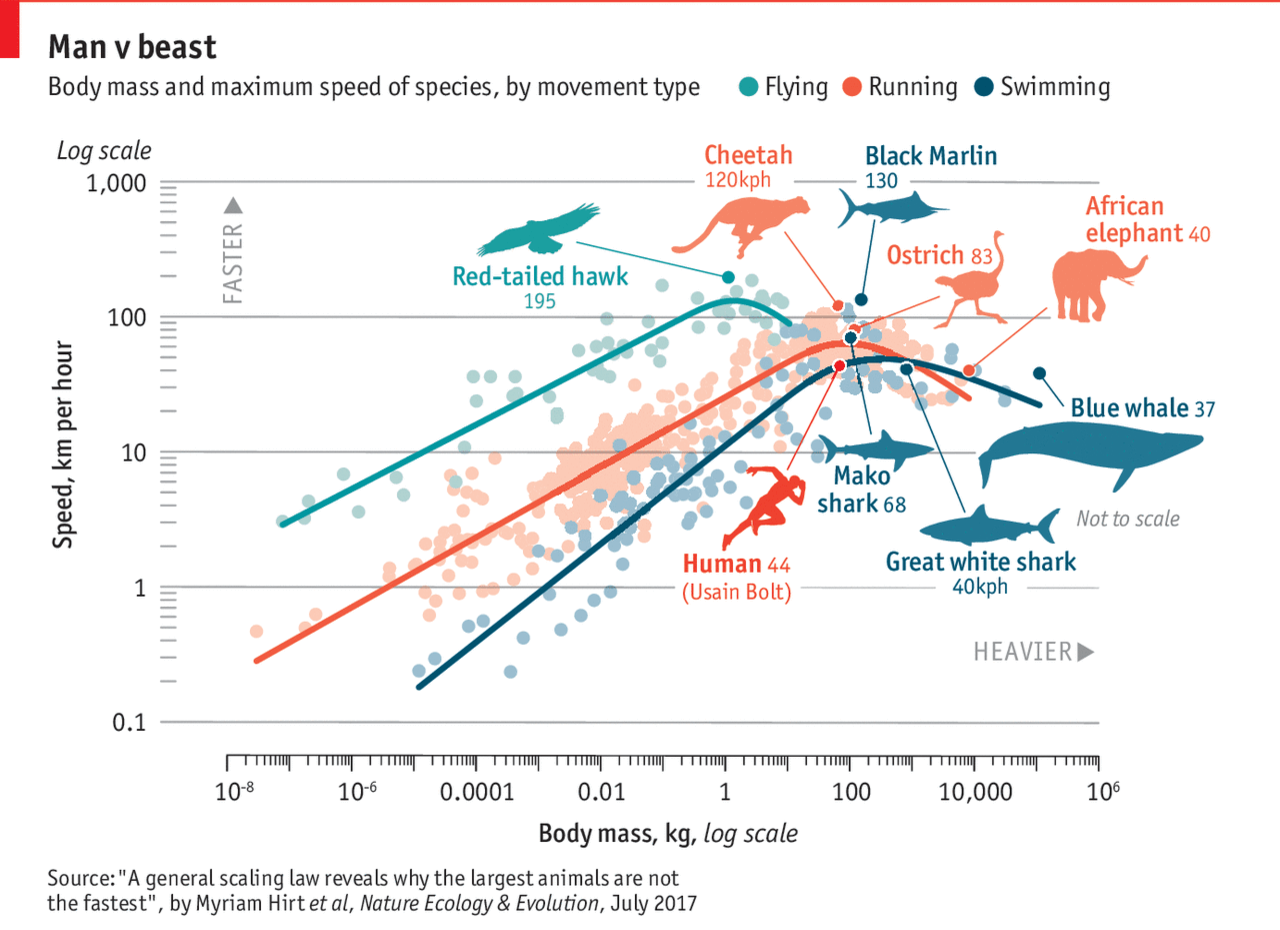
About two weeks ago, Michael Phelps raced a shark. What will they not do for television ratings? The Economist took the basic premise and then had an insightful piece about the speed of animals compared to their size. The whole notion of animals get faster the larger they get. Well, to a point, the Economist found. The graphic is a bit complex, perhaps, in their use of a log scale on both the x and y axes. But they have cute little illustrations of everyone’s favourite animals. So it all balances out in the end.

Man vs. Nature
Man vs. Nature

But there is real science in the piece and it is worth a quick read.

Credit for the piece goes to the Economist graphics department.

Hot Summer Days

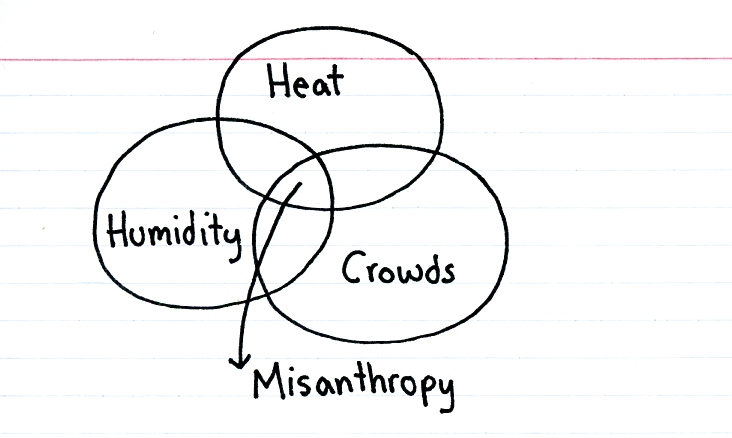
We made it to Friday, folks. So here in Philly it is, of course,  hot and disgusting. (Please refer to Tuesday’s post about the increasingly hot weather in summers.) Thankfully we have ThisIsIndexed to explain what happens in hot weather.

To be fair, I'm not sure misanthropy couldn't be in any other overlap…
To be fair, I’m not sure misanthropy couldn’t be in any other overlap…

Credit for the piece goes to Jessica Hagy.

Immigrations Impact on Economic Growth

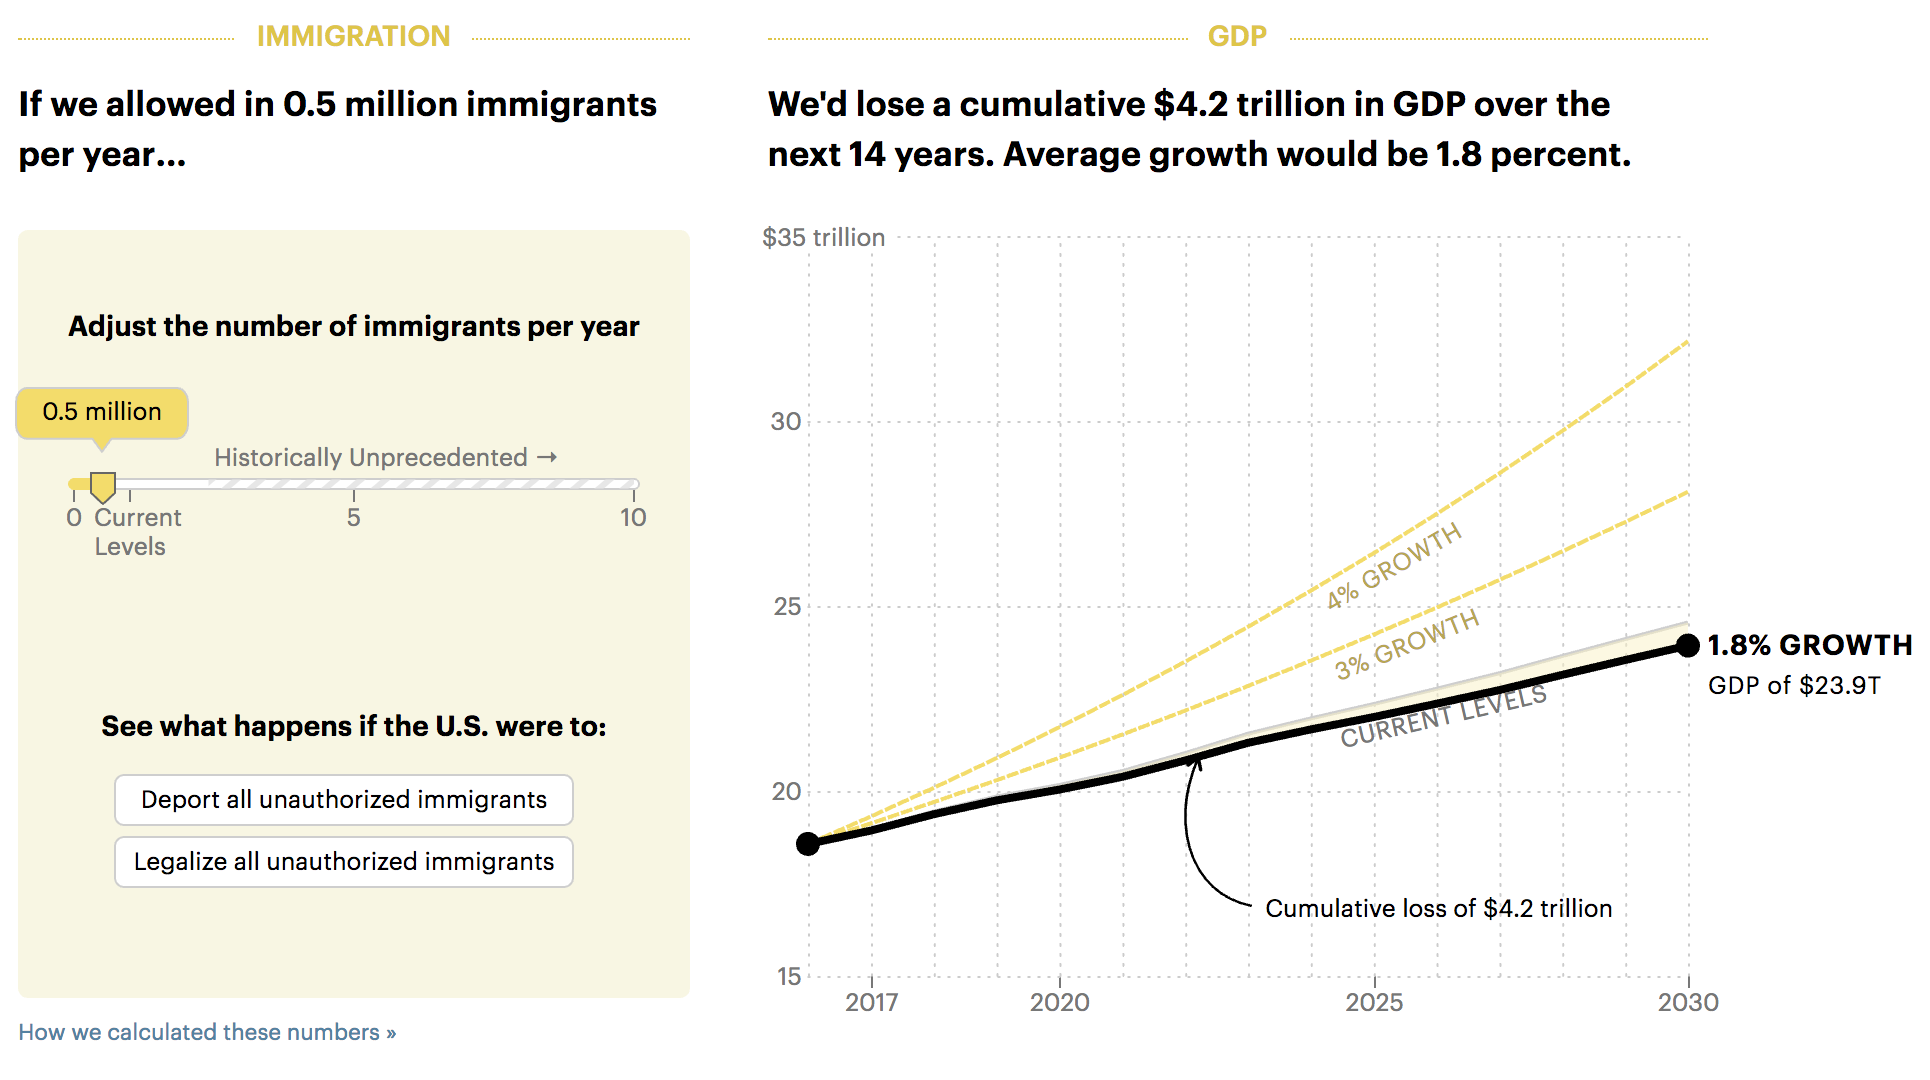
Initially I was not going to post this work, if only because other things came up and I do have to prioritise what I post on my site. It had nothing to do with the work’s quality, which I think is actually quite good. What am I talking about? Well today’s piece is from a Pro Public article about the impact of immigration on economic growth. And it turns out the two are linked. Why? Well, the overly simplistic explanation is that we will need immigrants to pick up the slack in the labour force that will otherwise begin shrinking in years to come.

But why take my word for it when you can take charts’ word for it. The piece does a great job of showing how changes in immigration numbers can help grow or shrink economic growth. And if you recall, President Trump has promised growth rates of 4%. But, and this is why I decided to post this, yesterday it was announced that Trump will support legislation intending to halve immigration to the United States over the next ten years. As my screenshot captured, a reduction in immigration will actually lead to lower economic growth and put us further away from the 4% rate.

Reducing immigration takes GDP growth further away from the 4% target

Credit for the piece goes to Lena Groeger.

Home Vacancies in Kensington and Chelsea

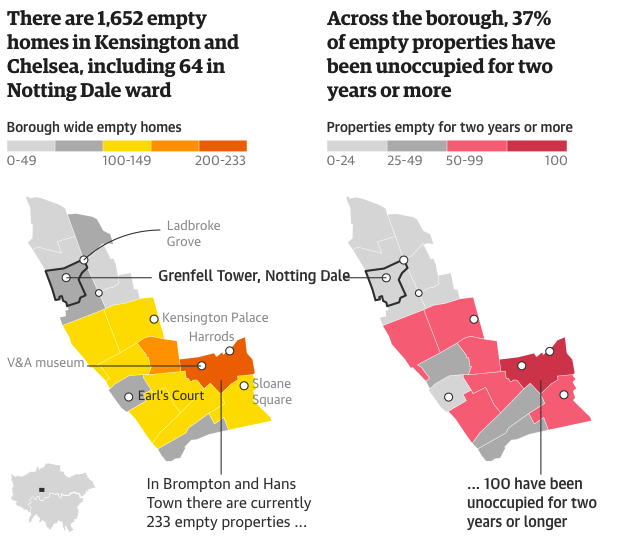
I added Chelsea to make doubly certain for my Philadelphia audience that you did not think I was referring to Philly’s Kensington. Why? Because today’s piece comes from the Guardian and refers to the neighbourhood where the Grenfell Tower caught fire and the inferno killed dozens of people.

A north–south divide

This is not the most complex piece, but I really like the annotations and notes on the choropleth. They add a great amount of detail and context to a graphic that I imagine many places would be okay leave as is. I can see why the colour palette differs for the two maps, but I wonder if it could have been made to work as a unified palette.

Credit for the piece goes to the Guardian graphics department.

Shifting Temperatures

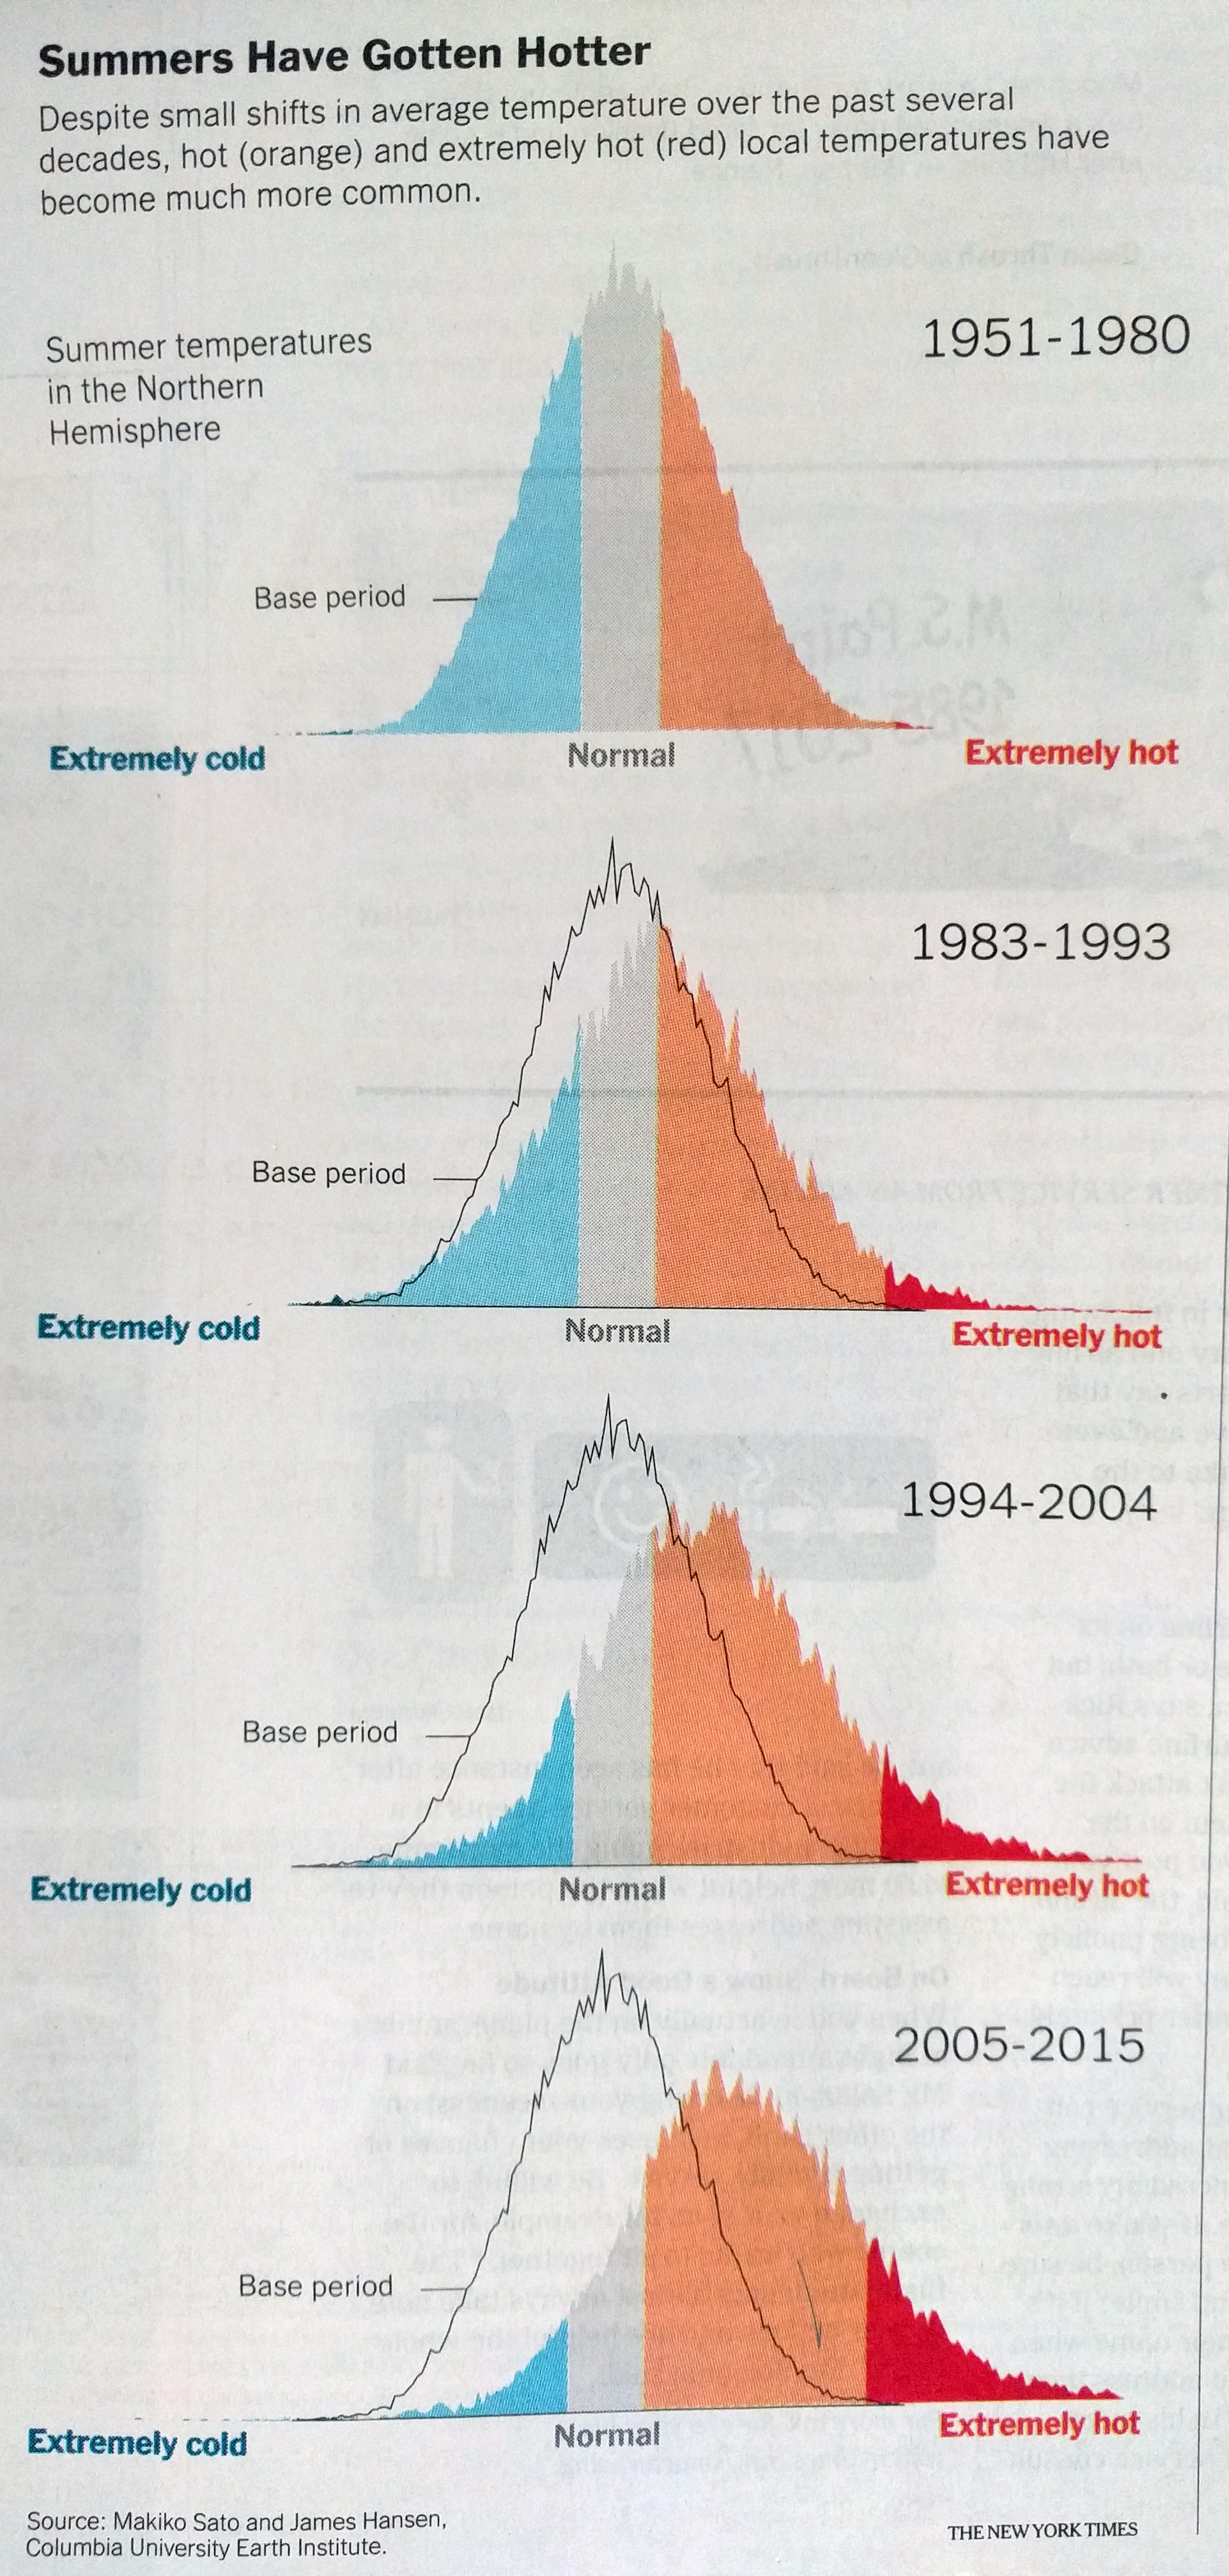
This past weekend, I came upon a neat little graphic in the New York Times supporting an article about the impact of climate change on temperatures. The article basically lays out the argument that summers are getting hotter. And as a cold-weather person, that is dreadful news.

Can we not shift a wee bit the other way please?

But the good news is the graphic was well done. It uses the outline of the baseline data as a constant juxtaposition against the date interval examined. And the colour breaks remain in place to show that compared to what we consider “normal”, we are seeing a shift to the higher end of the spectrum.

Credit for the piece goes to the New York Times graphics department.

Blue Dog Democrats

Last week I mentioned that it appeared Politico was running with articles featuring data visualisation. Just this morning I stumbled upon another article, this one about the Blue Dog Democrats. For those that do not know, Blue Dogs are basically a more conservative Democrat and were the remnants of the Democratic south. But in 2010, they got all but wiped out. This article looks at how and where they might just be coming back.

Blue Dogs were largely a faction of the party drawing from the South

If this trend of data-driven and visualised content continues, the Politico could be doing some interesting work over the next year. By then we will be in a rather intense mid-term cycle and there might be some political news to coverage.

Credit for the piece goes to the Politico graphics department.

Comparing the US Healthcare System to the World

Spoiler, we don’t look so great.

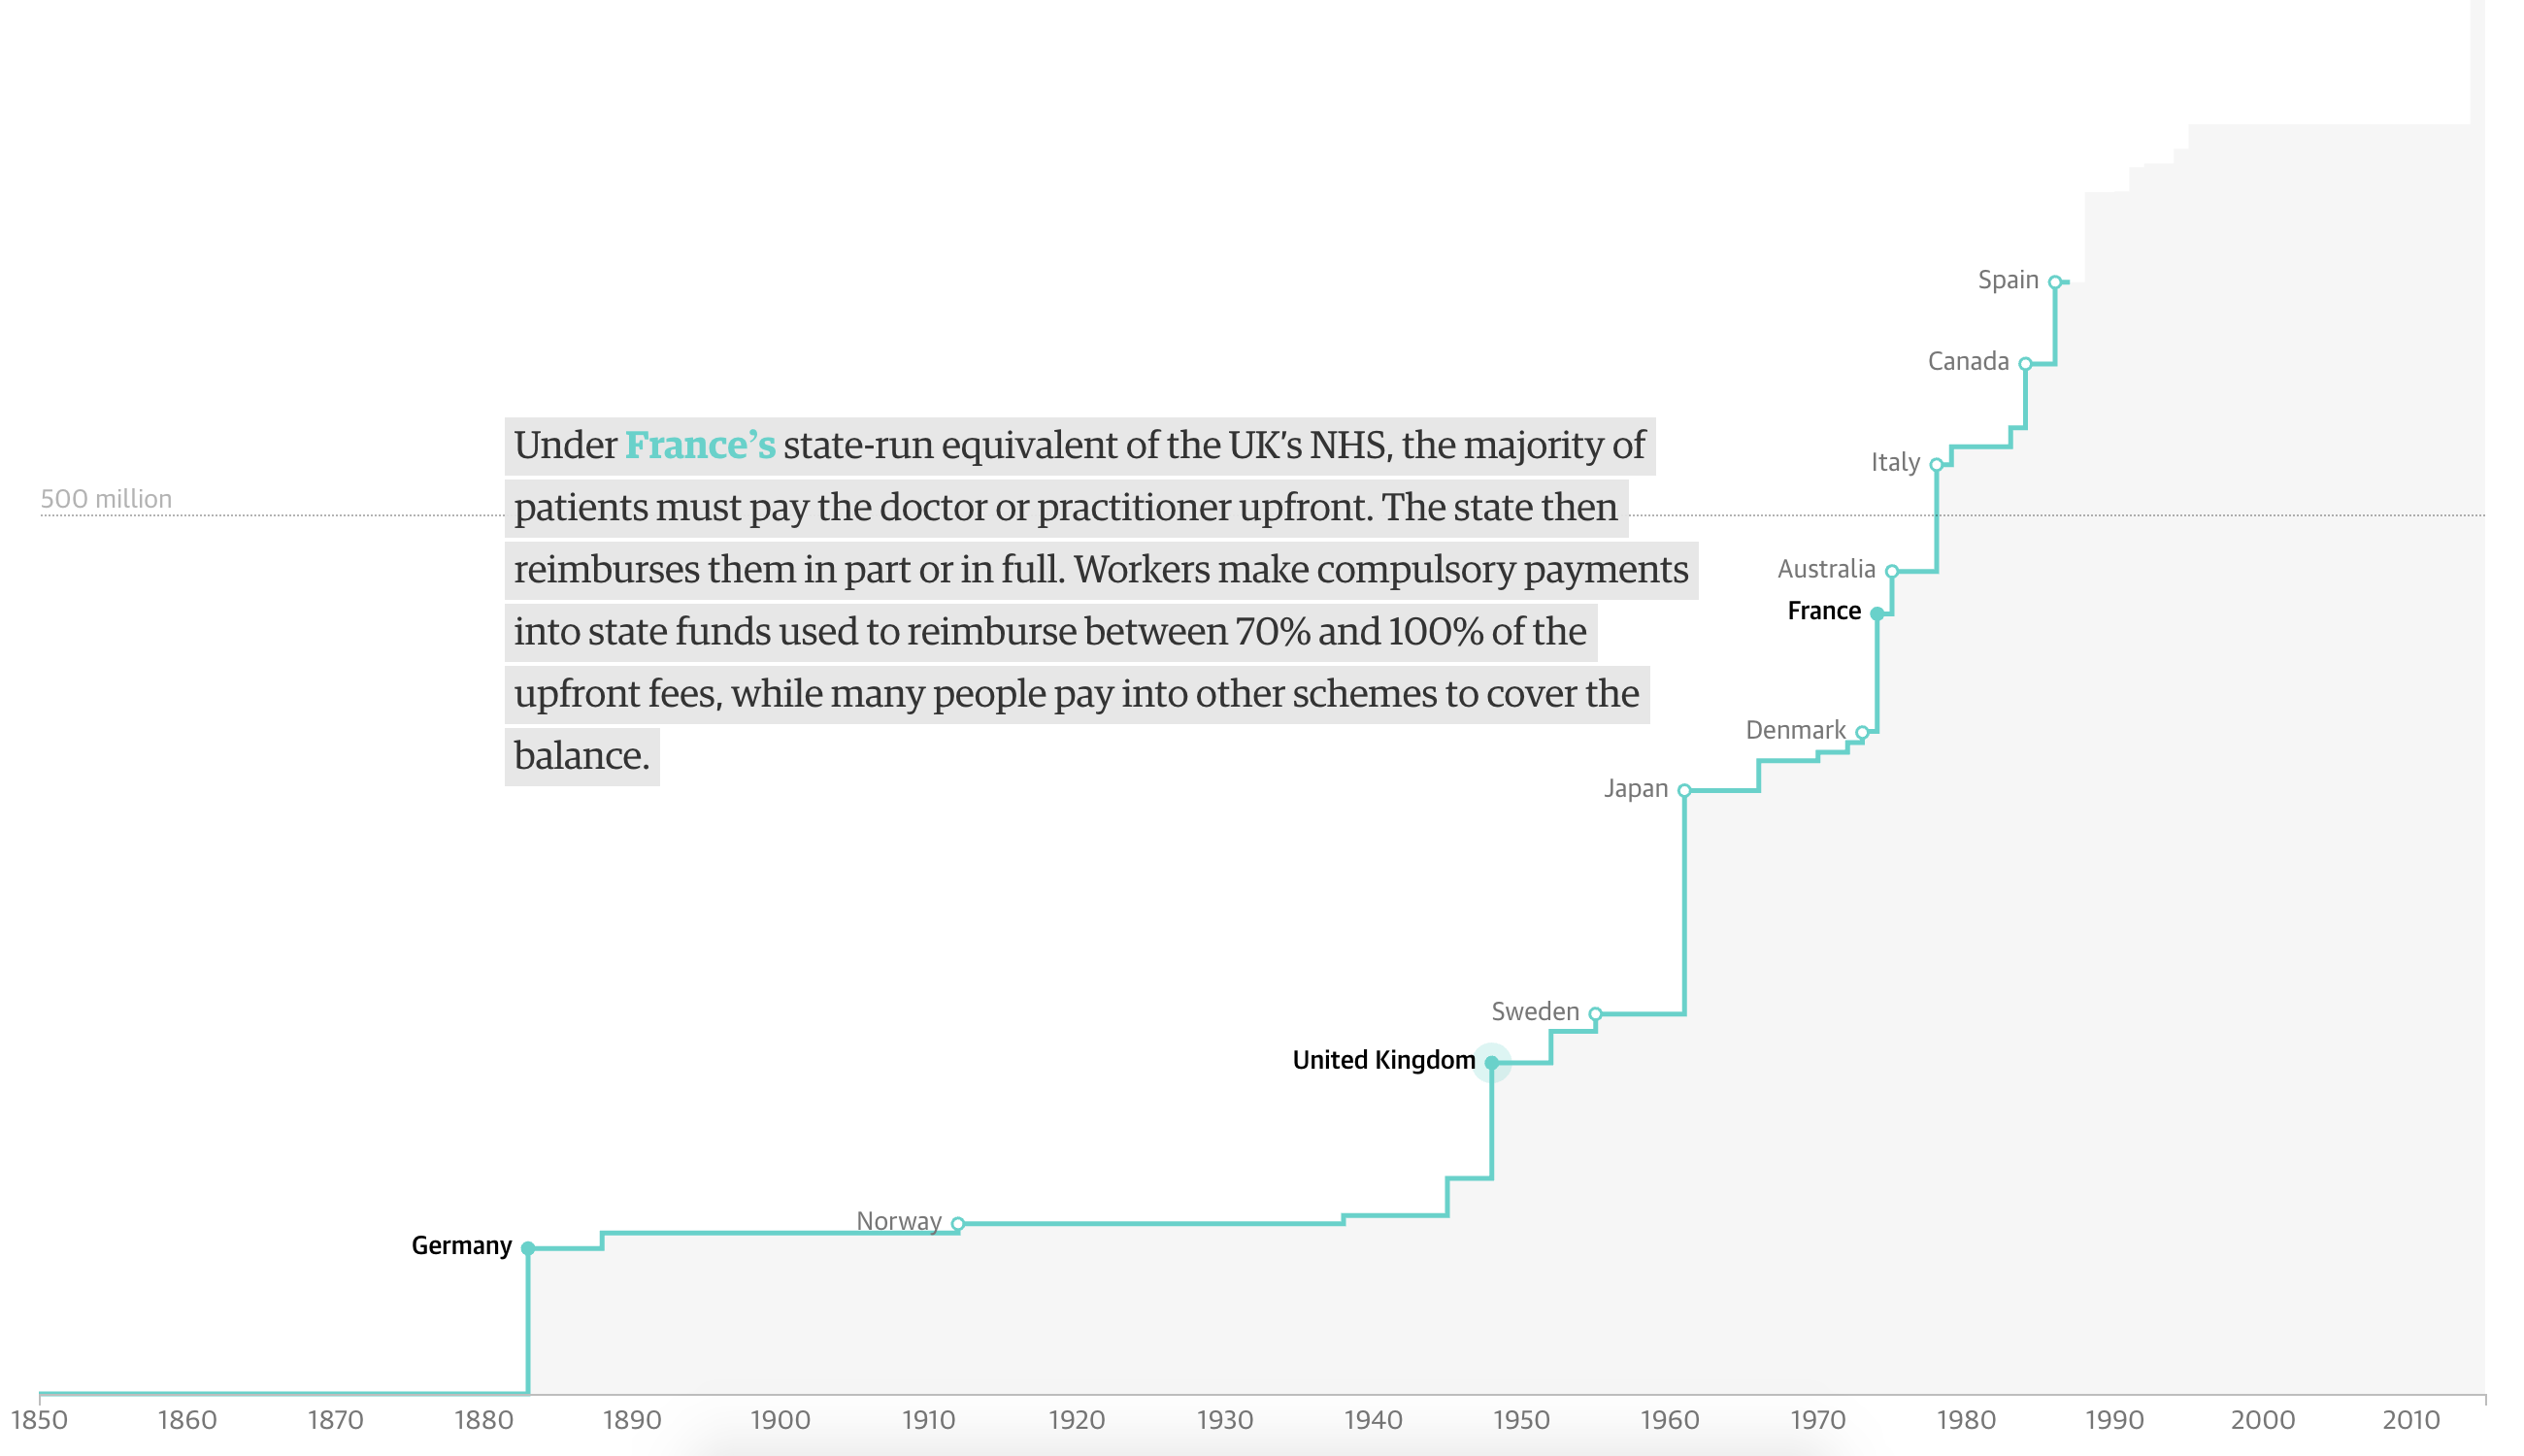
In this piece from the Guardian, we have one of my favourite types of charts. But, the piece begins with a chart I wonder about. We have a timeline of countries creating universal healthcare coverage, according to the WHO definition—of which there are only 32 countries. But we then plot their 2016 population regardless of when the country established the system. It honestly took me a few minutes to figure out what the chart was trying to communicate.

This is the only graphic I'm not sure of in the entire piece.
This is the only graphic I’m not sure of in the entire piece.

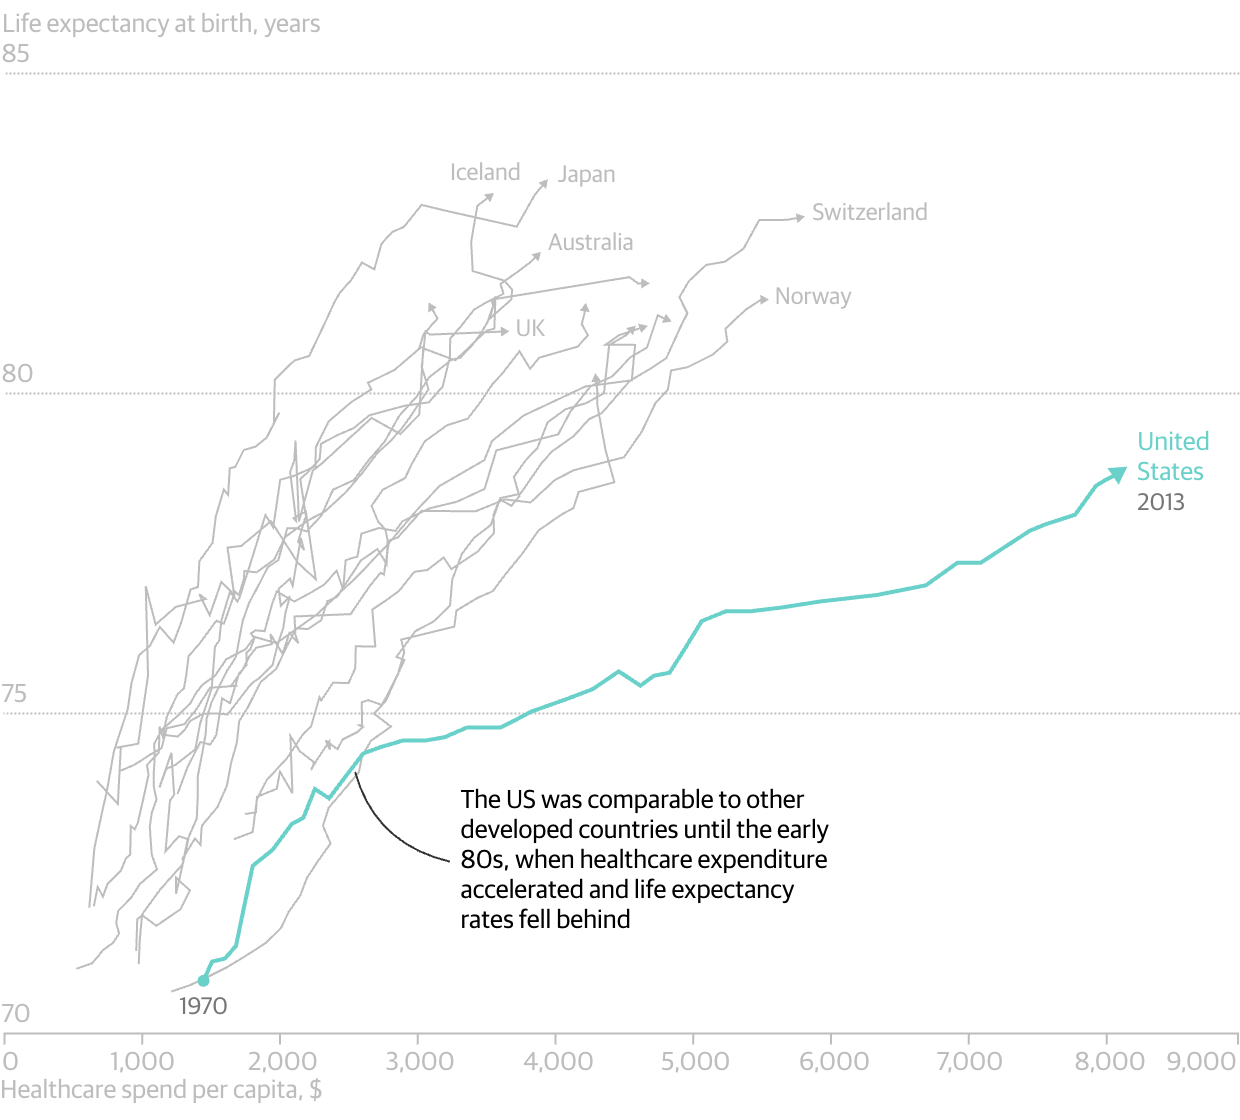
However, we do get one of my favourite charts: the scatter plot over time. And in it we look at the correlation between spending on healthcare compared to life expectancy. And, as I revealed in the spoiler, for all the money we spend on healthcare—it is not leading to longer lives as it broadly does throughout the world. And care as you might want to blame Obamacare, the data makes clear this problem began in the 1980s.

Someone's getting cheated out of a lot of money. Oh wait, that's us…
Someone’s getting cheated out of a lot of money. Oh wait, that’s us…

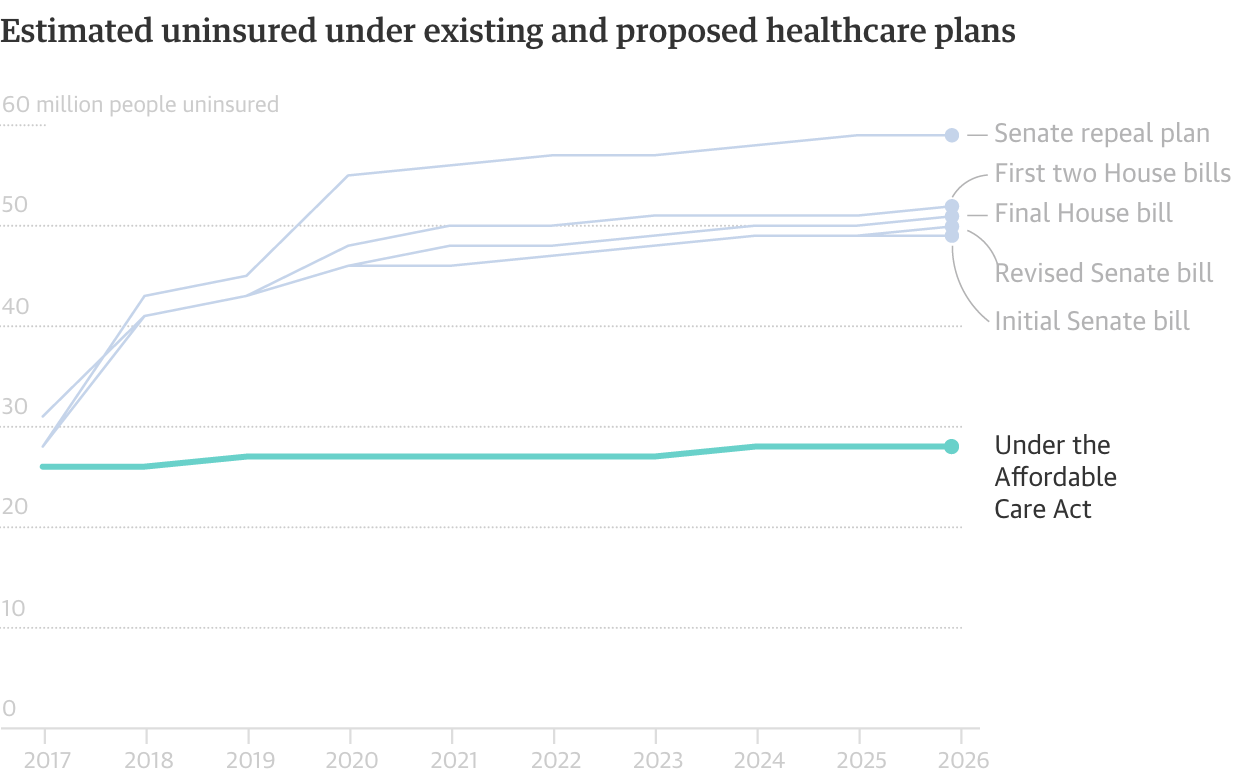
And of course Obamacare is why the Guardian published this piece since this is the week of the Vote-a-rama that we expect to see Thursday night. The Republicans will basically be holding an open floor to vote on anything and everything that can get some measure of repeal and/or replace 50 votes. And to wrap the piece, the Guardian concludes with a simple line chart showing the number of uninsured out to 2026. To nobody’s surprise, all the plans put forward leave tens of millions uncovered.

When all the options look bad, why not work with what you have?

It is a fantastic piece that is well worth the read, especially because it compares the systems used by a number of countries. (That is largely the text bit that we do not cover here at Coffeespoons.) I found the piece very informative.


Credit for the piece goes to the Guardian graphics department.

Brexit’s Impact on Irish Shipping

Today’s post is, I think, the first time I’ve featured the Politico on my blog. Politico is, I confess, a regular part of my daily media diet. But I never thought of it as a great publication for data visualisation. Maybe that is changing?

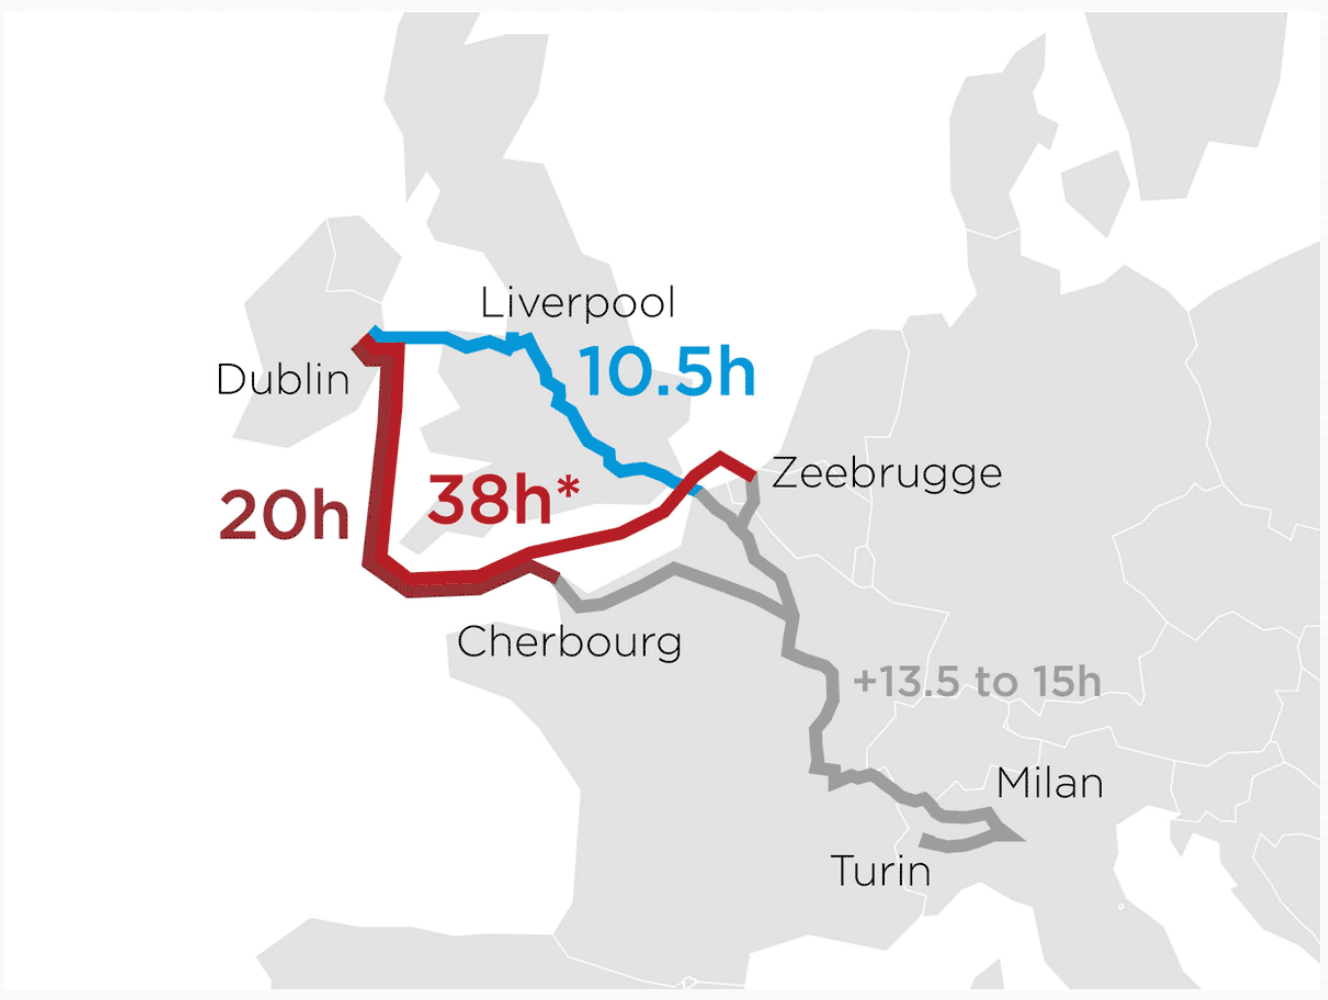
Anyway, today’s post highlights an article on how the Irish shipping/logistics industry could be affected by Brexit. To do so, they looked at data sets including destinations, port volume, and travel times. Basically, the imposition of customs controls at the Irish border will mean increased travelling times, which are not so great for time-sensitive shipments.

This screenshot if of an animated .gif showing how pre-Brexit transit was conducted through the UK to English Channel ports and then on into the continent. Post-Brexit, to maintain freedom of movement, freight would have to transit the Irish Sea and then the English Channel before arriving on the continent. The piece continues with a few other charts.

Brexit strikes again

My only question would be, is the animation necessary? From the scale of the graphic—it is rather large—we can see an abstracted shape of the European coastlines—that is to say it’s rather angular. I wonder if a tighter cropping on the route and then subdividing the space into three different ‘options’ would have been at least as equally effective.

Credit for the piece goes to Politico’s graphics department.