By now you may have heard that this Thursday media outlets across the United, joined by some international outlets as well, have all published editorials about the importance of the freedom of the press and the dangers of the office of the President of the United States declaring unflattering but demonstrably true coverage “fake news”. And even more so, declaring journalists, especially those that are critical of the government, “enemies of the people”.
I have commented upon this in the past, so I will refrain from digressing too much, but the sort of open hostility towards objective reality from the president threatens the ability of a citizenry to engage in meaningful debates on public policy. Let us take the clearly controversial idea of gun control; it stirs passions on both sides of the debate. But, before we can have a debate on how much or how little to regulate guns we need to know the data on how many guns are out there, how many people own them, how many are used in crimes, in lethal crimes, are owned legally or illegally. That data, that verifiably true data exists. And it is upon those numbers we should be debating the best way to reduce the numbers of children massacred in American schools. But, this president and this administration, and certain elements of the citizenry refuse to acknowledge data and truth and instead invent their own. And in a world where 2+2=5, no longer 4, who is to say next that no, 2+2=6.
There are hundreds of editorials out there.
Read one from the Philadelphia Inquirer, the Chicago Tribune, the Guardian, and/or the New York Times.
But the one editorial board that started it is that of the Boston Globe. I was dreading how to tie this very important issue into my blog, which you all know tries to focus on data and design. As often as I stand upon my soap box, I try to keep this blog a little less soapy. Thankfully, the Globe incorporated data into their argument.
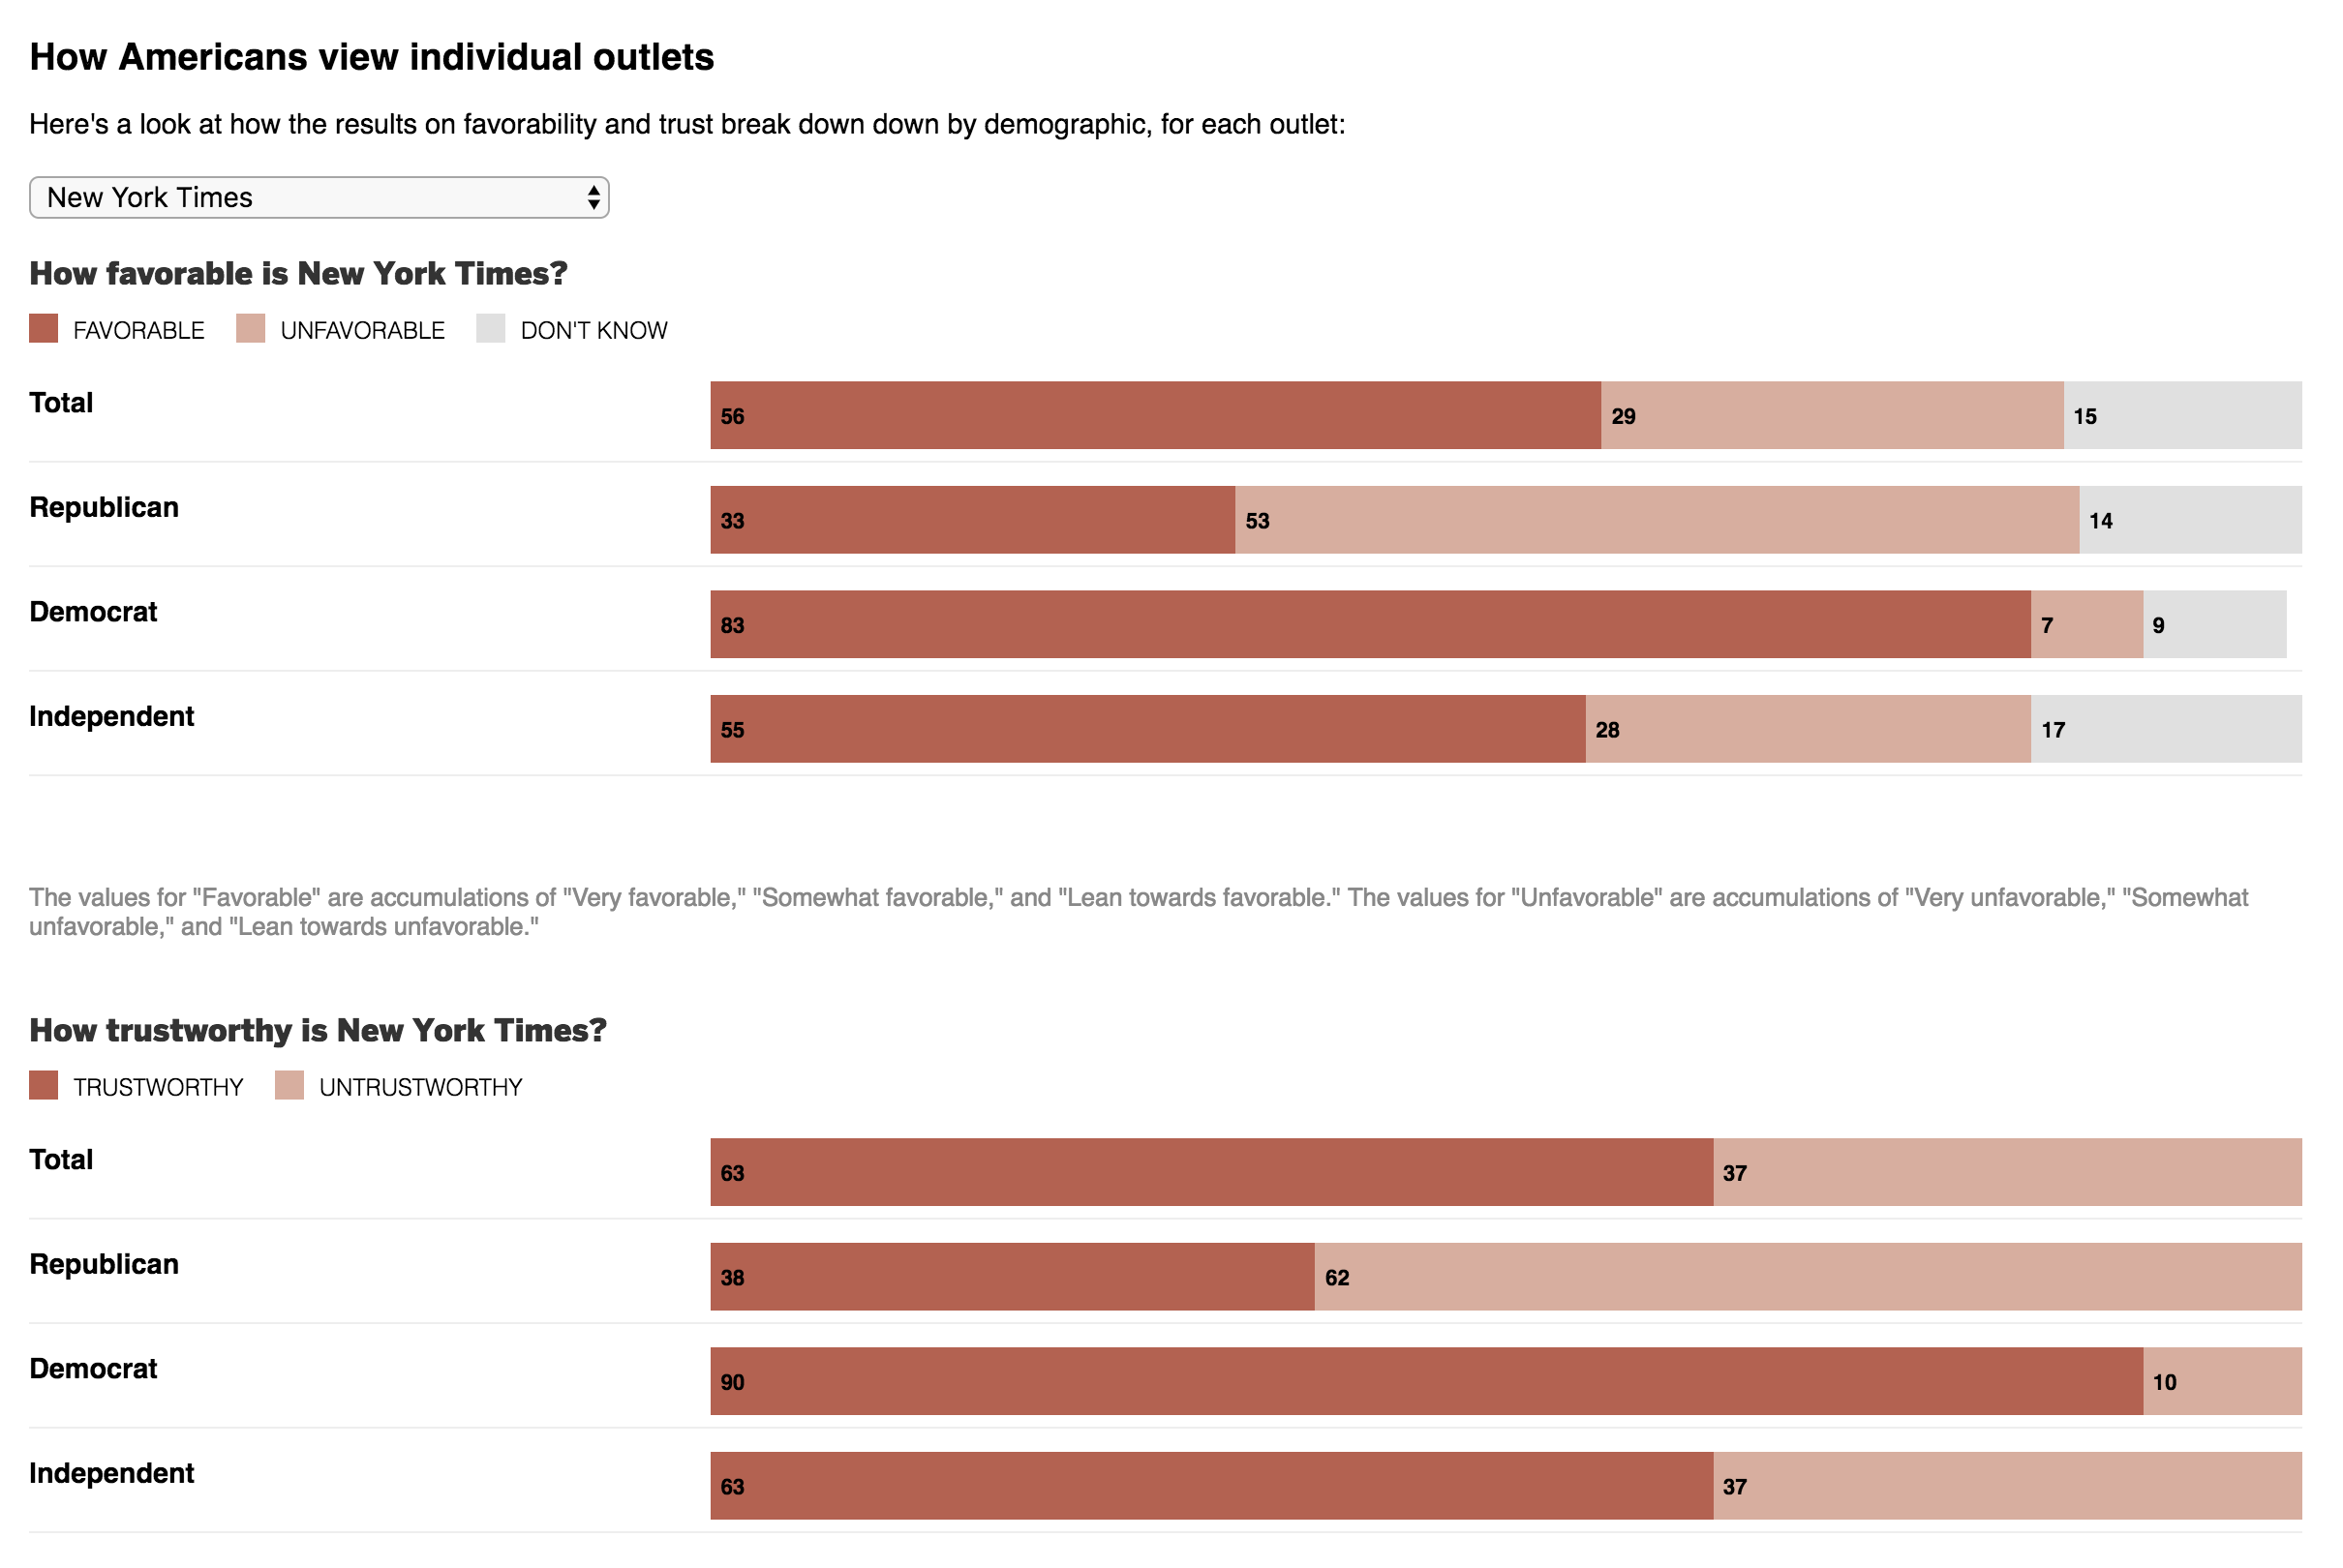
The end of their post concludes with a small interactive piece that presents survey data. It shows favourability and trustworthiness ratings for several media outlets broken out into their political leanings. The screenshot below is for the New York Times.

The design is simple and effective. The darker the red, the more people believe an outlet to be trustworthy and how favourably they view it.
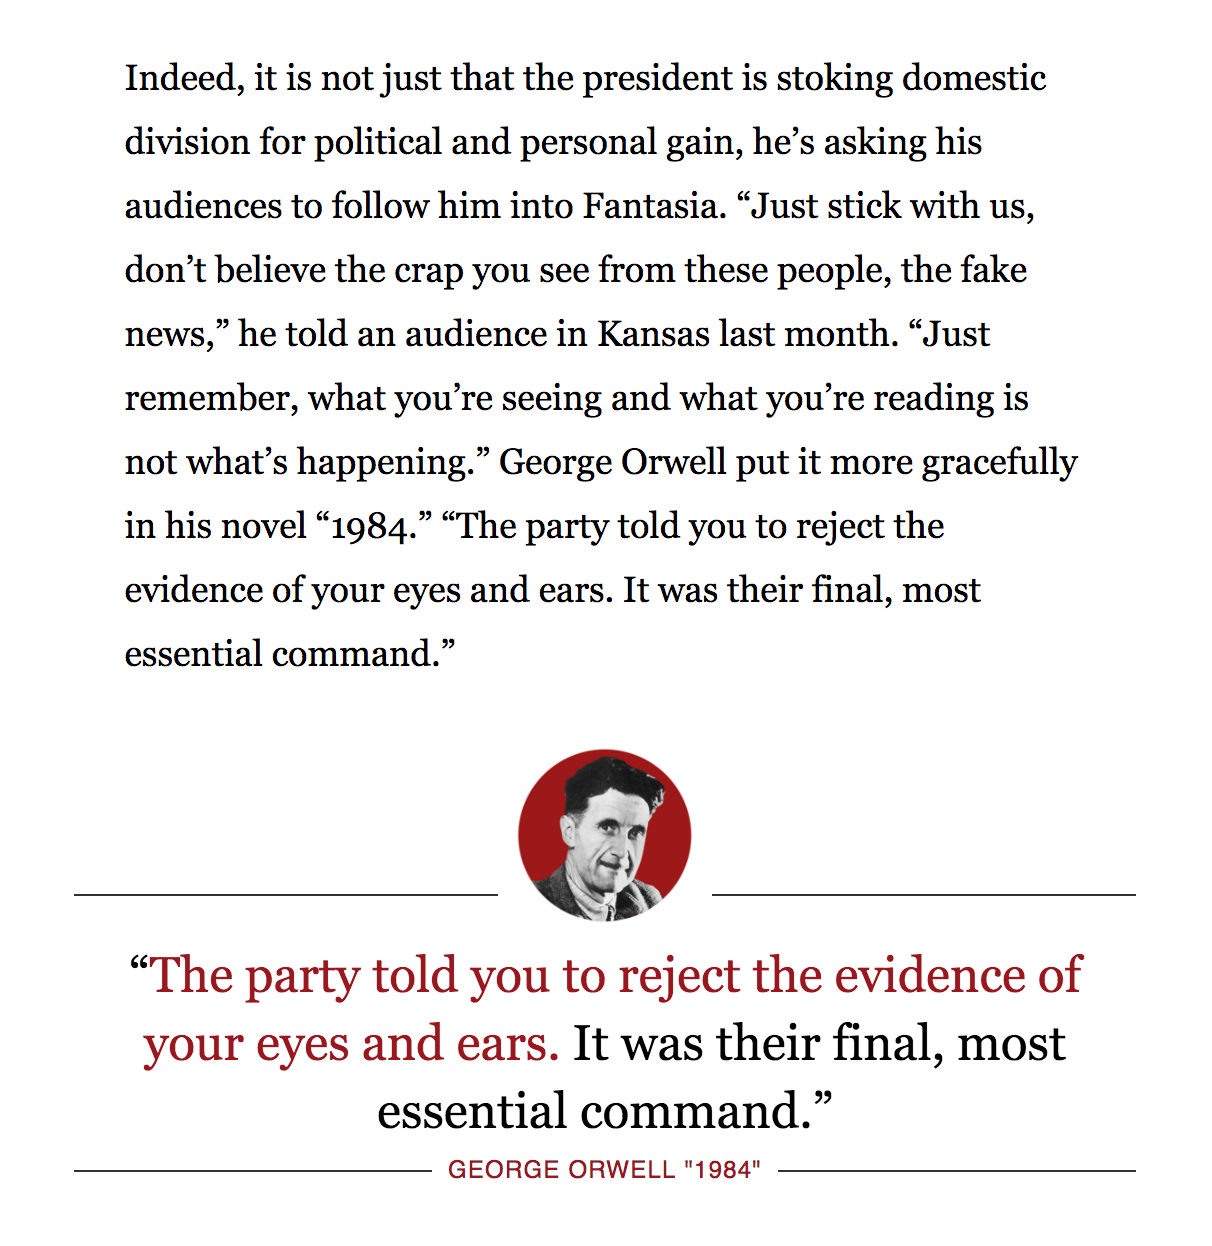
But before wrapping up today’s post, I also want to share another bit from that same Boston Globe editorial. As some of you may know, George Orwell’s 1984 is one of my favourite books of all time. I watched part of a rambling speech by the president a few weeks ago and was struck at how similar his line was to a theme in that novel. I am glad the Globe caught it as well.
Credit for this piece goes to the Boston Globe design staff.

