Earlier this year the National Transportation Safety Board (NTSB) recommended changes in the current blood alcohol limits to reduce youth drunk driving. The NTSB wants the limit dropped/increased from 0.08 to 0.05. Fun side note, technically, the NTSB needs to have the states enact this on their own accord because such limits are not federal power. Instead, the federal government uses the threat of witholding federal transport money as a means of urging states to comply.
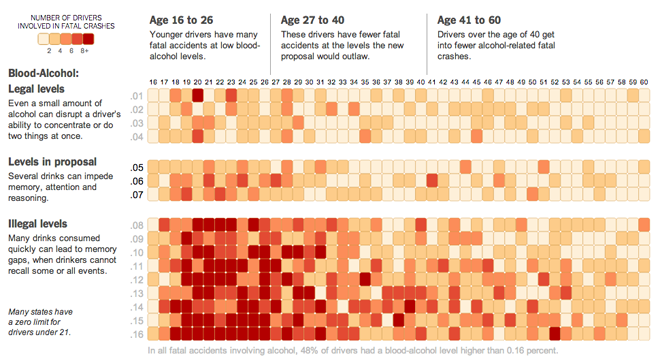
Anyway, the New York Times took a look at the data on fatal crashes and blood alcohol in two heat charts. The first looks at the ages of drivers. The youth problem is self-evident.

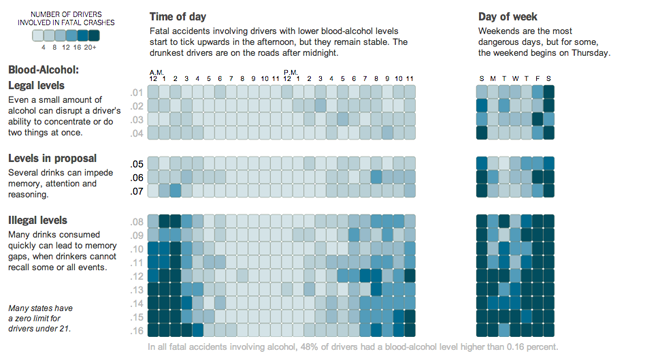
Toggling to time of day shows perhaps a more commonly thought pattern: drunk driving rises significantly after midnight.

In general I think the piece is very successful. In particular, the breakout or separation of the new limits shows in clear relief how important those three hundredths could be in lowering alcohol-related traffic fatalities. And as seems to be increasingly the case with at least the Times, the use of annotations makes the story told by the data far clearer.
Perhaps the only design quibble I have is the shape of the squares. The rounded corners create weird, little white gaps between cells. And especially in the darker fields, they distract me more so than small, thin borders otherwise would.
Credit for the piece goes to Alastair Dant, Hannah Fairfield, and Andrew W. Lehren.
