Last week I wrote about how we may have been beginning to see divergent patterns in new cases, i.e. how New Jersey in particular had seen its new cases numbers falling whilst other states continued with increasing case counts.
One week later, that may still broadly hold true.
Emphasis on may.
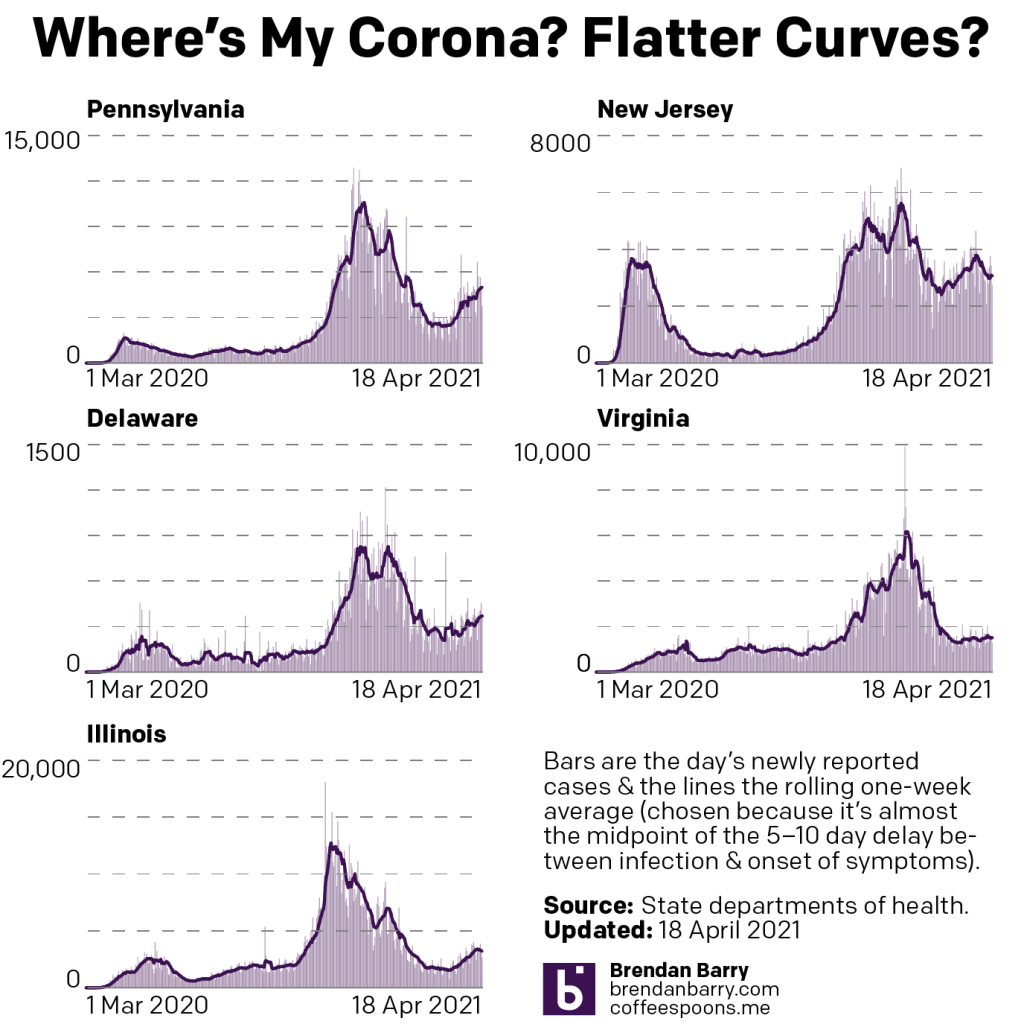
If we look at the new charts, we can see that broadly, New Jersey did continue its downward trend as Pennsylvania and Delaware experienced significant rises in new cases. Virginia remained fairly stable, but with a slight trend towards increasing numbers of new cases.
But New Jersey and now Illinois present some interesting trends to watch this coming week. Illinois reminds me of New Jersey in that despite rising numbers most of last week, the last few days (and of course the weekend) saw numbers lower than preceding days. You can see from the slightest of dips at the tail of the line the trend has flipped direction. Will the direction hold, however, once we start receiving weekday reporting figures starting Tuesday?
Back to New Jersey, though. The downward trend continued most of the week. But, the last several days could portend a reversal of sorts. For most of the last week, the state saw daily new case numbers increasing day after day. But the trend line, as it should, remained heading downwards. Until just a few days ago. If you look at the tail of the line there, you will see a slight uptick. This too will be something to watch in the coming week.
Deaths also need careful attention this week.
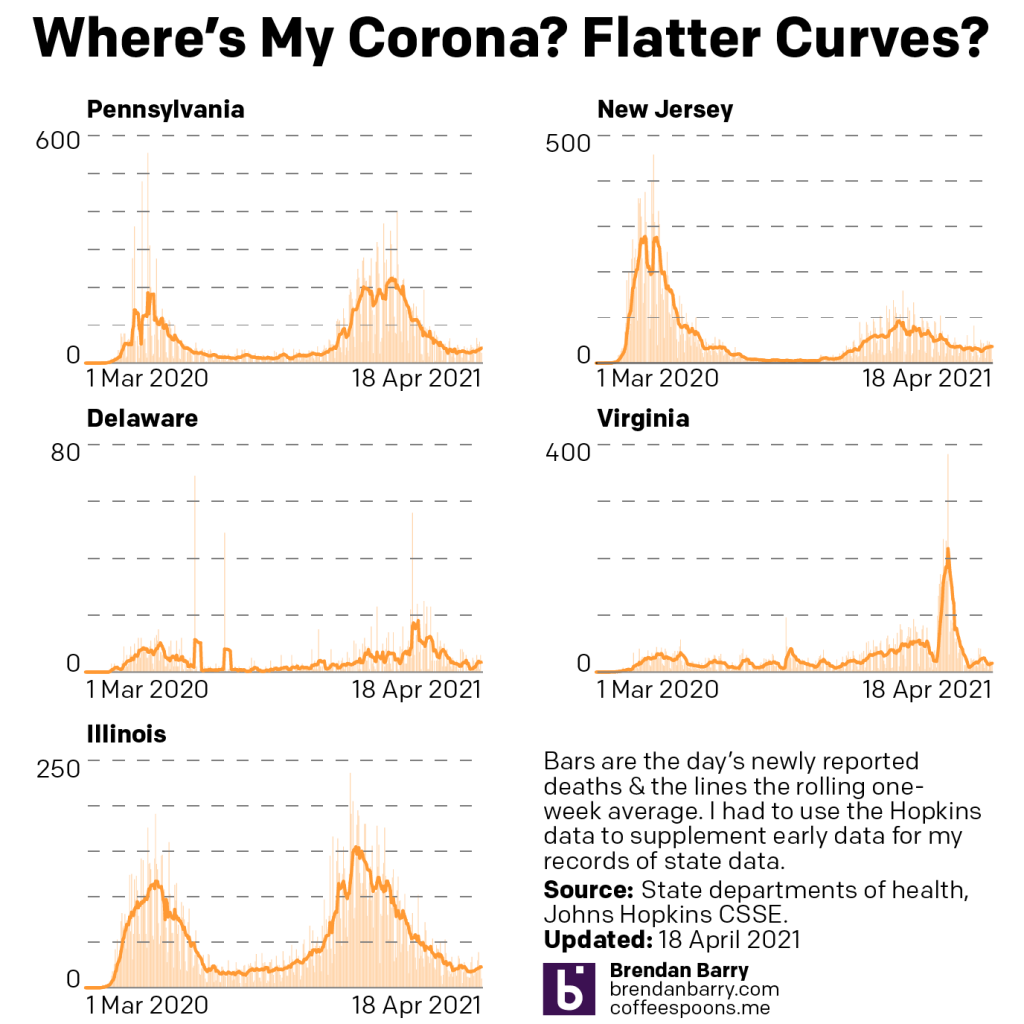
Last I asked the question, will deaths follow rising cases? After a week of data, the answer is unmistakably yes. However, unlike new cases, the increases are largely of a marginal number. Look closely at the ends of the lines for Pennsylvania, New Jersey, Delaware, and Illinois and you will see last week’s shallow rise continued.
Virginia bucked the trend with decreasing numbers of deaths. And of course marginal increases could easily give way to marginal decreases. Now I try not to mention too many daily numbers in these posts because I take the weekly view, but I will be closely following Pennsylvania this week. For the last several weeks, the Commonwealth regularly reported deaths on Sunday and Monday in the single digits. Yesterday Harrisburg reported 40. Is this a one-day surge of reports? Is the state resuming reporting more deaths at the weekend? Or does it portend something worse, a mores significant rise in the number of deaths?
Vaccinations continue apace. Although, I would expect to see some slowdown as the Johnson & Johnson vaccine pause ripples out across the vaccination programme.
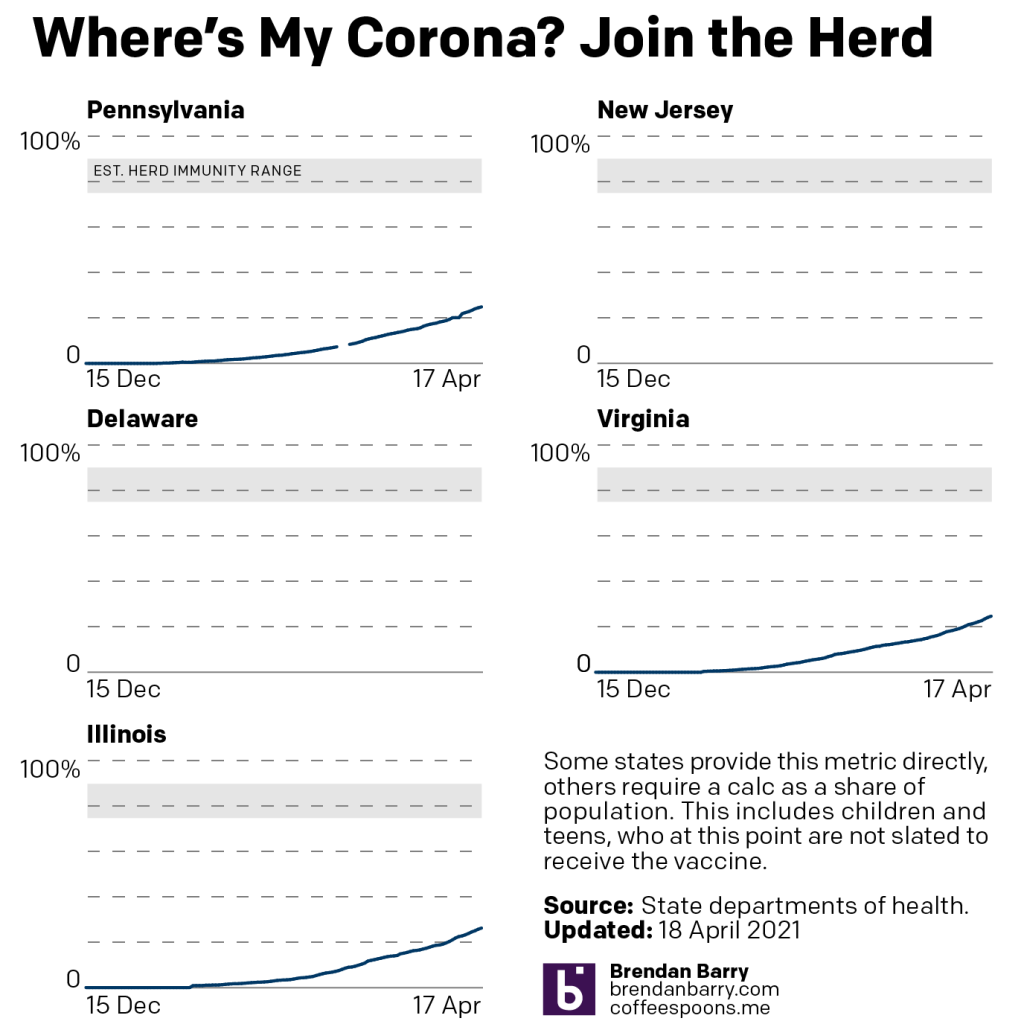
For now though we continue to see increasing numbers. Indeed, the three states I track have now all reached or should reach today 25% of their population as fully vaccinated.
One, that is good news.
But, two, this is just the beginning.
Last week in some tense questioning about when we can expect resumption of “normal”, Dr. Fauci provided a figure of 10,000 new cases per day across the US. (Currently we are about at 60,000 or so.) Vaccines will impede the transmission as they become ever more widely administered and fully implemented—remember that a first dose of a two-dose regimen does not mean you should be heading out and socialising.
At present, we have Pennsylvania averaging 5,000 new cases per day. In other words, Pennsylvania alone represents half of Dr. Fauci’s target. We are clearly far from that reopening level.
What I will be curious about in the coming weeks though is that interplay between new cases and vaccinations. If Illinois does begin to see a downward trend in new cases this week, how much of it is due to the state being 25% fully vaccinated?
That’s a complex question to answer, but at some point, increasing vaccinations will force new cases to reach an inflection point. First they will begin to bend downward, increasing more slowly instead of exponentially. Then with even more vaccinations a second point will be reached at which this new surge begins to finally turn and new cases drop.
The question is when.
Credit for the piece is mine.
Leave a Reply
You must be logged in to post a comment.