A brief bit of housekeeping, your author will be taking a brief holiday during which I won’t be posting. But I should return to posting next week.
Last week we looked at some relatively good news in terms of the spread of Covid-19 in the states of Pennsylvania, New Jersey, Delaware, Virginia, and Illinois. We had been watching some recent data that suggested some of the five states had begun to see a real and measurable slowdown in the rate of increase of new cases.
Where are we this week? Did those trends continue?
Kind of…
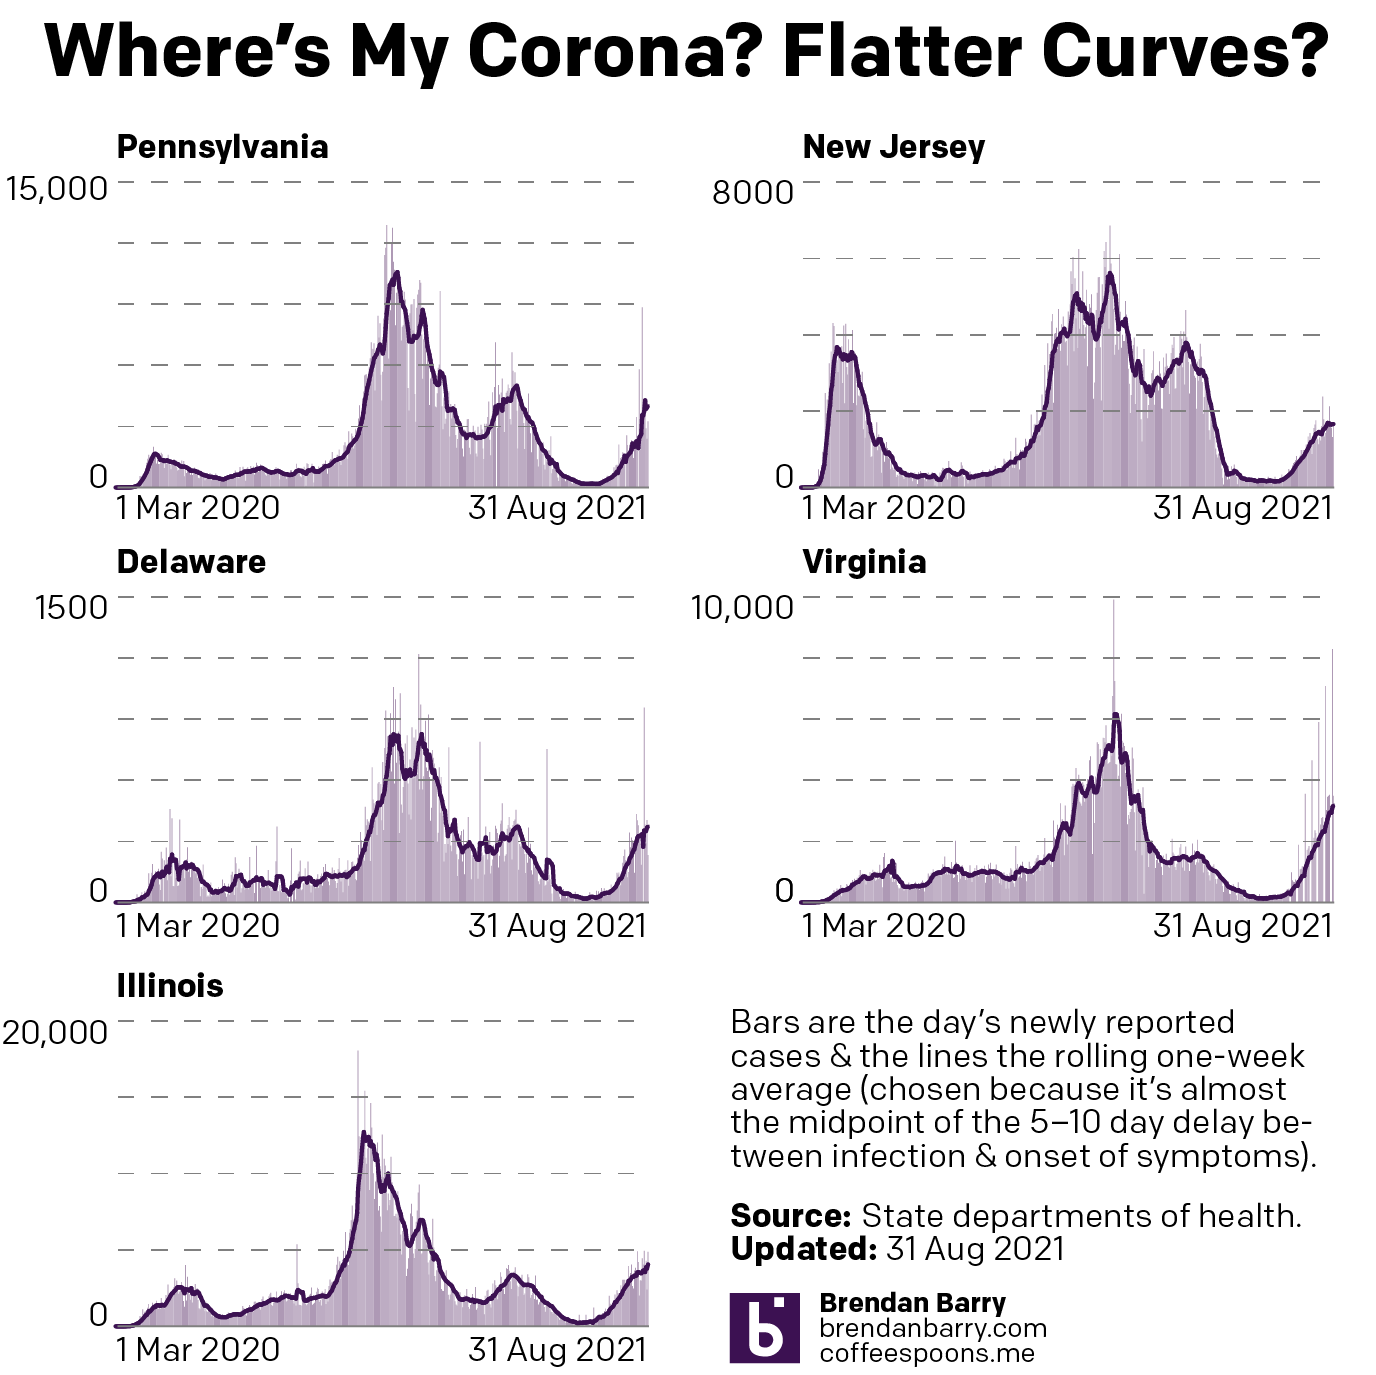
Starting with the bad news, we have Virginia. Old Dominion is now in the throes of a Covid wave worse than what it saw back in the Spring, and fast nearing the heights—maybe depths—of the winter wave. That wave peaked just under 6,200 new cases per day. (And fell to as low as 129 per day in mid-June.) Presently Virginia reports just under 3,200 new cases per day, or nearly half that previous peak. Unfortunately, we do not yet see any significant decline in the rate at which those case numbers have increased. The line in the graphic above is no longer curving upwards, instead you can describe it as more a straight line.
Somewhere below Virginia in that it’s not bad news, but it’s also not great news, we have Delaware and Illinois. In both states the unfortunate news remains that new cases continue to increase. But at present we can also see that new cases have begun to slow. In these states the curves have begun to flatten out, though they still tilt positive.
Contrast that to New Jersey, where we have good news. The Garden State looks similar to Delaware and Illinois, but the difference is the curve in New Jersey may have peaked. The line is now tilted negative. Of course, this is a very recent development and we would want to see this trend continue for a week or so before we begin to speak of New Jersey’s wave cresting.
But between New Jersey, Delaware, and Illinois, I would not be surprised if by the end of next week we begin to see new cases peaking and beginning to decline.
But what about Pennsylvania? Initially I would have placed the Commonwealth with Delaware and Illinois as it clearly had not peaked, but it did exhibit evidence that its curve was beginning to flatten. In recent days, however, as one can clearly see in the chart, the average has begun to shoot back up again. But as I cautioned last week, that’s not uncommon. Consequently, I want to see another week’s worth of data before we begin to talk about what direction Pennsylvania is taking.
In all this though, we do have one wildcard. This weekend we in the United States begin our Labour Day holiday. Will Labour Day gatherings and parties lead to increased spread of the virus? Will we have super-spreader events? Unfortunately we will not know for about a week or week and a half after the holiday.
As all this has been happening, we also have the death rate.
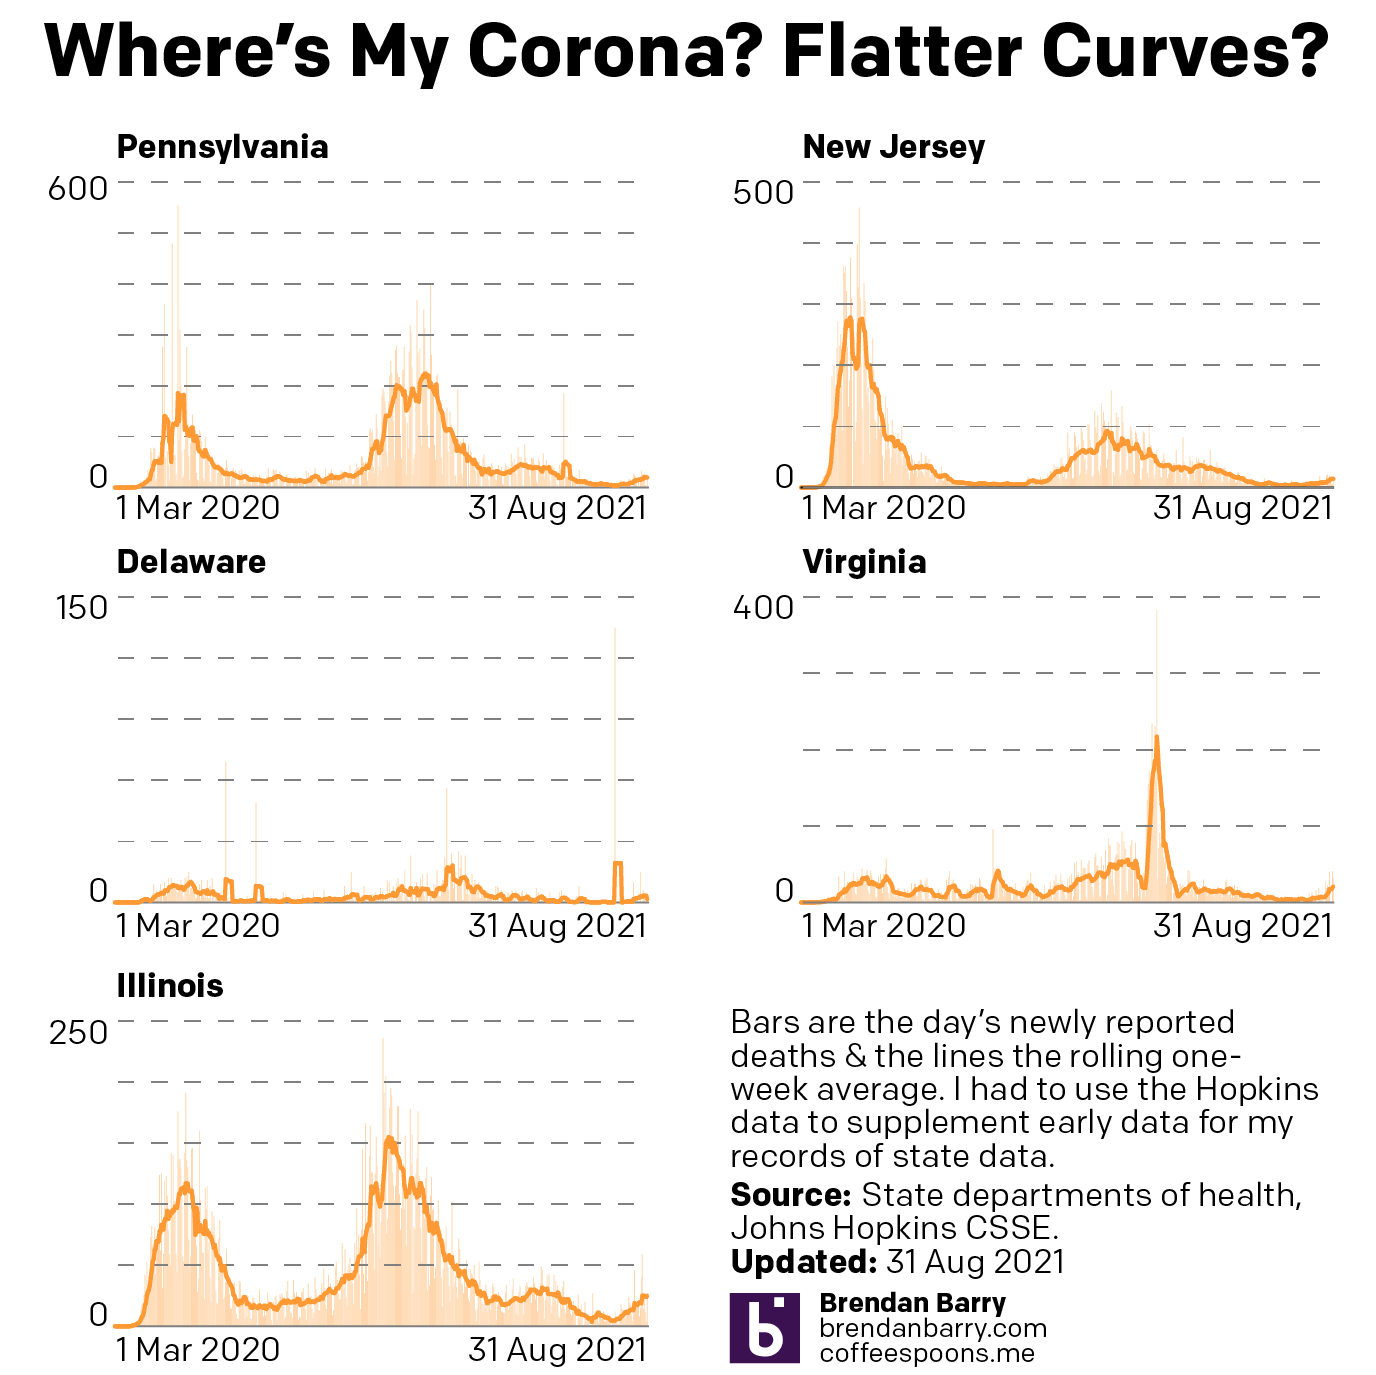
Last week I noted that we had begun to see rising numbers of deaths. This made sense given that deaths lag behind new cases. Early in the pandemic it often—not always—took a few weeks before people needed hospitalisation. Then a few weeks later is often—not always—when people would die. So a few weeks after the fourth wave began to take hold we continue to see rising numbers of deaths in all five states.
In Virginia and Illinois we see two of the most significant increases. In fact in the third wave, Illinois peaked at just under an average of 32 deaths per day. As of Tuesday the seven-day average was at just over 25. And with the current trend pointing towards increasing death, it’s possible we could see the fourth wave be more lethal in Illinois than the third.
Compare that to Virginia. Old Dominion saw a smaller death rate in the third wave, peaking at 18 deaths per day. However, just yesterday the state reached an average of 21 deaths per day. In other words, Virginia’s fourth wave has become more lethal than its third wave. Unfortunately, like in Illinois we continue to see deaths climbing and there is no evidence yet that deaths are slowing down.
In the tri-state area we see some slightly better news by comparison. In Pennsylvania and New Jersey deaths remain below their third wave peak. For example, in the third wave, Pennsylvania peaked at nearly 50 deaths per day. Yesterday the average was just below 20. Despite both states being below their third wave peaks, however, deaths do continue to climb.
Delaware is the exception here. With such a small population, it reached a third wave peak of about two deaths per day. At present it’s just reached three. But I would not say that three is significantly greater than two.
Overall, however, I expect to see deaths continue to climb over the next week or two until these slowing rates of new cases begin to create slowing death rates. And so I am hopeful that in the coming few weeks we will begin to see the new case rates slow, peak, and begin to decline by about mid-September. That’s more likely in places like New Jersey, Delaware, and Illinois, but if we’re lucky those patterns or similar will soon begin to emerge in Pennsylvania and Virginia.
Credit for the piece is mine.
Leave a Reply
You must be logged in to post a comment.