Last time we looked at the state of the Covid-19 pandemic in Pennsylvania, New Jersey, Delaware, Virginia, and Illinois we had some encouraging signs. In particular we had evidence of a potential slowdown in New Jersey, Delaware, and Illinois and I wrote that I would not be surprised if we saw a peak in new cases. Virginia was the only state where things were bad and getting worse, though the rate at which they were getting bad had begun to slow. Finally, Pennsylvania had some conflicting data with its new cases and I wanted to see another week’s worth of evidence.
So a week or later, where are we?
First, the obvious caveat that the Labour Day holiday may affect these numbers in both the short term collection of data and the medium term potential for a surge of new cases from gatherings and parties.
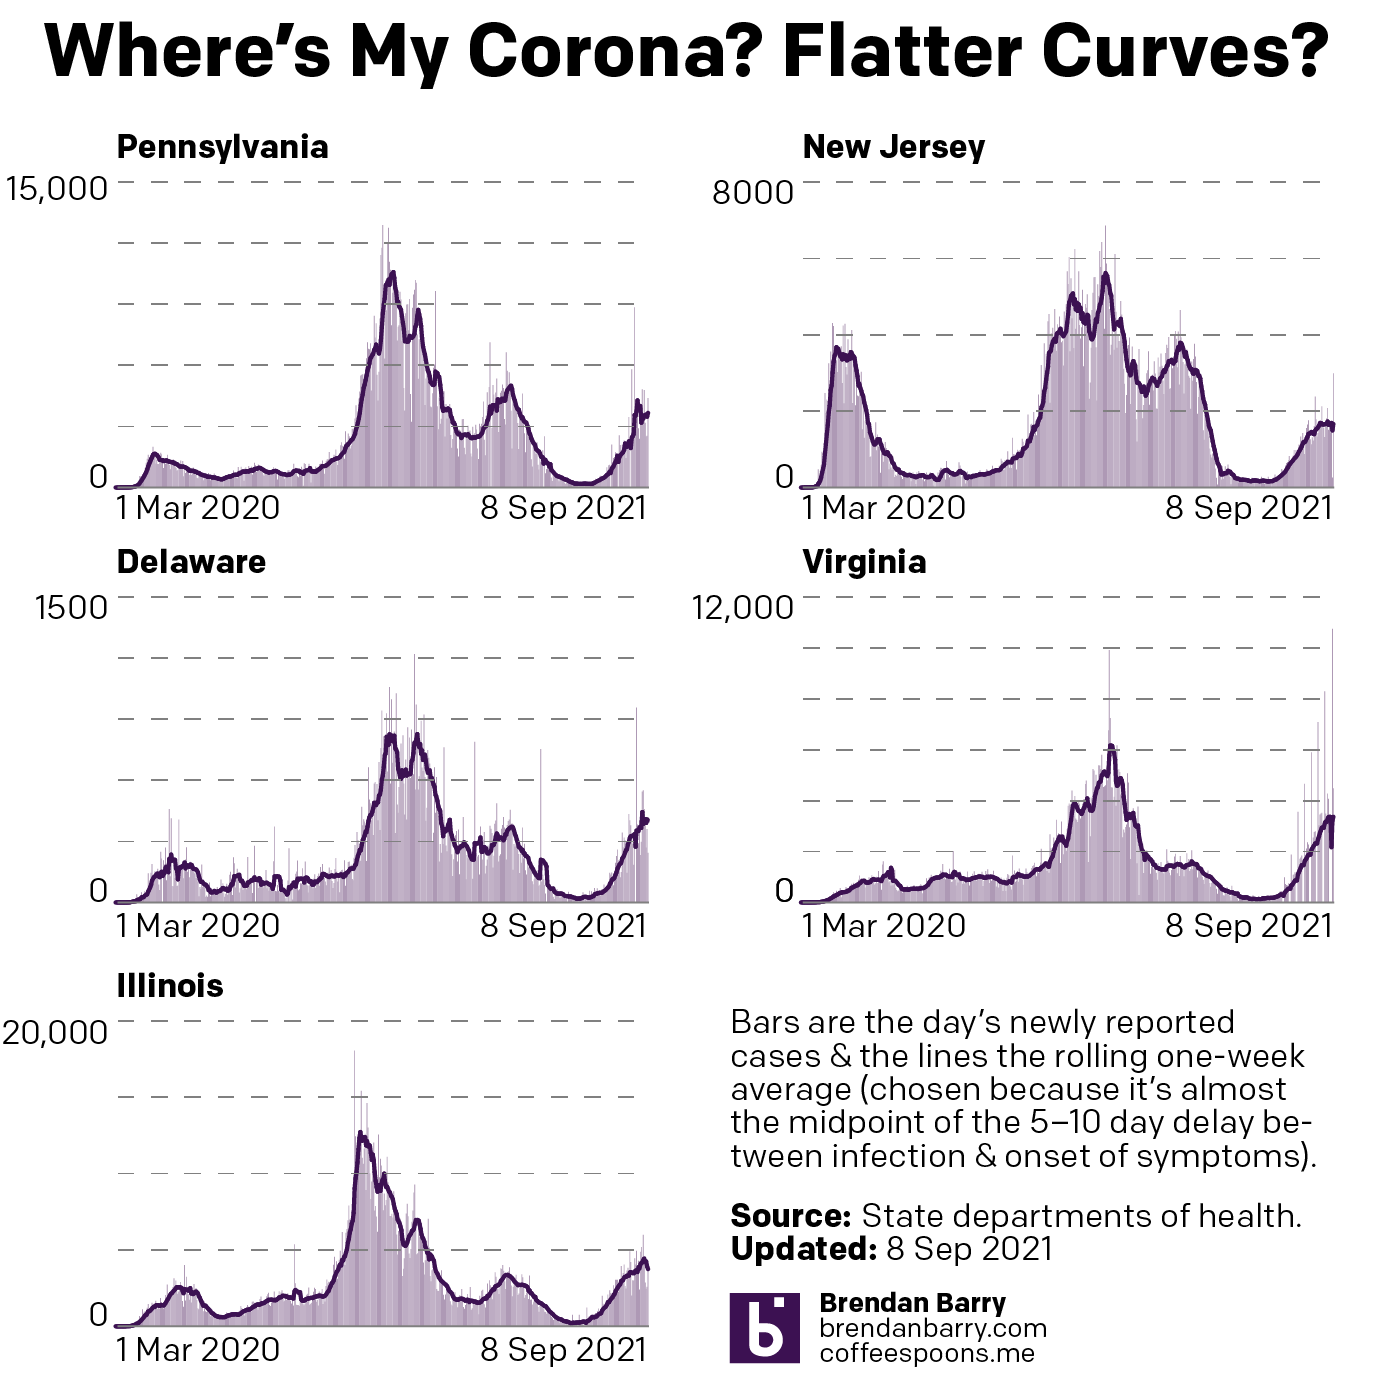
If we look to last week’s good news states of New Jersey, Delaware, and Illinois, we do indeed see what we’ve long been waiting for since this summer: potential peaks in this fourth wave. New Jersey and Illinois. We can see the trend most clearly in New Jersey and Illinois where the beginnings of a decline from the peak appear as a slight dip from what we hope was the peak of the fourth wave. In Delaware that peak is still apparent, but the decline is less so.
Additionally for Delaware, over the last week the numbers rose above those of the third wave, i.e. in terms of cases the fourth wave is worse than the third wave of the spring. We had already seen Illinois reached that unfortunate milestone and fortunately for New Jersey the Garden State peaked at a point nearly half of the third wave’s peak.
What about last week’s bad news state? Well, Virginia, which does not report data on weekends, had an additional day of zero earlier this week. You can see that with the peak on Tuesday, which exceeded 10,000 new cases in one day. Of course, that’s really over three days and so we are talking about 3,000 per day. Unfortunately that extra holiday affected the seven-day average and caused a sudden fall. If we look closely at the data we can see that the trend probably points to a situation that continues to worsen. Two weeks ago the seven-day average was generally about 2800; last week it was about 3100; and heading into this week—excluding the Labour Day aberration—it looks to be about 3300. The very rough differences of 300 to 200 could point to a slowing rise in new cases, the necessary precursor to a peak, but we’d need to see how the rest of this week plays out before we can make any determination. But I’d probably say we are beginning to see the first signs of arriving at a peak in the coming weeks, maybe not next but perhaps in two or so.
And then we have Pennsylvania, where we had conflicting data and I wanted another week’s worth before making comment. I think the Commonwealth has indeed peaked, but unlike in New Jersey, Delaware, and Illinois, this peak looks more complicated. Note how we do have the recent spike I alluded to last week, but subsequent to that spike the numbers have been lower. I say complicated because in the aftermath of the holiday weekend we are seeing a slight tick upwards in the number of new cases, but it’s still below that spike. Consequently I’m reasonably confident we’ve just begun to peak here in Pennsylvania, but I’ll clearly want another week’s data before saying that with more authority.
What about deaths? How have those progressed over the last week?
Here too I’d be remiss if I failed to reiterate the caveats above that Labour Day can skew with the seven-day average—as we saw with Virginia—though any clustering of a surge of deaths would likely be weeks away given death’s status as a lagging indicator.
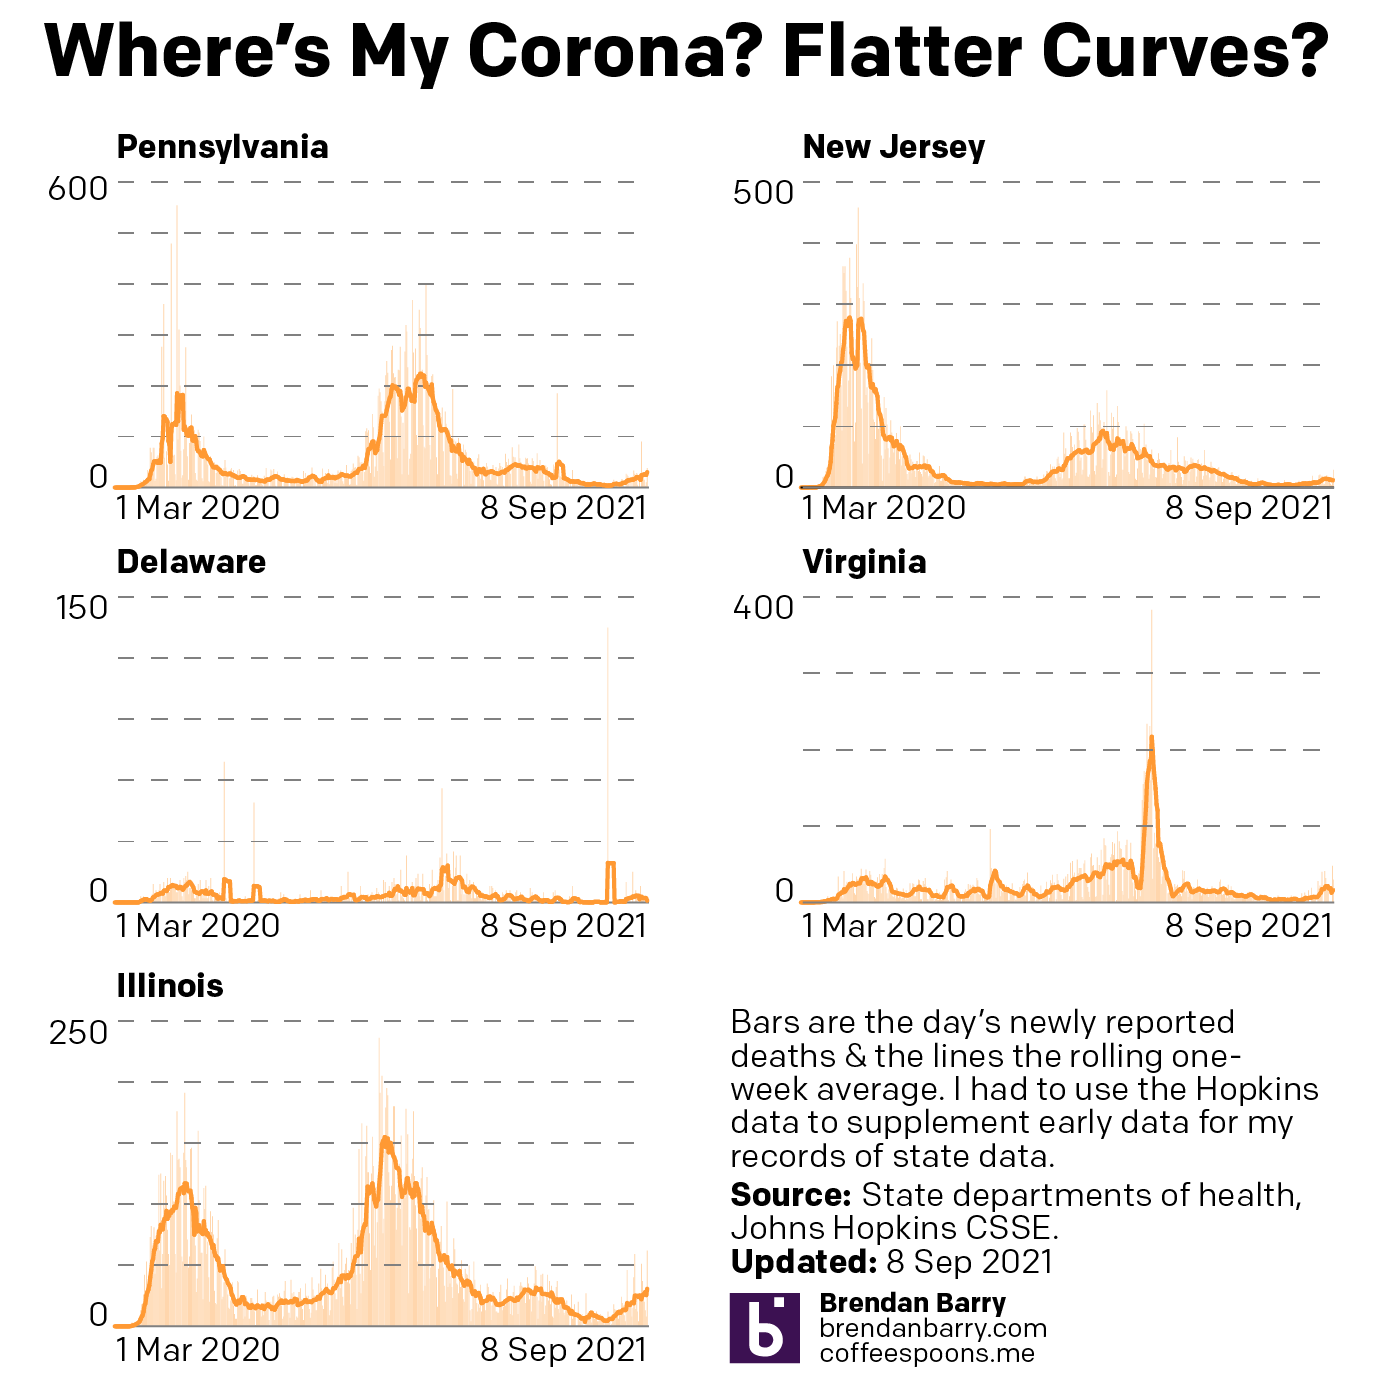
Here, unfortunately, we have not reached peak deaths for the fourth wave, at least not for all five states.
Starting with the bad news, we have two states where the numbers continue to climb. In Pennsylvania and Illinois, the two largest states in the data set, we have deaths continuing to climb. Both states’ averages exceeded 30 deaths per day yesterday. For Pennsylvania that is the first time since early June. We need not go much further back for Illinois, which had last recorded an average of 30 deaths per day in late May.
In fact, Illinois yesterday reached an average of 30.7 deaths per day. The state’s peak during the third wave was not much higher, 31.7. Given that we are seeing higher numbers of new cases in the fourth wave than we saw in the third, I would expect the deaths to continue climbing and exceed the third wave’s death rate in coming days.
Pennsylvania’s seven-day average peaked at 51 deaths per day earlier this summer and the Commonwealth’s average of 30.1 yesterday is still far below that level. Given that this fourth wave appears to be less severe in terms of new cases than the third wave, I doubt we reach the level of 51 per day, but I wouldn’t put a level in the 40s out of reach.
Next we have three states where we probably have some good news. Delaware is probably the easiest to report. Since the state has so few people with which to begin, we can expect to see fewer deaths. Indeed, this fourth wave may have peaked and did so at only 3.4 deaths per day. But yesterday that number fell to 0.9. However, I wonder if that is due to the Labour Day holiday. I would want to see more data before saying with more authority that Delaware may have peaked in terms of deaths.
Virginia and New Jersey both present cases where the seven-day averages are now down from some high numbers about two weeks ago. In late August, New Jersey reached a level of 14.3 deaths per day and Virginia hit 21.4. Yesterday’s averages had each state at 12.4 and 16.6, respectively. That looks good. But we can also see that in the last two days both states reported their highest number of daily increases since the beginning of the fourth wave. Yesterday New Jersey reported an additional 29 deaths. Virginia reported 30 yesterday, not the highest, but for that we need look only to the day before when it reported 48.
In other words, I want to see if these recent high numbers of new deaths are the result of delays from Labour Day or if we are beginning to see an actual reversal in the trend. Both at this point appear plausible. I would suspect, however, that New Jersey, given its peaked number of new cases, is more likely to be on actual downward trend in deaths. That said, given the recentness of that peak, I would still expect deaths to rise. I want another week’s worth of data to better evaluate the Garden State.
Virginia seems pretty clear to me, the most likely cause in the dip in deaths of late relates to the holiday. With the numbers of new cases continuing to climb and a peak appearing to be at least a few weeks away, Virginia probably can expect deaths to resume climbing for a bit more time. And of course this wave is already worse, in terms of deaths, than the third wave. Unfortunately I think that story line will only get stronger.
Credit for the piece is mine.
Leave a Reply
You must be logged in to post a comment.