This past weekend the United States surpassed one million deaths due to Covid-19. To put that in other terms, imagine the entire city of San Jose, California simply dead. Or just a little bit more than the entire city of Austin, Texas. Estimates place the number of those infected at about 80 million. Back of the envelope maths puts that fatality rate at 1.25%. That’s certainly lower than earlier versions of the virus, which has evolved to be more transmissible, but thankfully less lethal than its original form.
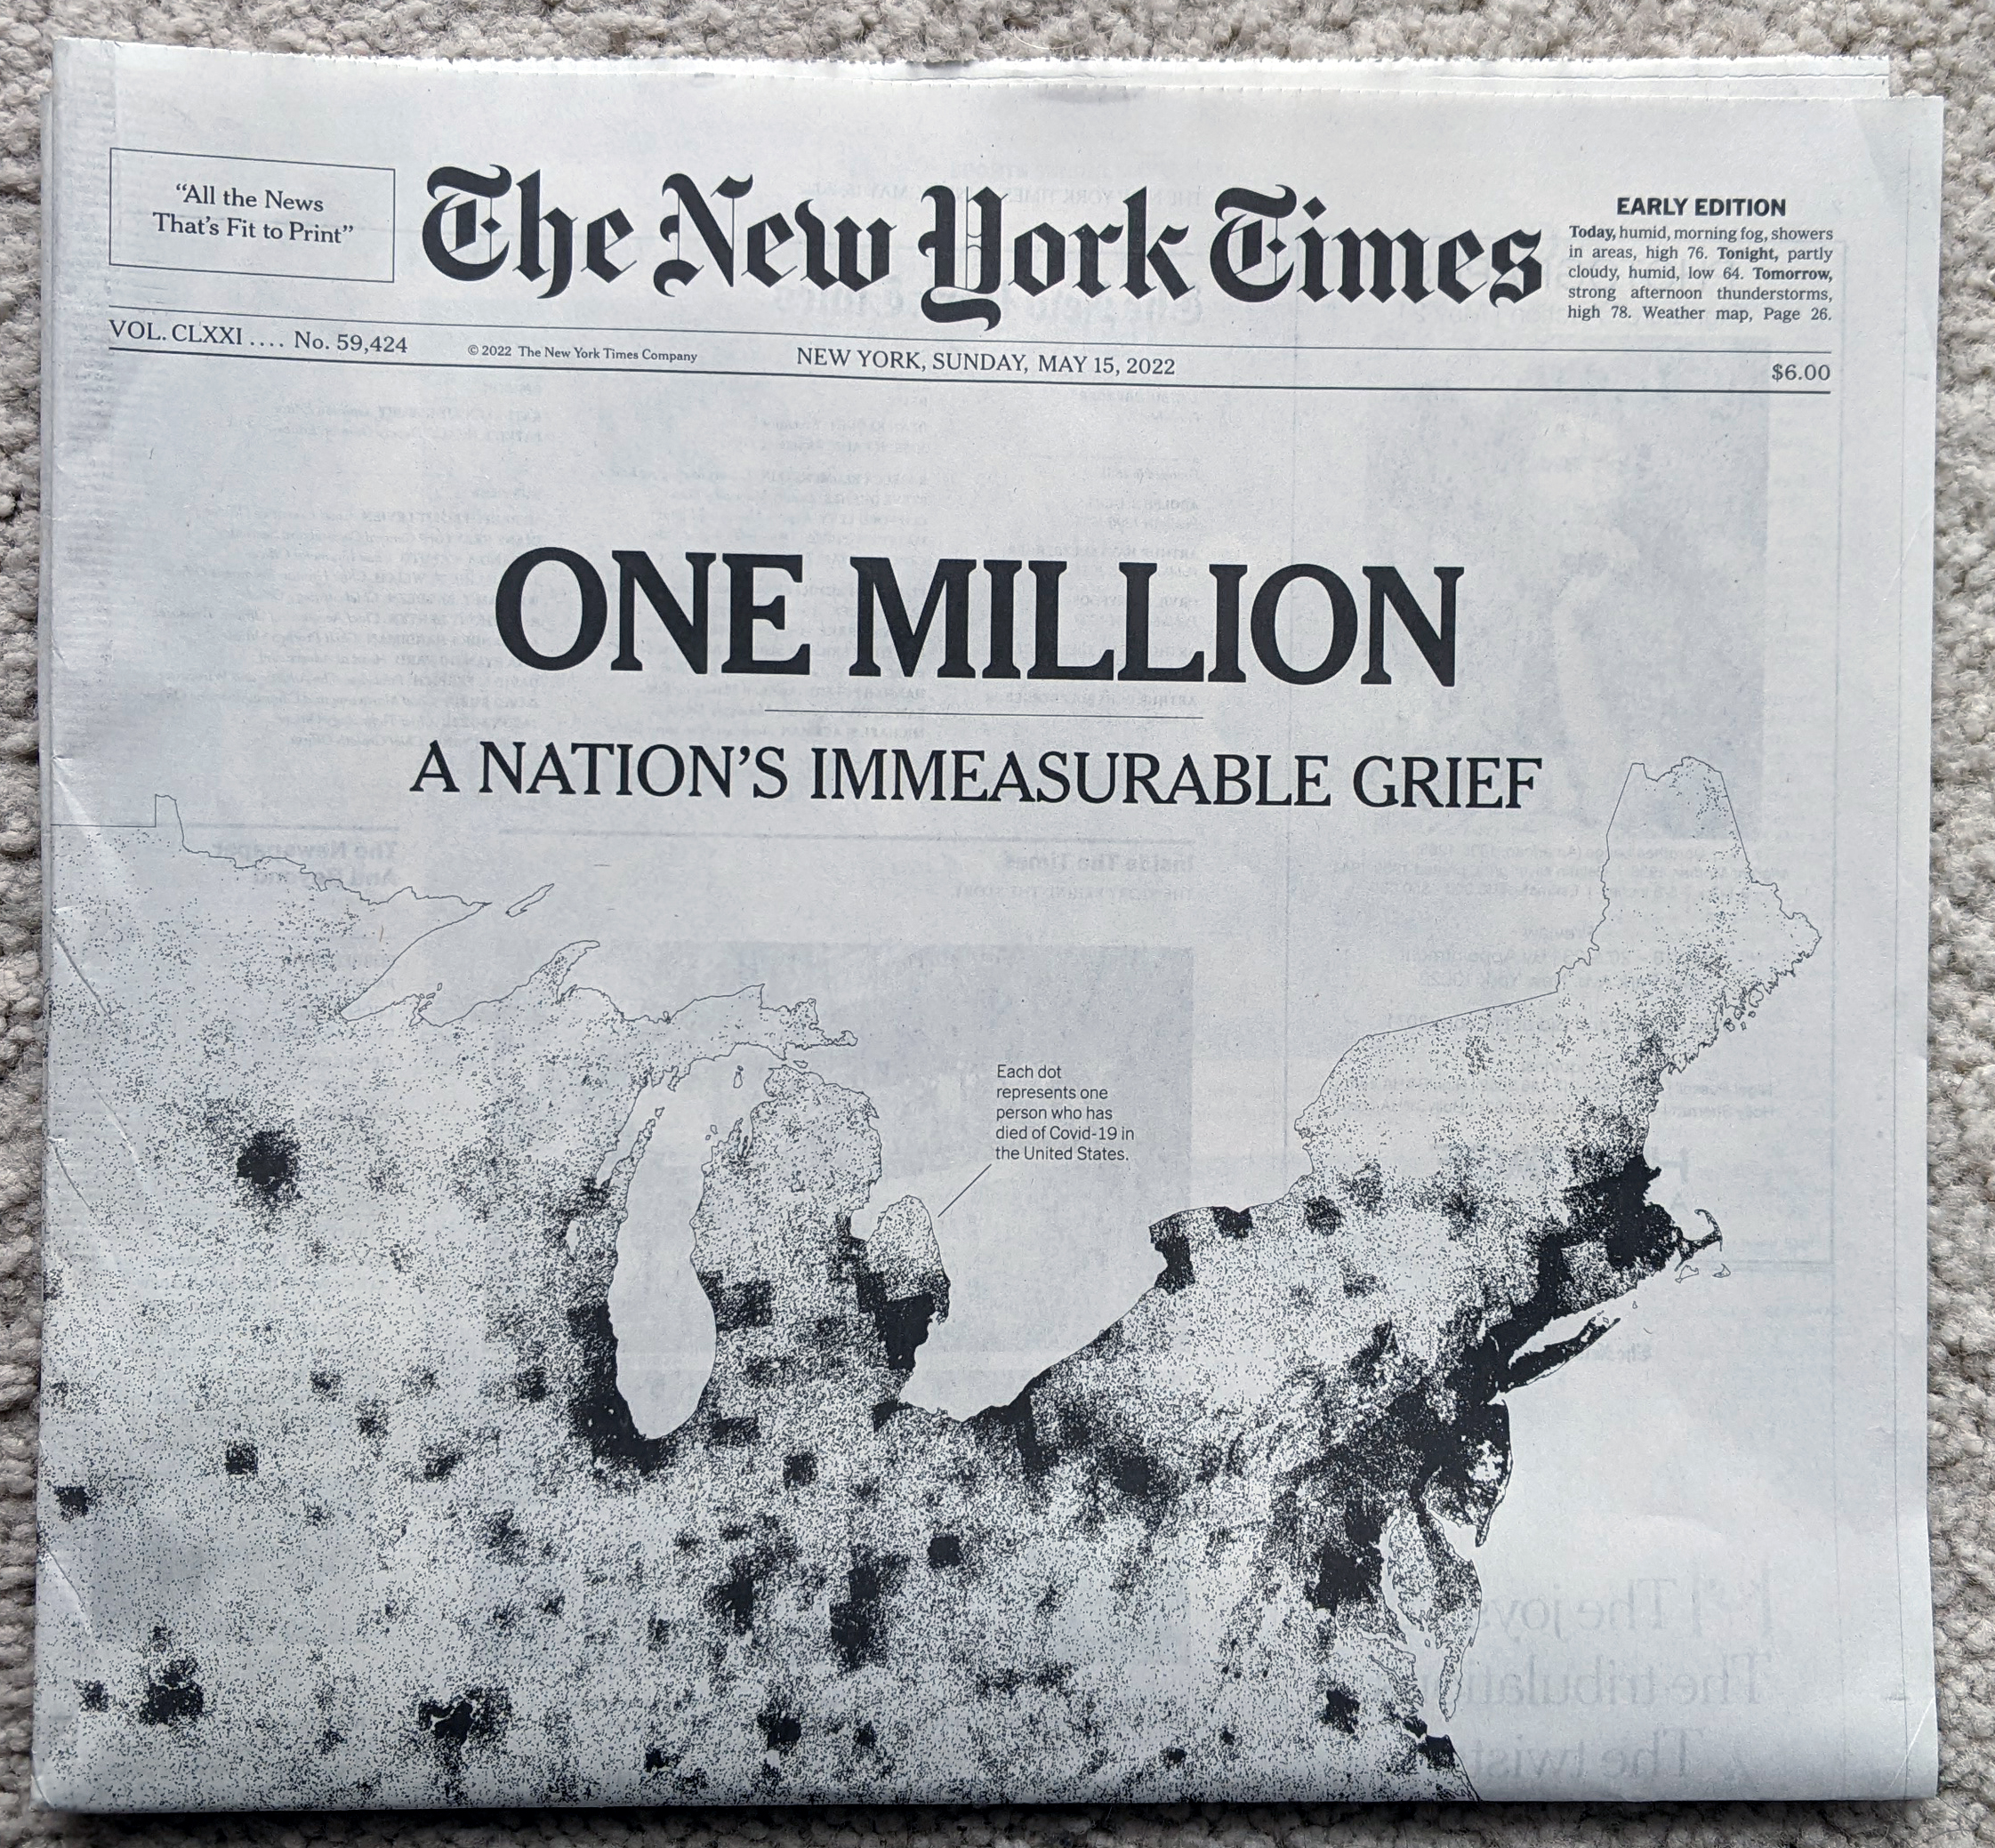
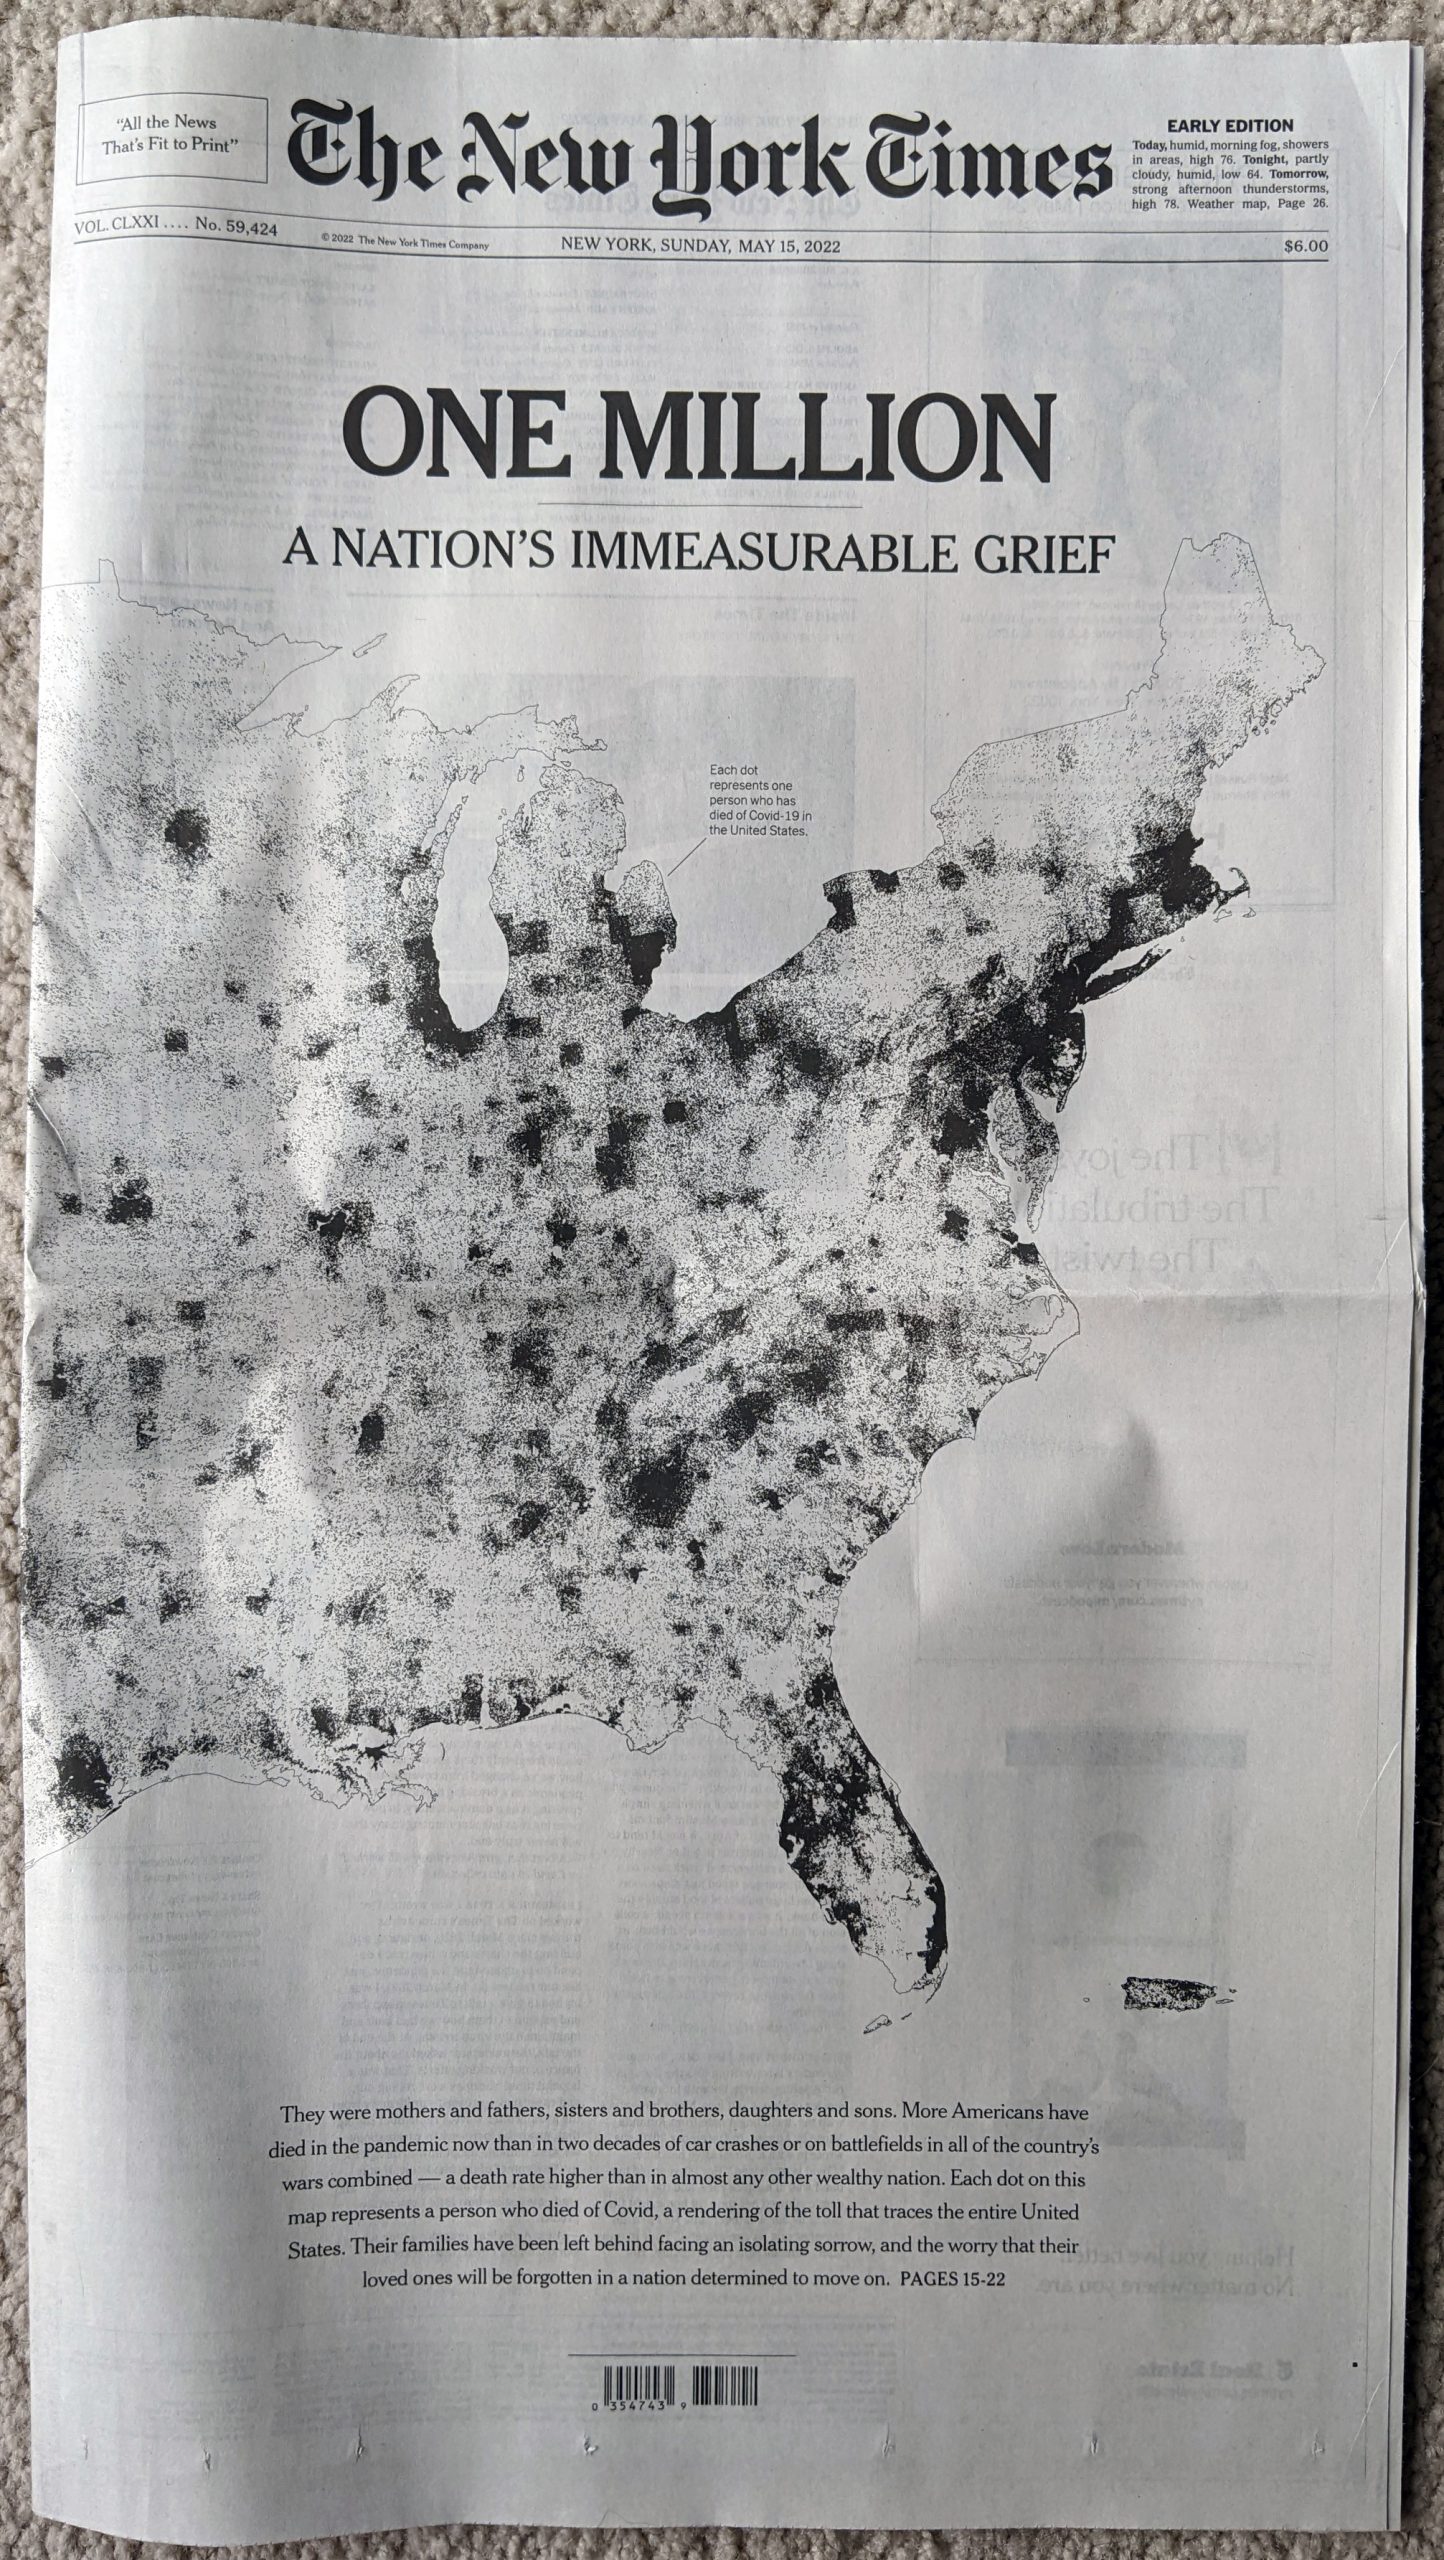
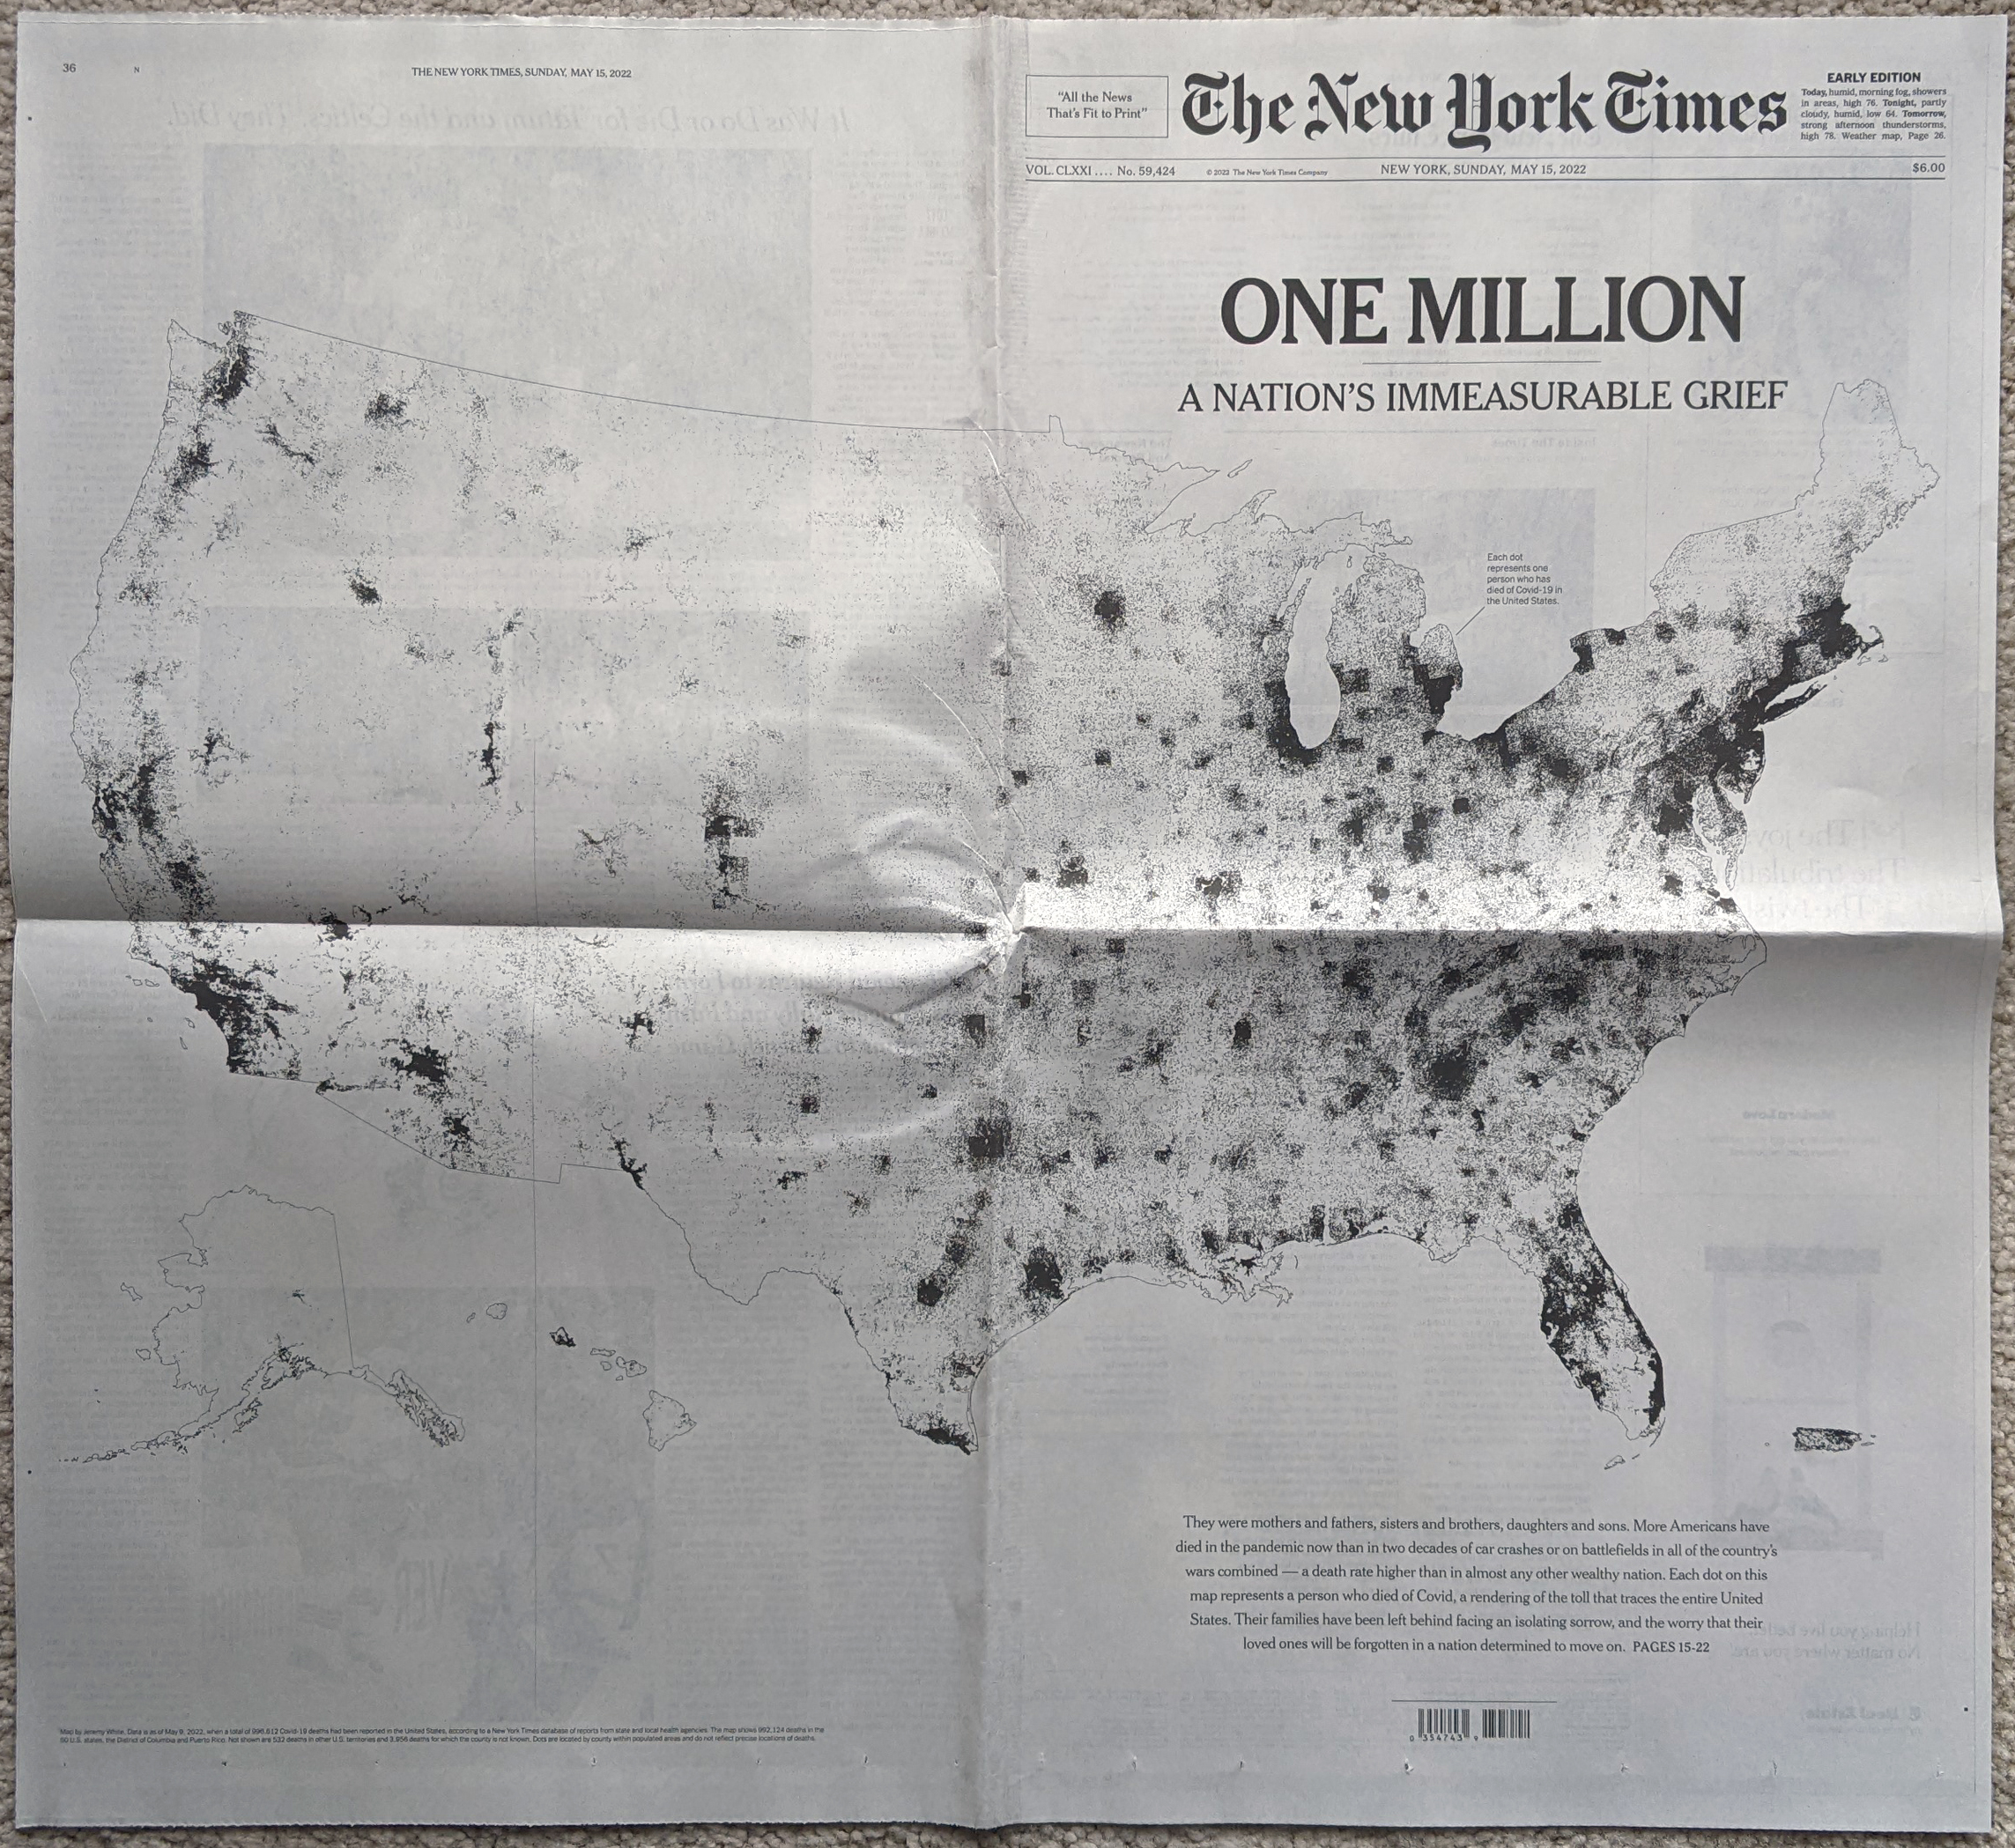
Sunday morning I opened the door to my flat and found the Sunday edition of the New York Times waiting for me with a sobering graphic not just above the fold, nor across the front page. No, the graphic—a map where each dot represents one Covid-19 death—wrapped around the entire paper.


You don’t need to do much more here. Black and white colour sets the tone simply enough. Of course, a bit more critically, these maps mask one of the big issues with the geographic spread of not just this virus but many other things: relatively few people live west of the Mississippi River.
Enormous swathes of the plains and Rocky Mountains have but few farmers and ranchers living there. Most of the nation’s populous cities are along the coast, particularly the East Coast, or along rivers or somewhat arbitrary transport hubs. You can see those because this map does not actually plot the locations of individual deaths, but rather fills county borders with dots to represent the deaths that occurred within those limits. That’s why, particularly west of the Mississippi, you see square-shaped concentrations of deaths.
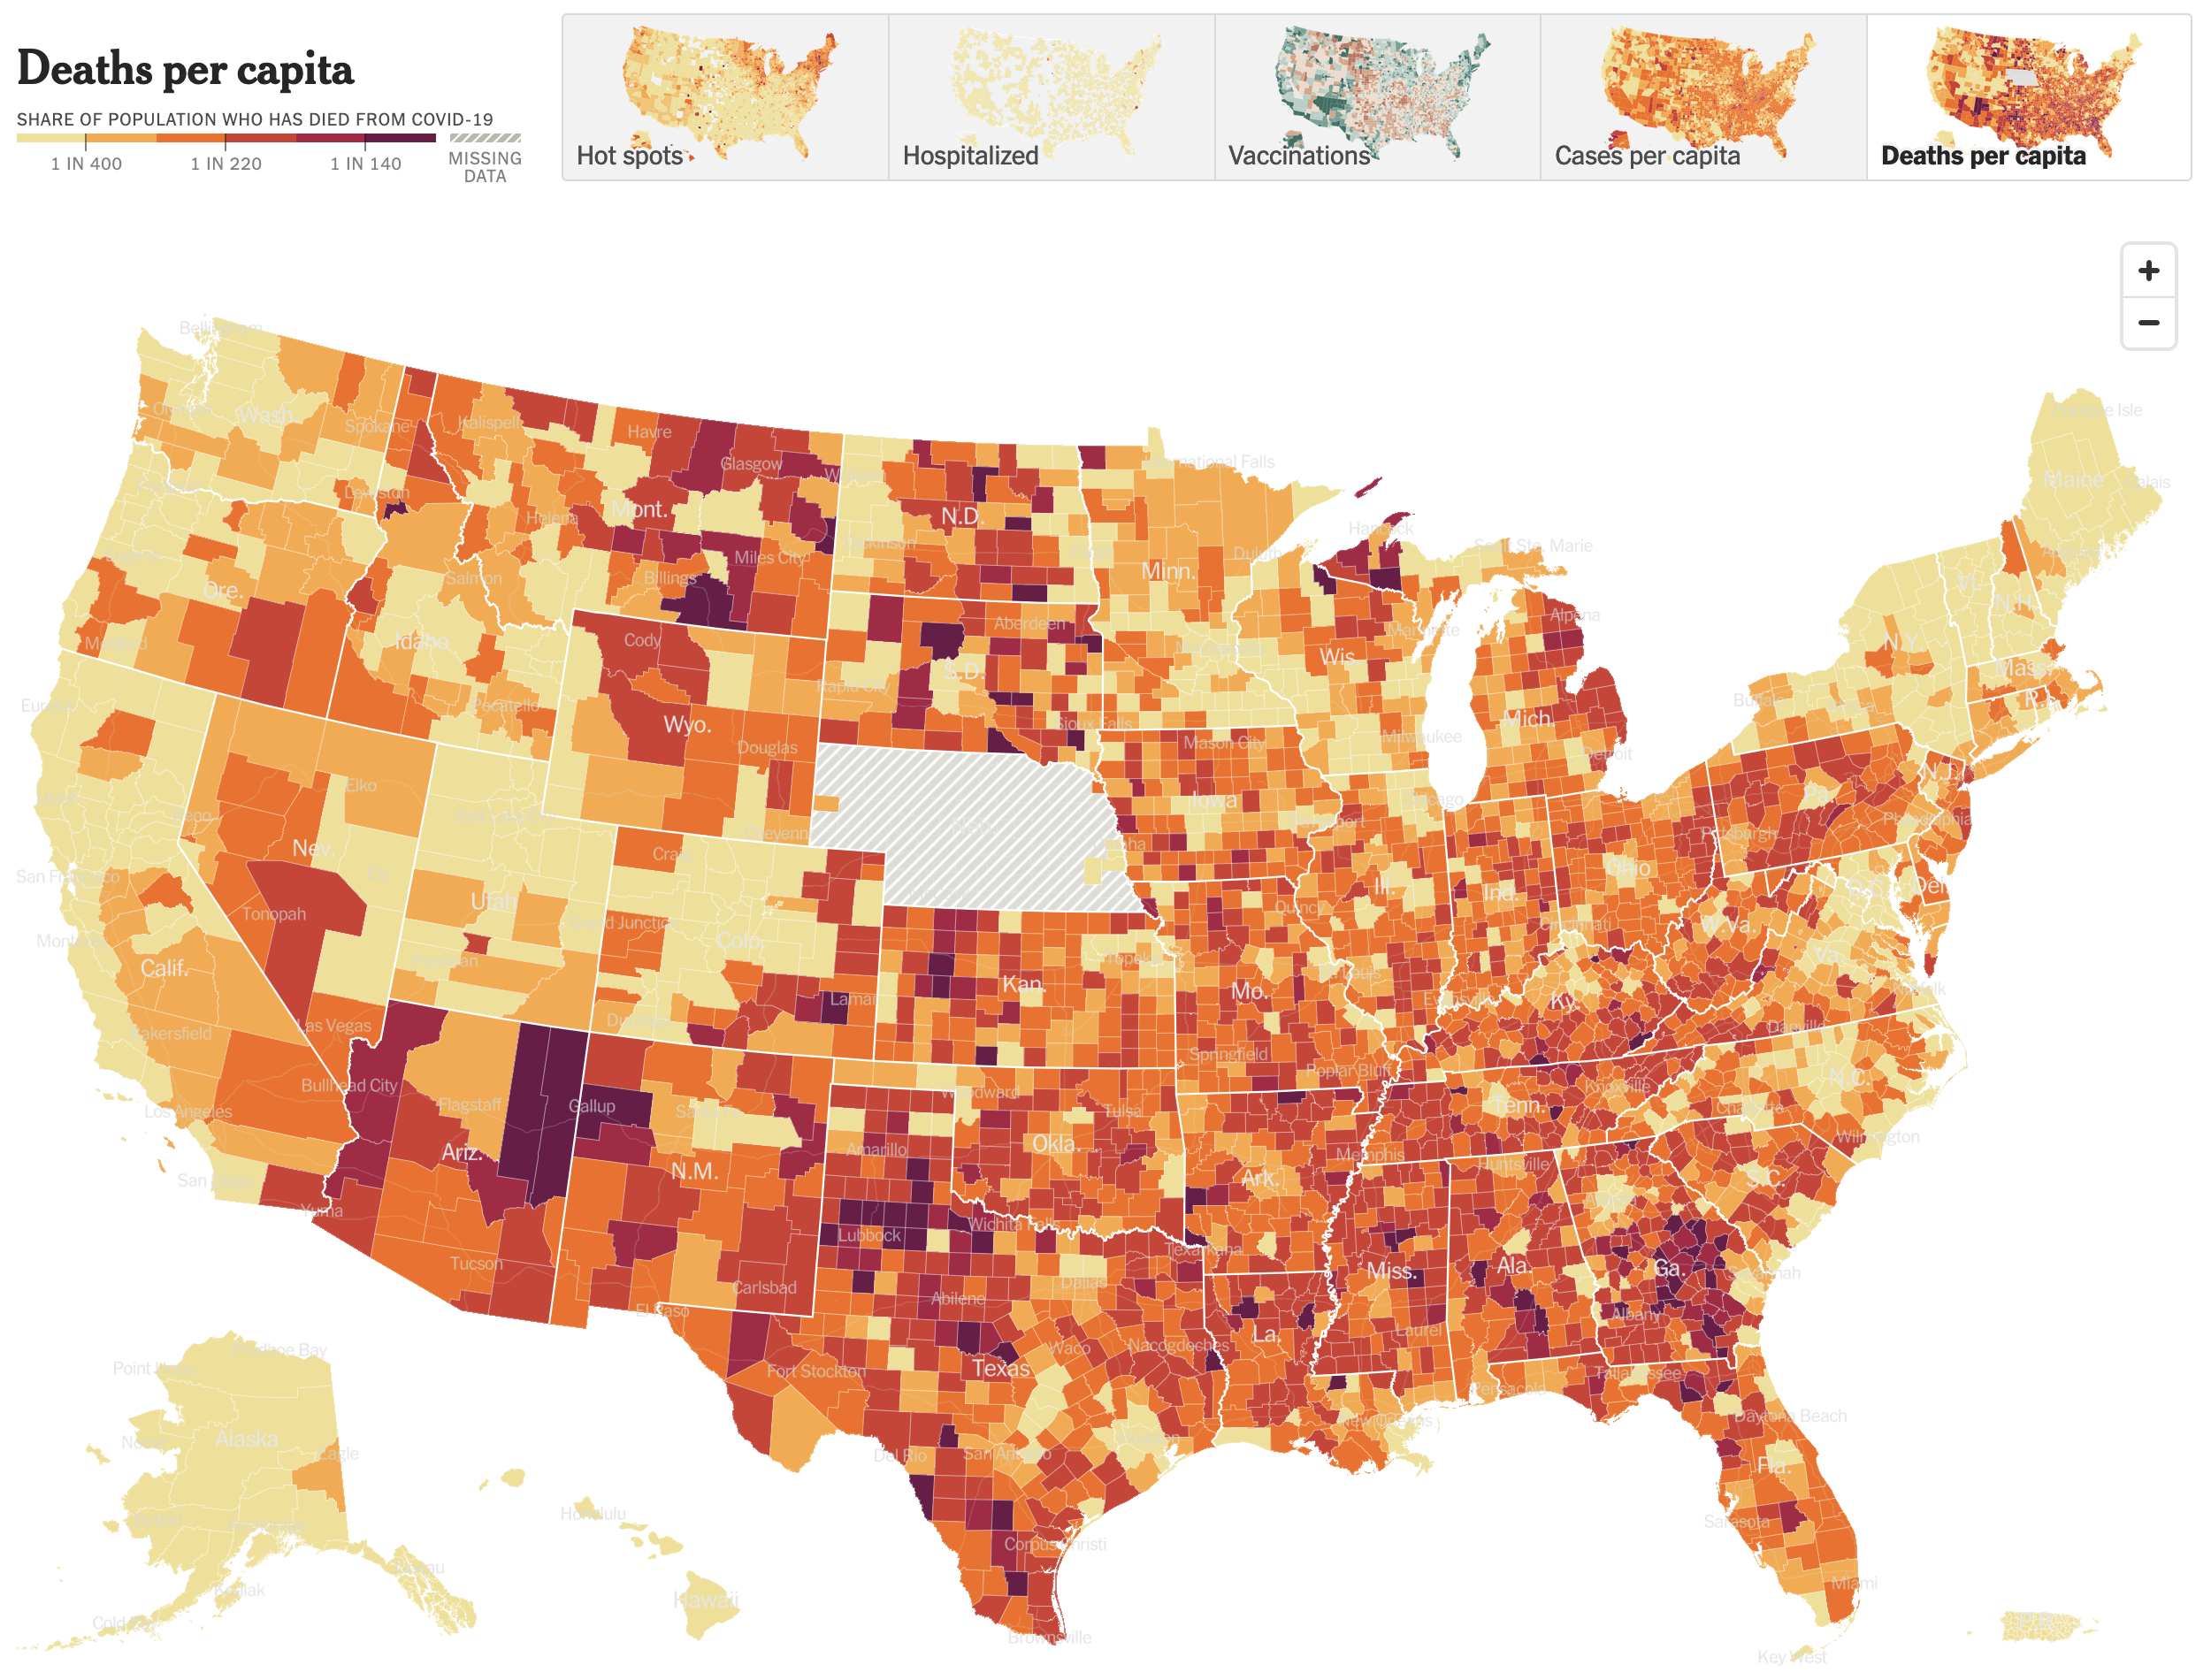
A choropleth map that explores deaths per capita, that is after adjusting for population, shows a different story. (This screenshot comes from the New York Times‘ data centre for Covid-19.

The story here is literally less black and white as here we see colours in yellows to deep burnt crimsons. Whilst the big map yesterday morning concentrated deaths in the Northeast, West Coast, and around Chicago we see here that, relative to the counties’ populations, those same areas fared much better than counties in the plains, Midwest, and Deep South.
A quick scan of the Northeast and Mid-Atlantic states shows that only one county, Juniata in Pennsylvania, fell into the two worst deaths per capita bins—the deeper reds. Juniata County sits squarely in the middle of Pennsyltucky or Trumpsylvania, where Covid countermeasures were not terribly popular. No other county in the region shares that deep red.
Look to the southeast and south, however, and you see lots of deep and burnt crimsons dotting the landscape. This doesn’t mean people didn’t die in the Northeast, because of course they did. Rather, a greater percentage of the population died elsewhere when, as the policies enacted by the Northeast and West Coast show, they didn’t need to.
After all, injecting bleach was never a good idea.
Credit for the piece goes to Jeremy White.

One thought on “One Million Covid-19 Deaths”
Comments are closed.