to be overturned by the Supreme Court, as seems likely, states have been busy passing laws to both restrict and expand abortion access. This article from FiveThirtyEight describes the statutory activity with the use of a small multiple graphic I’ve screenshot below.
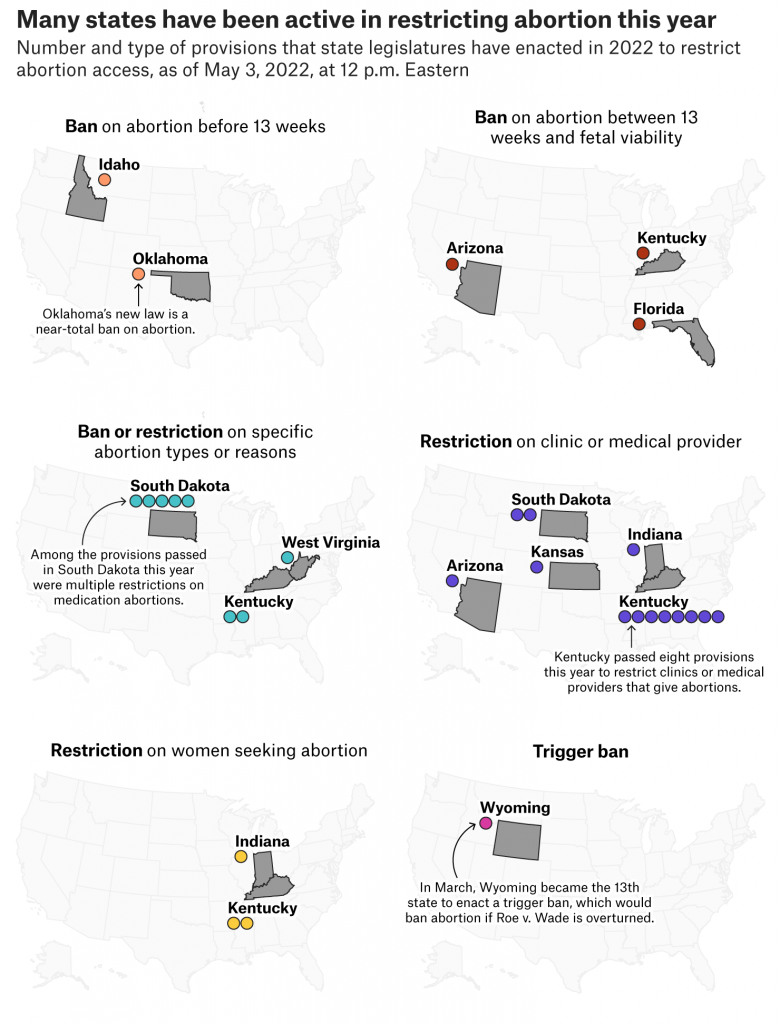
Each little map represents an action that states could have taken recently, for example in the first we have states banning abortion before 13 weeks, i.e. a nearly total ban on abortion. It uses dots, for this map orange, to indicate legislative acts to that effect. But if states have passed multiple legislative acts, e.g. South Dakota when it comes to banning specific types or reasons for abortion, multiple dots are used.
I generally like this, but would have liked to have seen an overview map either at the beginning or end that would put all the states together in context. Dot placement, especially for states like Kentucky, would be tricky, but it would go a way to show how complex and convoluted the issue has become at the state level.
Credit for the piece goes to Ryan Best.