I spent the last two weeks out of town, and my post for the Friday before didn’t happen because there was a fire at my building—I and my unit are fine—that knocked out internet for about 24 hours. But now I have returned.
One of the things I did was visit the city of Pittsburgh in western Pennsylvania. There I discovered the city has a World War II era submarine, the USS Reqin, a Tench-class submarine that launched at the end of the war and saw no active combat. She was later preserved and arrived at the Carnegie Science Centre in Pittsburgh where she serves as a museum ship.

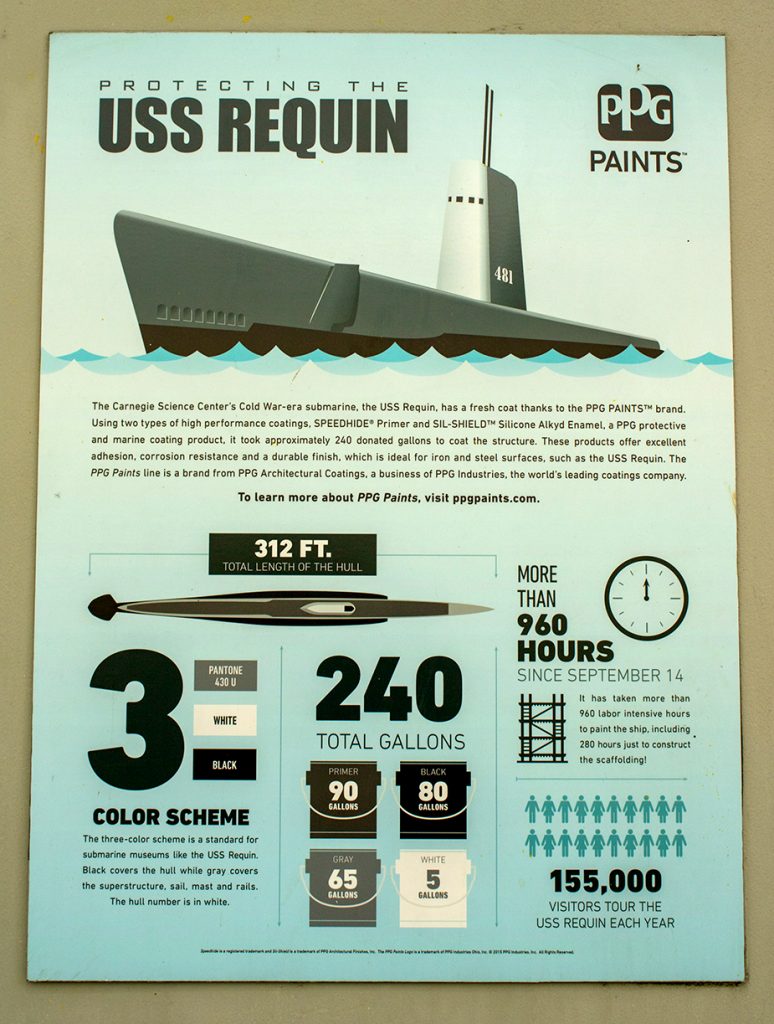
As I waited for the self-guided tour to begin, I spotted a small poster with some big numbers. Naturally I investigated and found it to be a marketing piece by PPG, a Pittsburgh-based paint and coatings company. The poster detailed the work that went in the preservation of the submarine’s exterior using PPG’s own paints and coatings.

We can see the large numbers clearly and to the piece’s credit the hierarchy works. What are we talking about? Three paints applied to the submarine in these quantities in this amount of time. The only factette not totally relevant is how many tourists annually visit the submarine.
Design wise, the poster does a nice job of dividing up its space into an attention-grabbing upper-half. After all, it grabbed my attention. The lower half then subdivides into three columns that speak to the aforementioned subjects. The last column then divides again into halves.
As marketing design does, it’s not the most offensive. For example, we don’t have the gallon buckets sized or scaled differently. The designers used a restrained palette and kept a consistent typographic treatment.
Admittedly, I was a bit disappointed because I had thought it would be some facts or data about the submarine itself. But for what the piece is, I thought it did a nice job.
Credit for the piece goes to PPG’s graphics department.
