Many of us have pent up travel demand. Covid-19 remains with us, lingering in the background, but it’s largely from our front-of-mind. For those of my readers in Europe, or just curious how superior European rail infrastructure is over American, this piece from Benjamin Td provides some useful information.
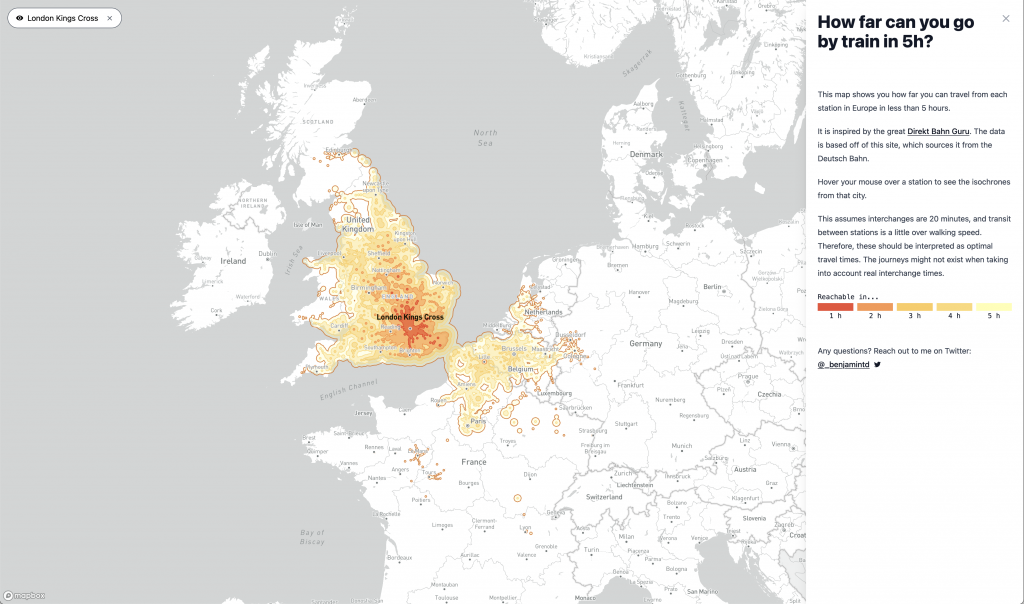
It uses isochrones to map out how much a traveller could travel if he would travel five hours. For this screenshot I chose London’s King’s Cross station. In red we see distances within a one-hour rail ride from said station. In the lightest yellow are those places within the five-hour distance.
The interactive map allows users to investigate stations throughout Europe. Mousing over various parts brings up different stations. Clicking on the station freezes the station on the map allowing the user to zoom in or out and investigate different areas of Europe.
Colour-wise, things work well. The desaturated map allows the yellow-to-red palette to shine. And to the right a closable legend, which unfortunately cannot be reopened once closed for the only real blemish on the piece. Even typographically, the labels appear in grey whereas selected stations appear in black.
A well done piece.
Credit for the piece goes to Benjamin Td.