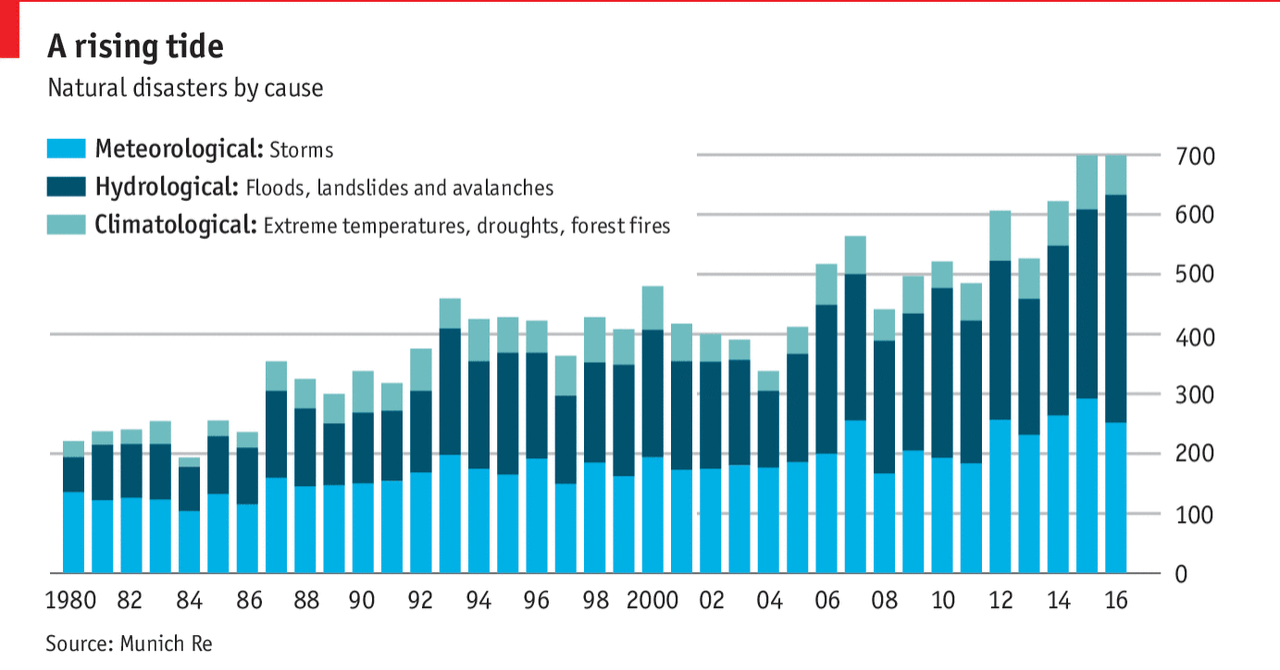
One more day of Harvey-related content. At least I hope. (Who knows? Maybe someone will design a fantastic retrospective graphic?) Today, however, we look at a piece from the Economist about the rising number of weather-related disasters, but thankfully falling numbers of deaths. The piece has all the full suite of graphics: choropleths, line charts, and bar charts (oh my!). But I want to look at the bar chart.

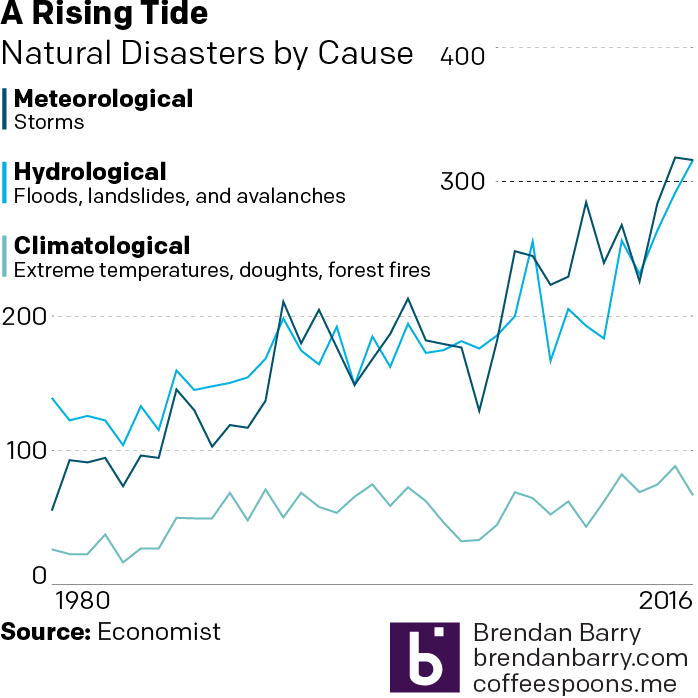
I cannot tell from this chart whether there has been any change in the individual elements, the meteorological, hydrological, or climatological disasters. And unfortunately stacked bar charts do not let us see that kind of detail. They only really allow us to see total magnitude and the changes in the element at the bottom of the stack, i.e. aligned with the baseline. So I took their chart and drew the shapes as lines and realigned everything to get this.

You can begin to see that meteorological might be overtaking hydrological, but it is too early to tell. And that right now, climatological causes are still far behind the other two.
Credit for the piece goes to the Economist Data Team.
Credit for mine goes to me.
