As many of you know, genealogy and family history is a topic that interests me greatly. This past weekend I spent quite a bit of time trying to sort through a puzzle—though I am not yet finished. It centred on identifying the correct lineages of a family living in a remote part of western Pennsylvania. The problem is the surname was prevalent if not common—something to be expected if just one family unit has 13 kids—and that the first names given to the children were often the same across family units. Combine that with some less than extensive records, at least those available online, and you are left with a mess. The biggest hiccup was the commonality of the names, however. It’s easier to track a Quinton Smith than a John Smith.
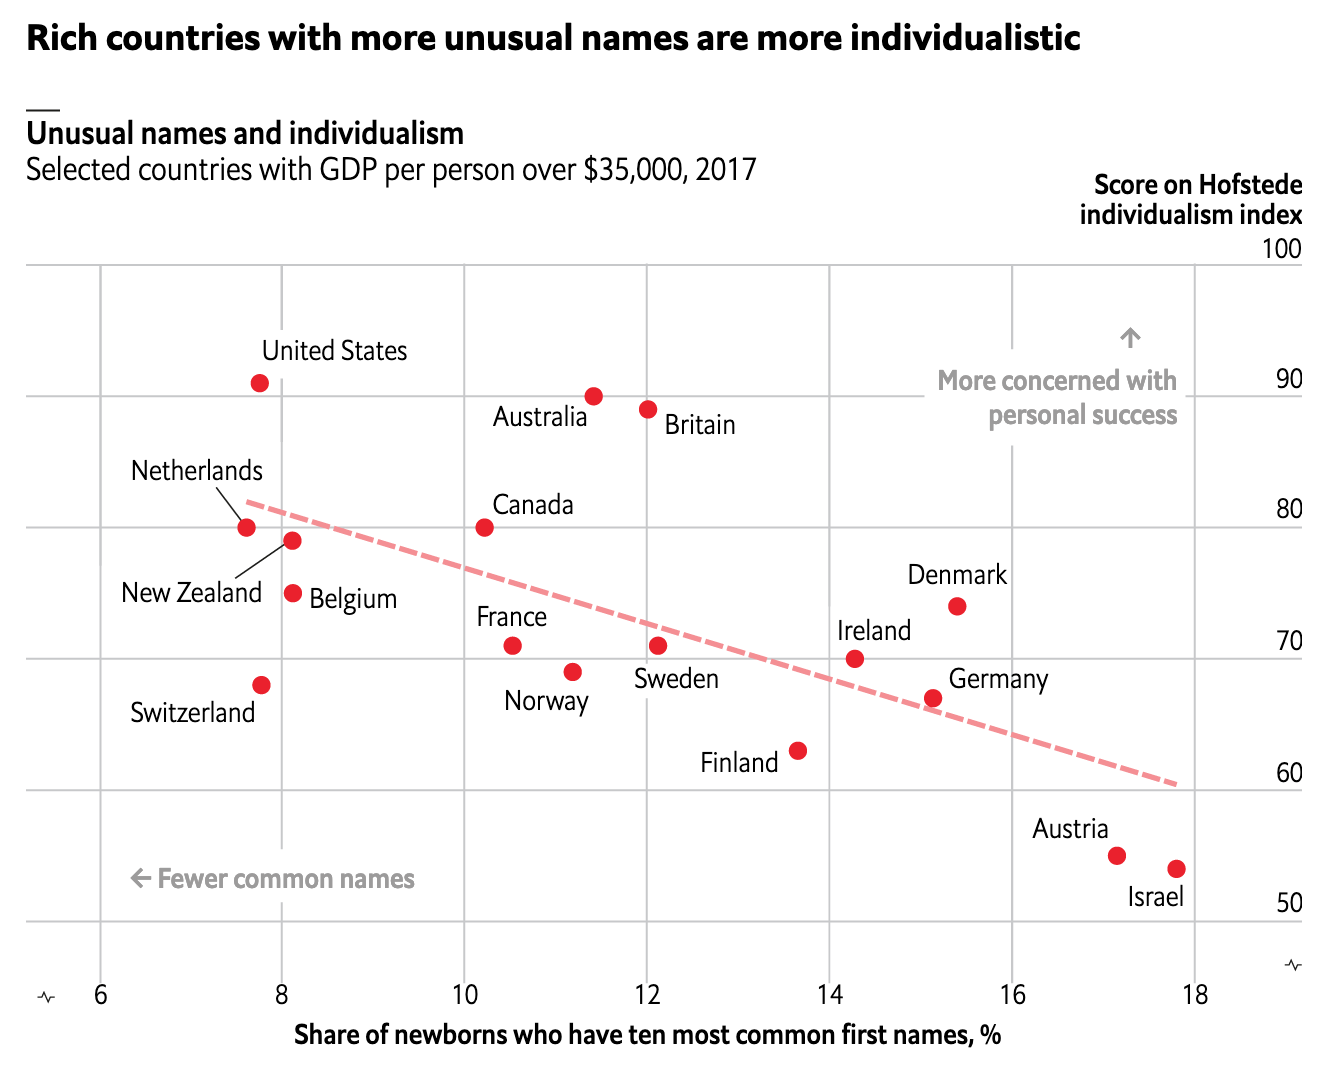
Taking a break from that for a bit yesterday, I was reminded of this piece from the Economist about two weeks ago. It looked at the individualism of the United States and how that might track with names. The article is a fascinating read on how the commonness or lack thereof for Danish names can be used as a proxy to measure the individualism of migrants to the United States in the 19th century. It then compares that to those who remained behind and the commonness of their names.

The scatter plot above is what the piece uses to introduce the reader to the narrative. And it is what it is, a solid scatter plot with a line of best fit for a select group of rich countries. But further on in the piece, the designers opted for some interesting dot plots and bar charts to showcase the dataset.
Now I do have some issues with the methodology. Would this hold up for Irish, English, German, or Italian immigrants in the 19th century? What about non-European immigrants? Nonetheless it is a fascinating idea.
Credit for the piece goes to the Economist Data Team.
