The UN climate summit begins in New York today. So let’s take a look at another data visualisation piece exploring climate change data. This one comes from a Washington Post article that, while largely driven by a textual narrative, does make use of some nice maps.
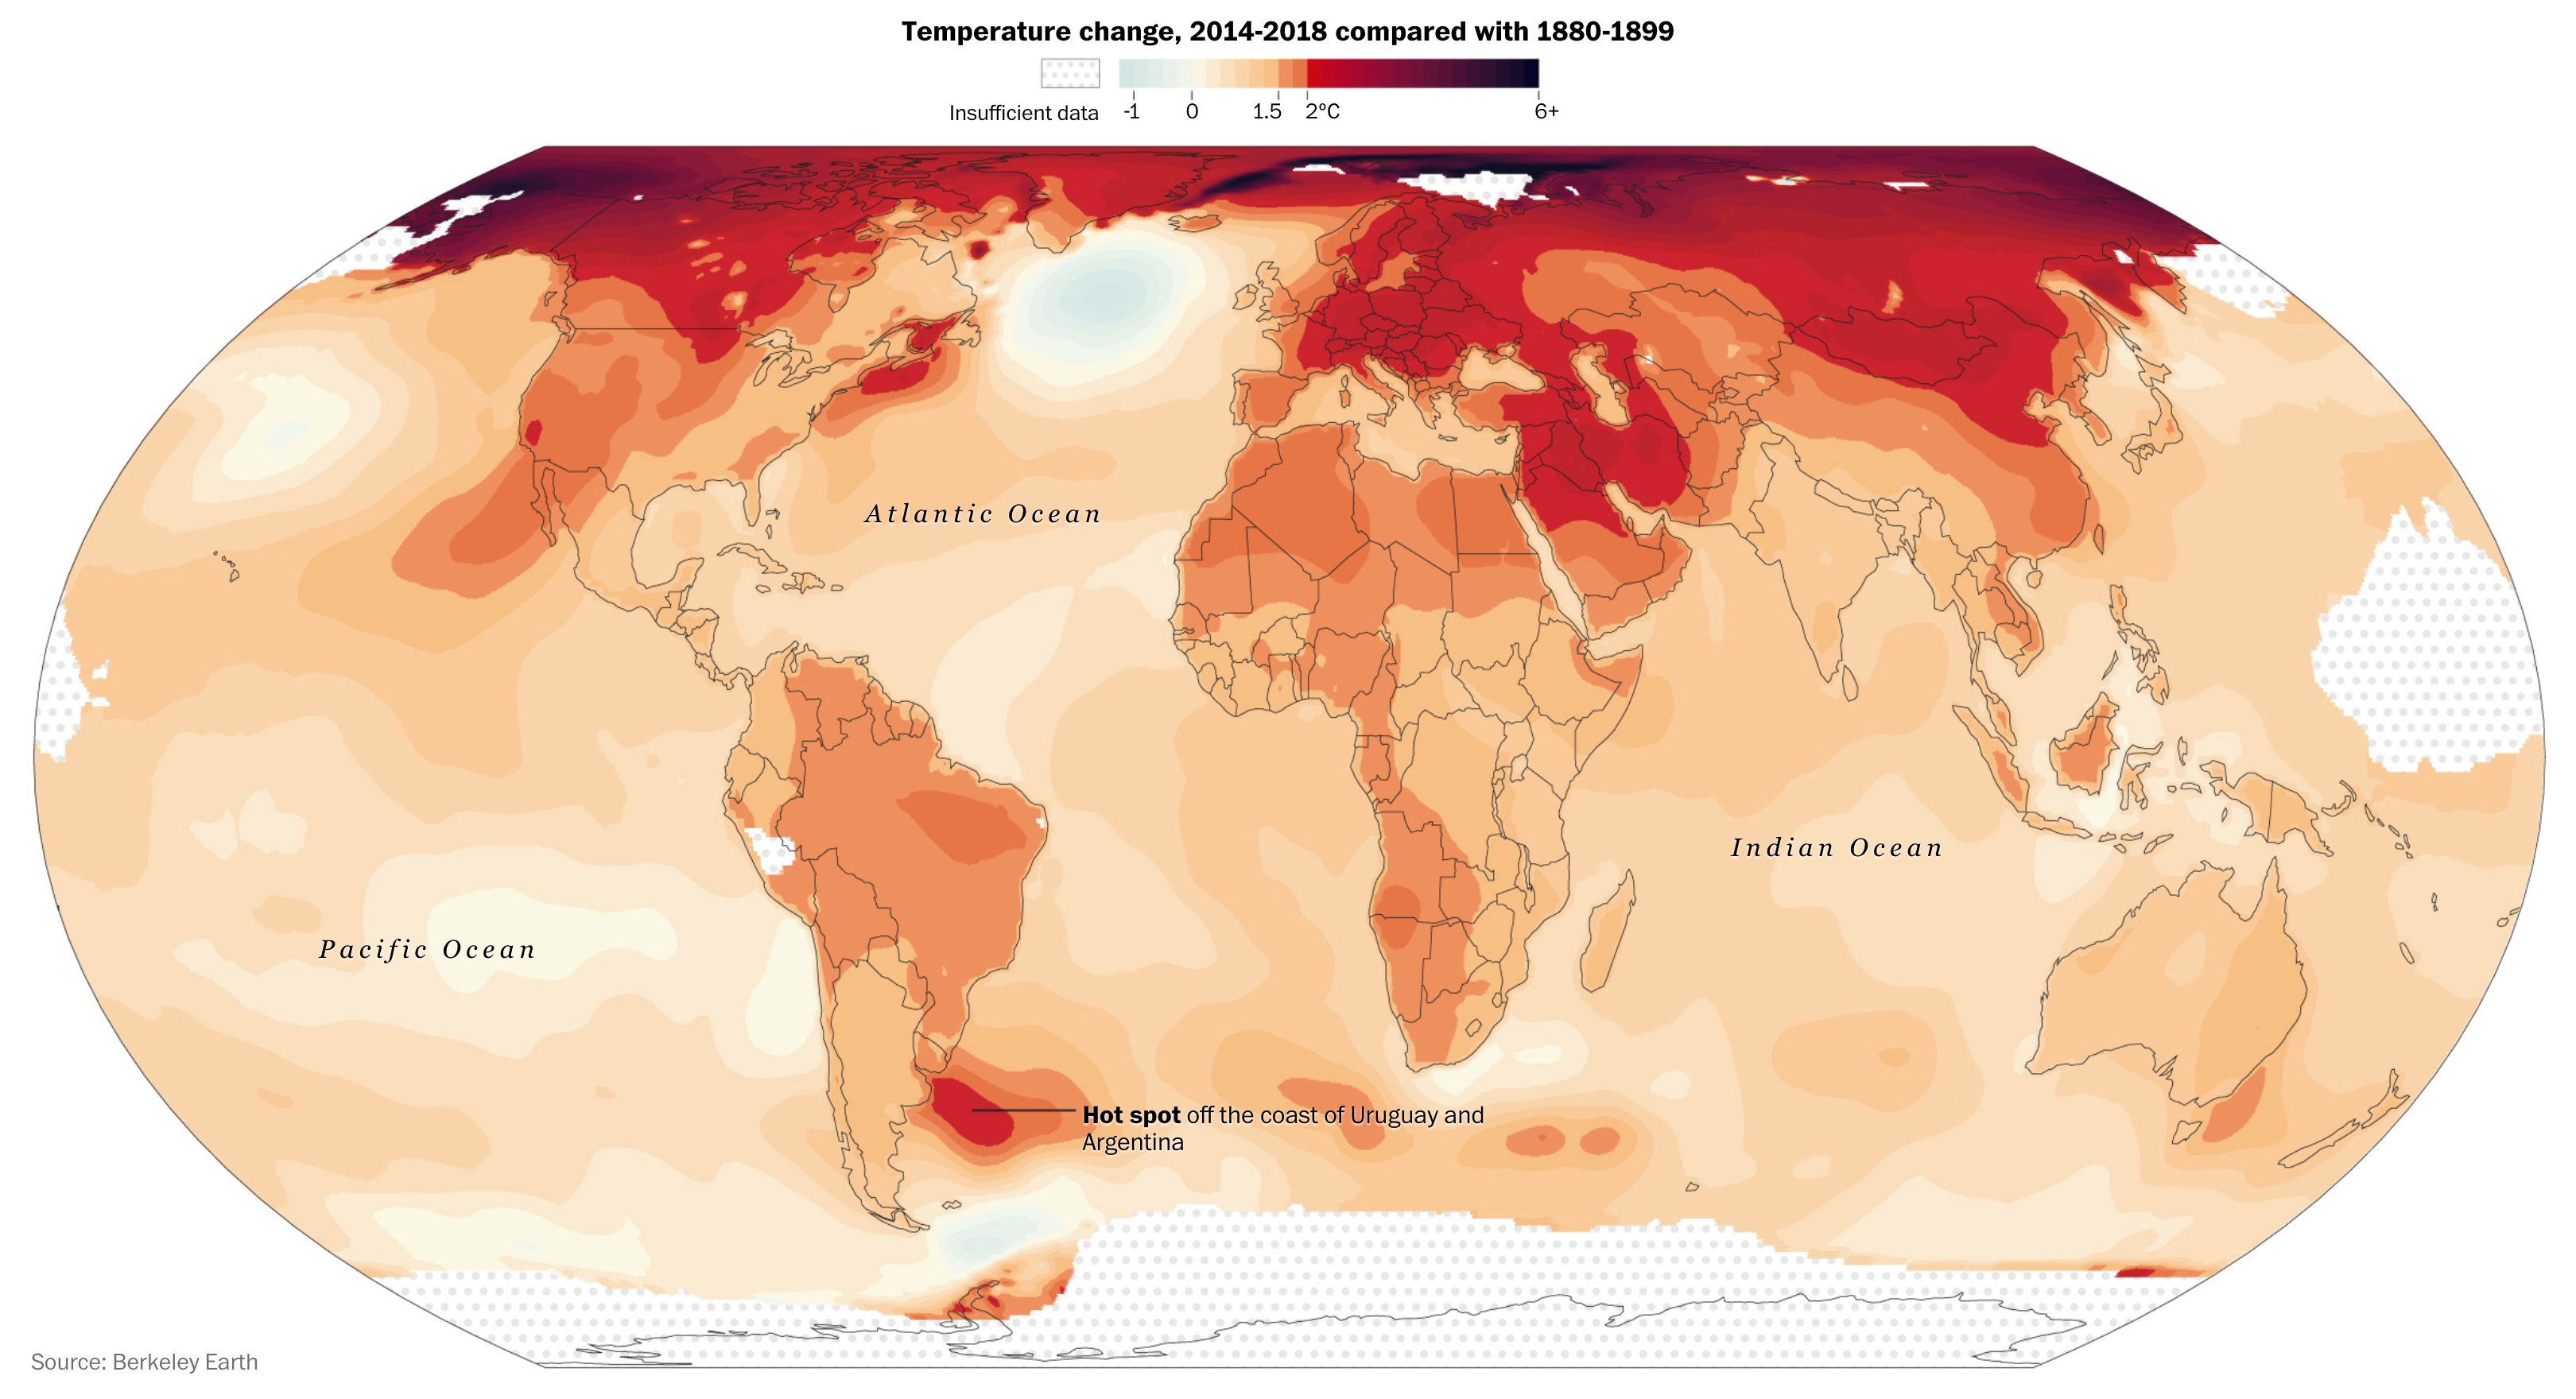
There is nothing too crazy going on with the actual map itself. I like the subtle use here of a stepped gradient for the legend. This allows for a clearer differentiation between adjacent regions and just how, well, bad things have become.
But where the piece shines is about halfway through. It takes this same map and essentially filters it. It starts with those regions with temperature changes over 2ºC. Then it progressively adds slightly less hotter regions to the map.
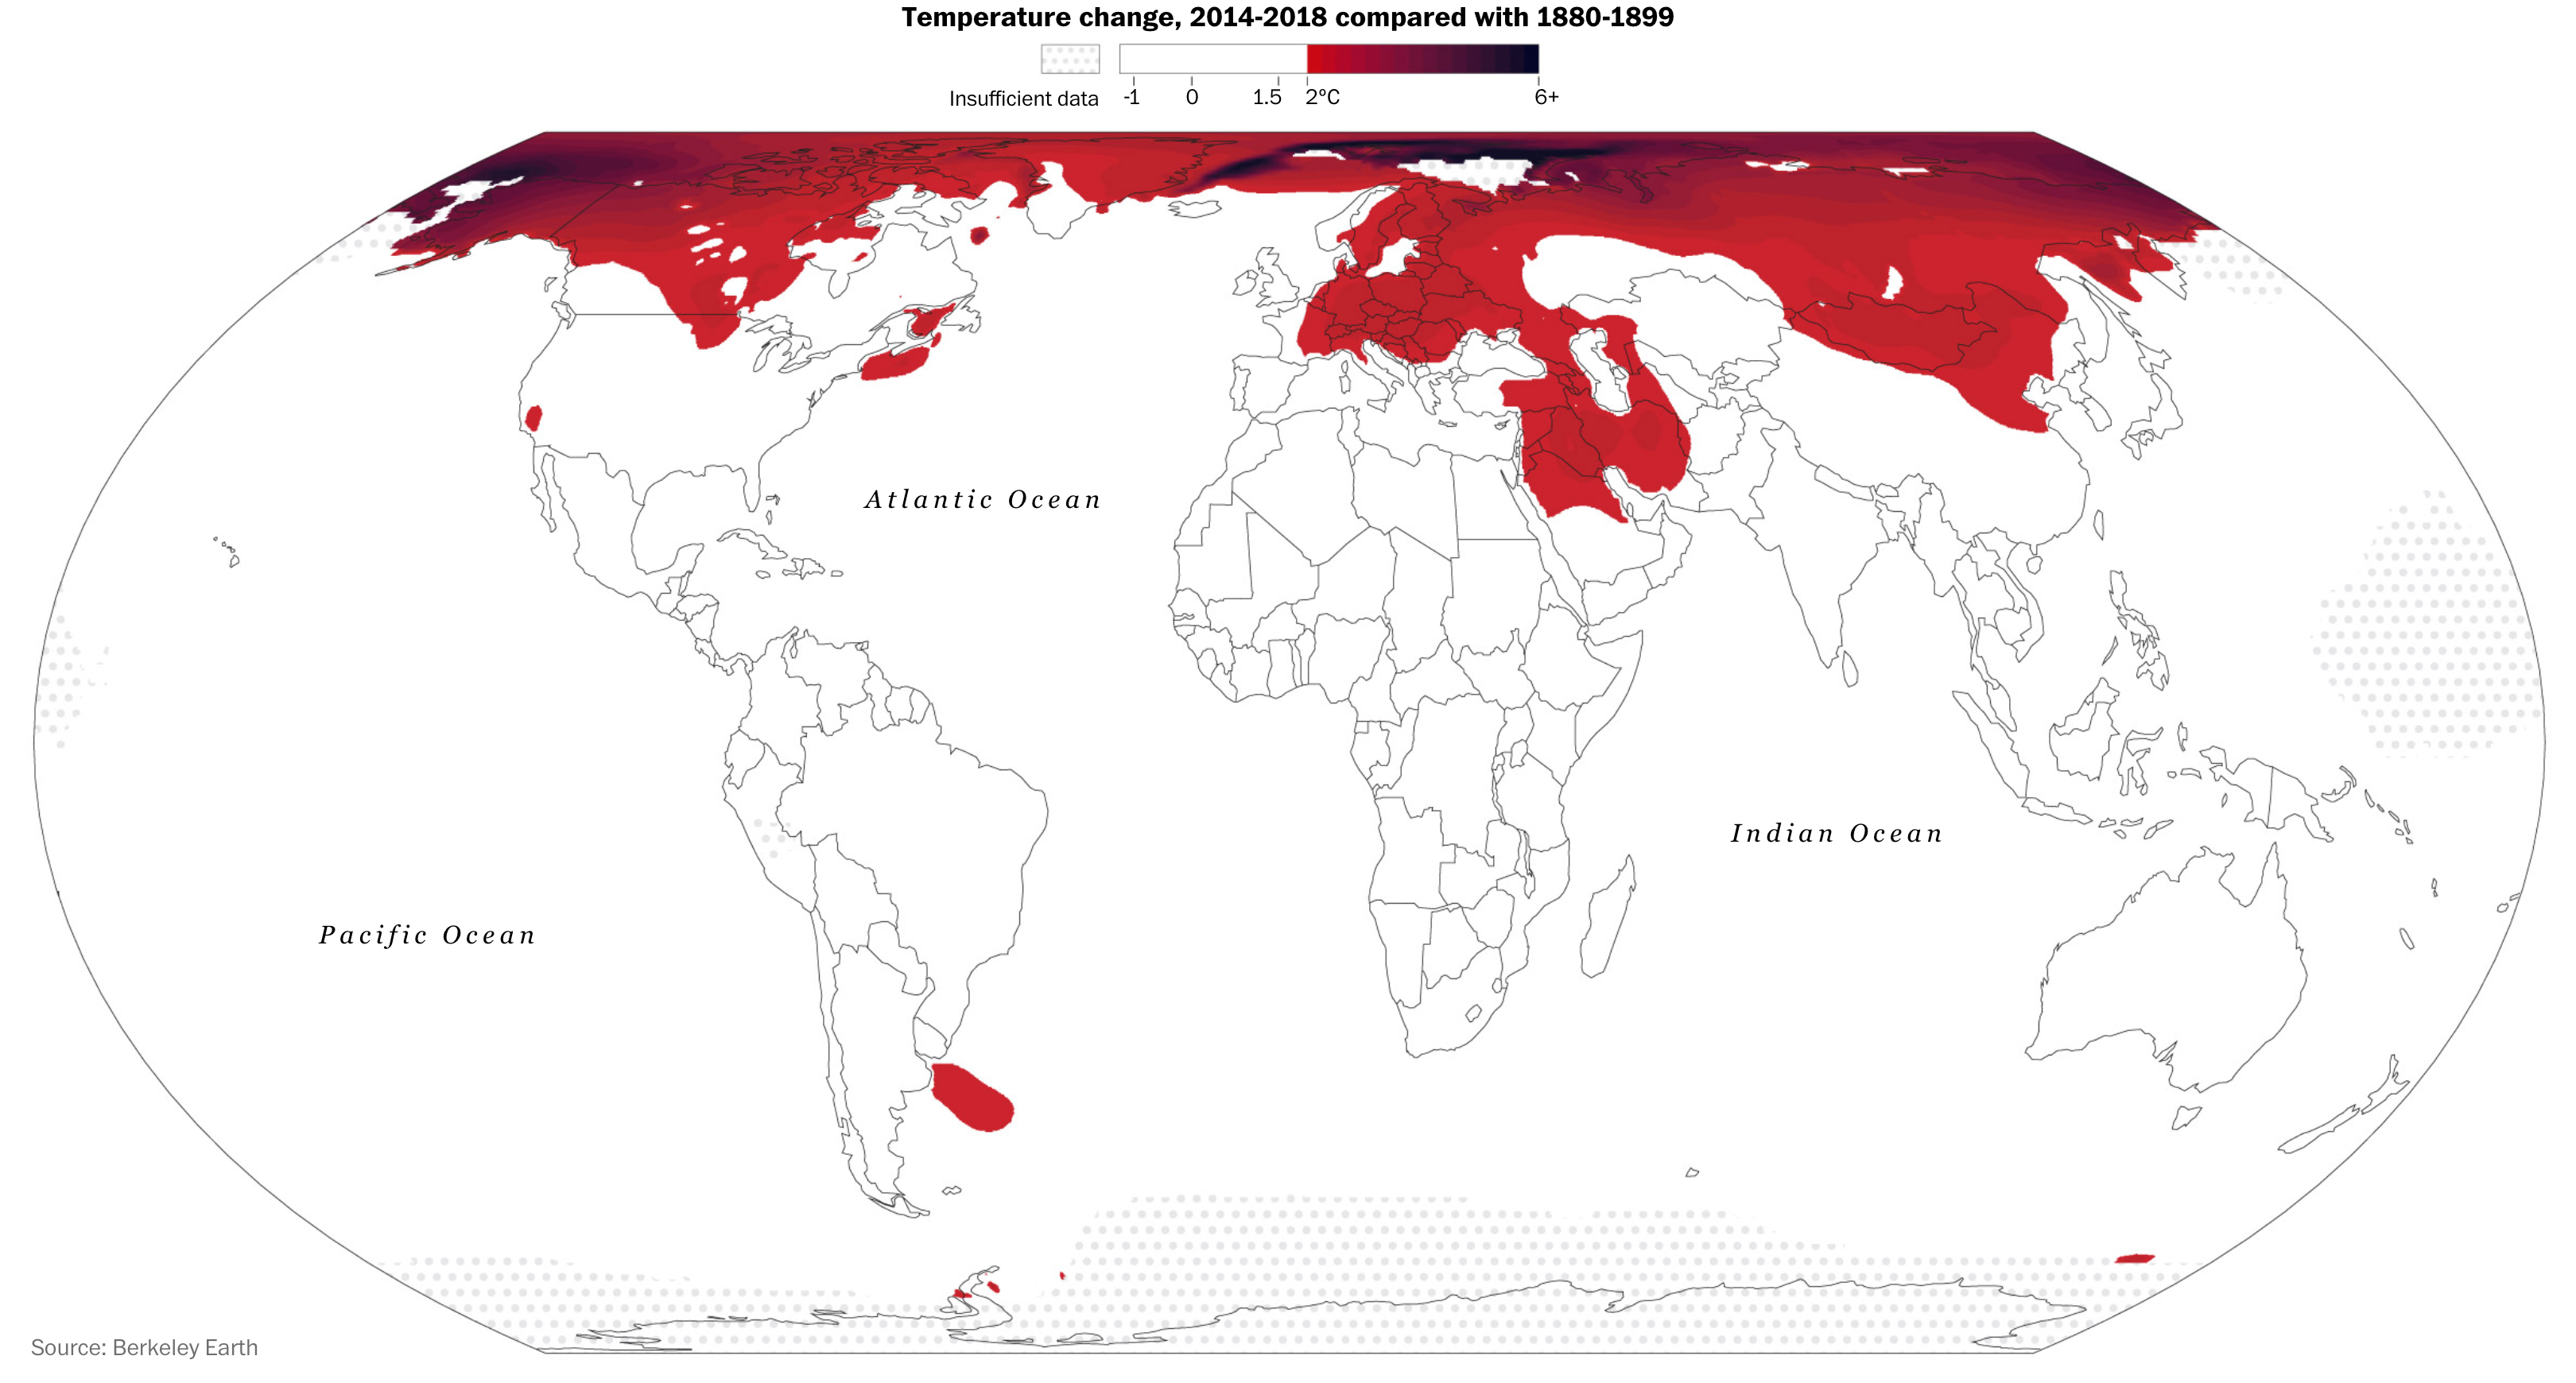
It’s a nice use of scrolling and filtering to highlight the areas worst impacted and then move down the horrible impact scale. And because this happens in the middle of the piece, giving it the full column width (online) allows the reader to really focus on the impacts.
Credit for the piece goes to Chris Mooney and John Muyskens.
Leave a Reply
You must be logged in to post a comment.