Last week when I wrote my update on Covid-19, we had seen a few signs for optimism, but in other states the news was hard to interpret or, in the case of Pennsylvania, not going the right way at all. So where are we this week? In some ways, not a lot has changed over the last seven days.
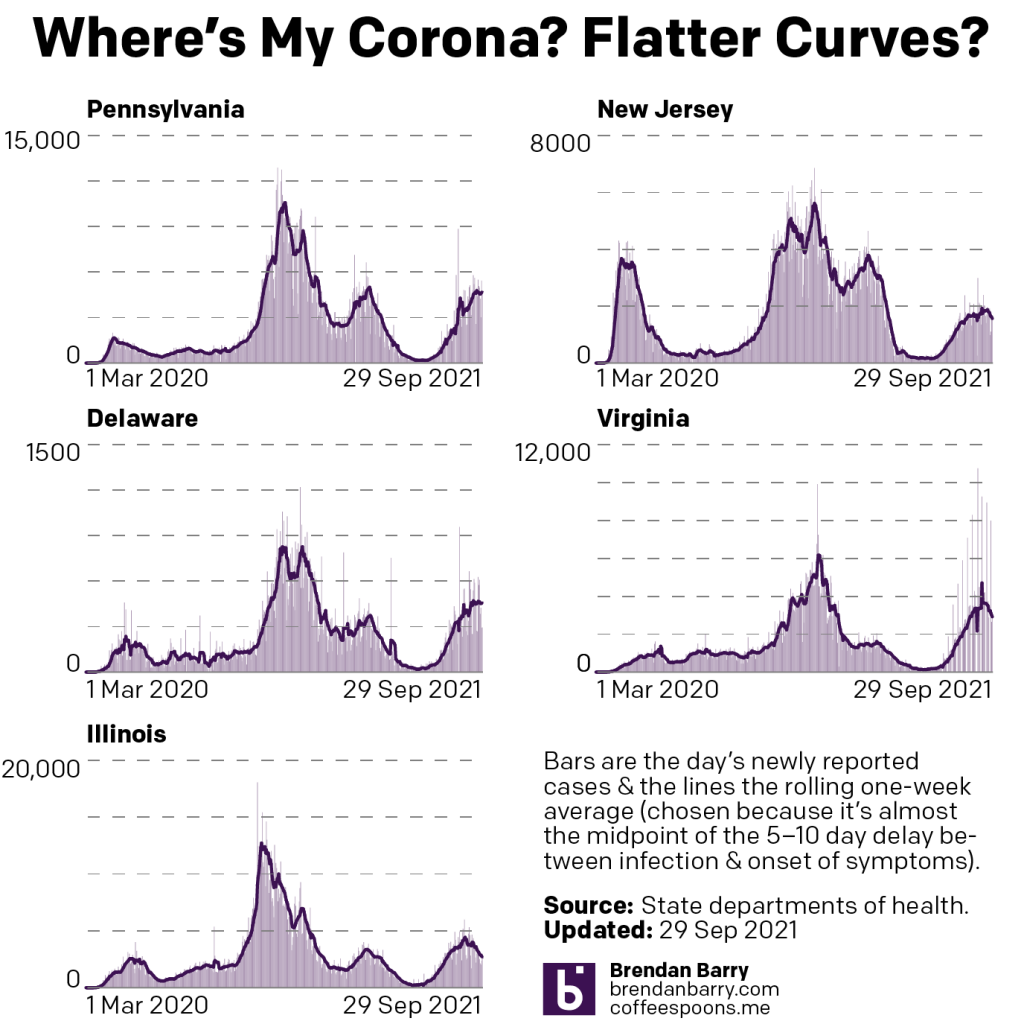
Last week, we had positive developments in both New Jersey and Illinois. There cases had begun to noticeably and consistently fall with clear peaks in this fourth wave of infections. Their seven-day averages were decidedly below their recent peaks. That trend continued last week. In fact, in Illinois the seven-day average is now also below the peak from not just this fourth wave, but also the third wave. That’s good.
New Jersey’s fourth wave was nowhere near as impactful as its first three. It helps to have one of the highest vaccination rates in the United States. But the Garden State’s seven-day average is also falling, though not as quickly as in Illinois. You could even make the argument that over the last week cases have really remained flat, though the last few days I would contend are evidence of a slow slowdown.
Delaware had been a tricky state to judge given some recent volatility in its average. But as we can see over the last week the new case curve clearly has flattened. The flat line, however, remains just that, a flat line. This is more of a plateau shape than a descending hill shape. That means that cases are continuing to spread, but at a steady rate of about 450 new cases per day. This isn’t uncommon, but hopefully it precedes a fall in new cases rather than serving as a respite on an ever upward climb.
In Virginia I had mentioned some early indications of a potential flattening, the first step towards a decline in the average. That flattening appears to be taking hold. In the chart above you can clearly see a sharp decline beginning to take root in Old Dominion. The curve here most closely resembles Illinois in what, at least for now, is a fairly symmetrical increase and decrease.
Finally we have Pennsylvania. I was pretty short in my analysis last week, the state was headed in the wrong direction. The latest data shows that the Commonwealth may just be beginning to turn the corner and flatten the curve. However, after the pre-Labour Day slowdown that then erupted into a full-blown outbreak, I’m wary of saying anything definitive about Pennsylvania. All we can do is hope that these early trends hold true.
So what about deaths? Are we seeing any progress on that front? Last week I noted that it was almost all bad news. In all but Illinois we had death rates continuing to climb.
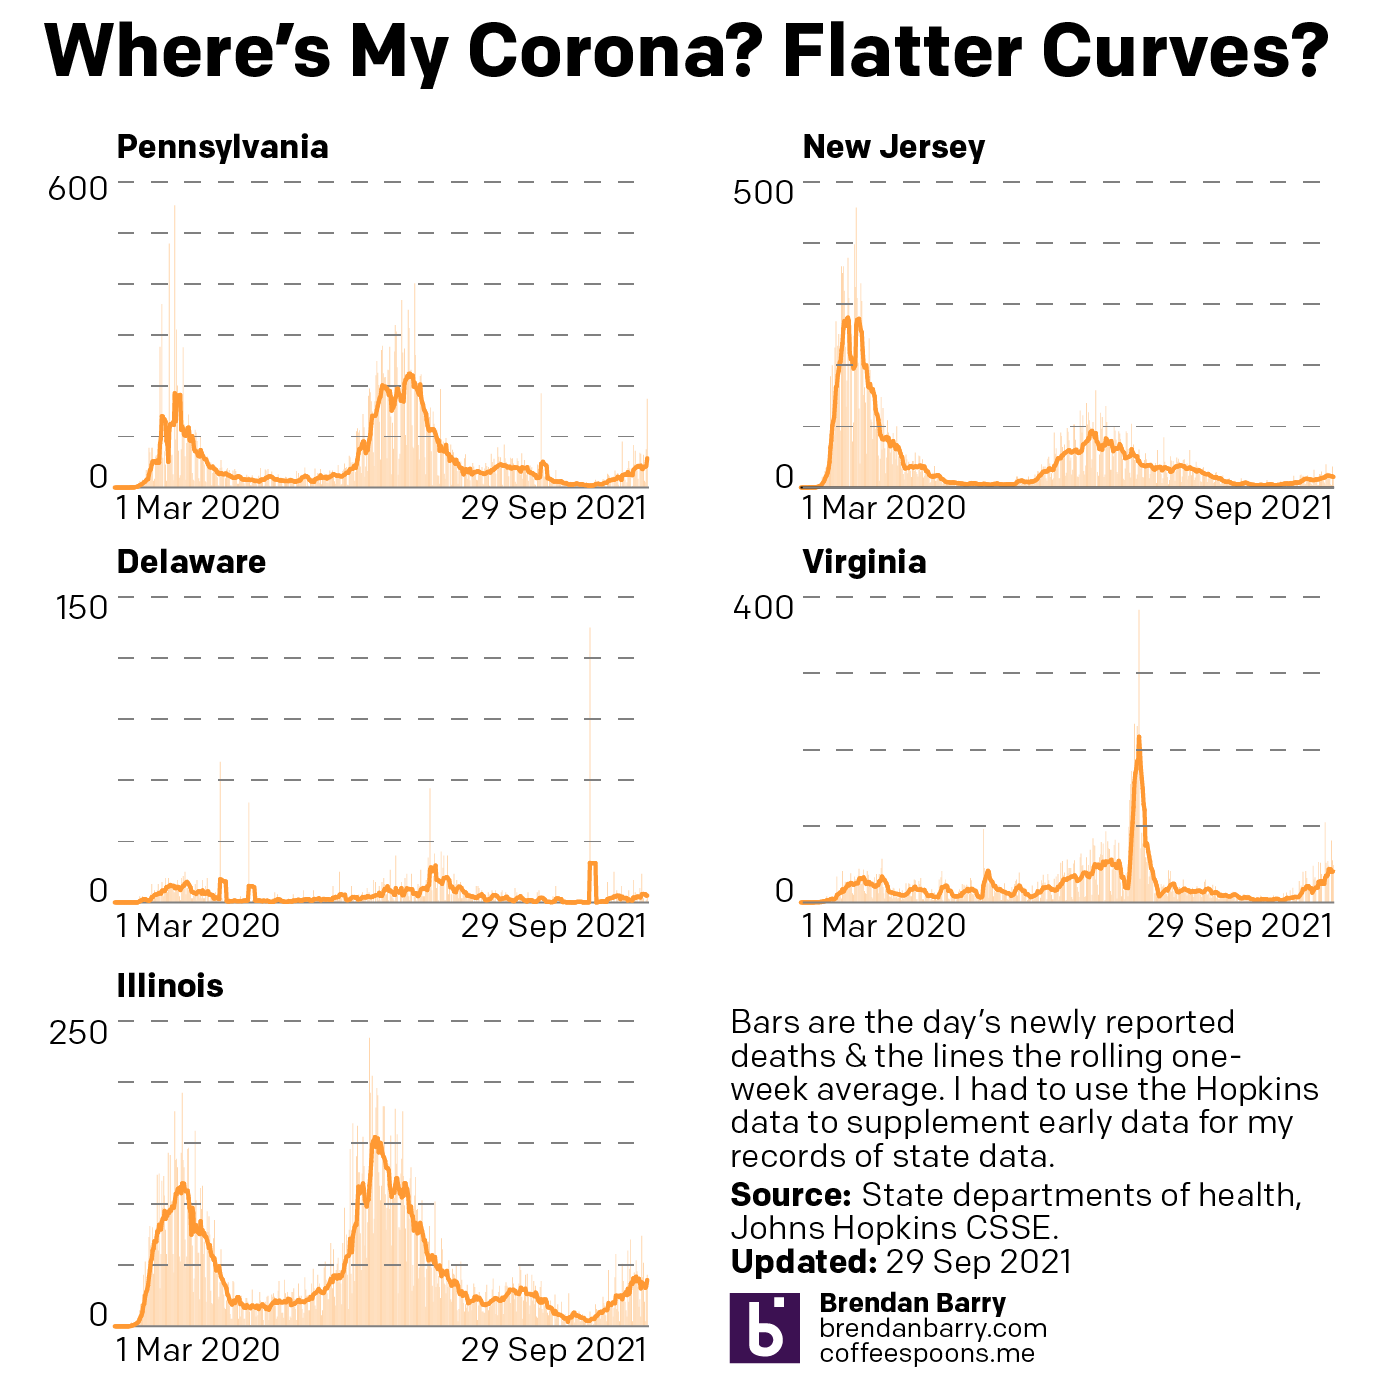
That story, sadly, remains largely the same. Illinois, unfortunately has actually seen its seven-day average resume ticking upwards, although not by a significant degree. It’s enough that I think it fair to say deaths have largely plateaued and not necessarily begun to climb. And as I keep saying, that would track for a state where we have seen new cases falling for the last few weeks now.
Unfortunately, that’s about it. Deaths in New Jersey have remained fairly stable, though the average has moved from 19.3 to 17.4 as of yesterday. Perhaps that could be an indication of a falling death rate. But just a few days ago it was still nearer 19 than 18. I would want to see more data showing a consistent and persistent decline before saying New Jersey is headed the right way.
And in Pennsylvania, Delaware, and Virginia, deaths are headed the wrong way, plain and simple. At the beginning of the sample set, Delaware reported 14 deaths in one day, the most in a month. Consequently the average has jumped from 2.6 last week to 3.4 today. In Virginia we had seen deaths jump from 20 to 34. Well this week they jumped again, though by half the amount, to 41 deaths per day. Pennsylvania performed the worst, however. Deaths here climbed from 43 to 57 per day.
While we have seen new cases plateau in Delaware and begin to fall in Virginia, which should mean declining death rates in a few weeks, in Pennsylvania the numbers of new cases may only be beginning to flatten. Consequently, unless we begin to see a sharp decline in new cases, we will likely continue to see rising deaths in the Commonwealth. At least for a little while longer.
Credit for the piece is mine.
Leave a Reply
You must be logged in to post a comment.